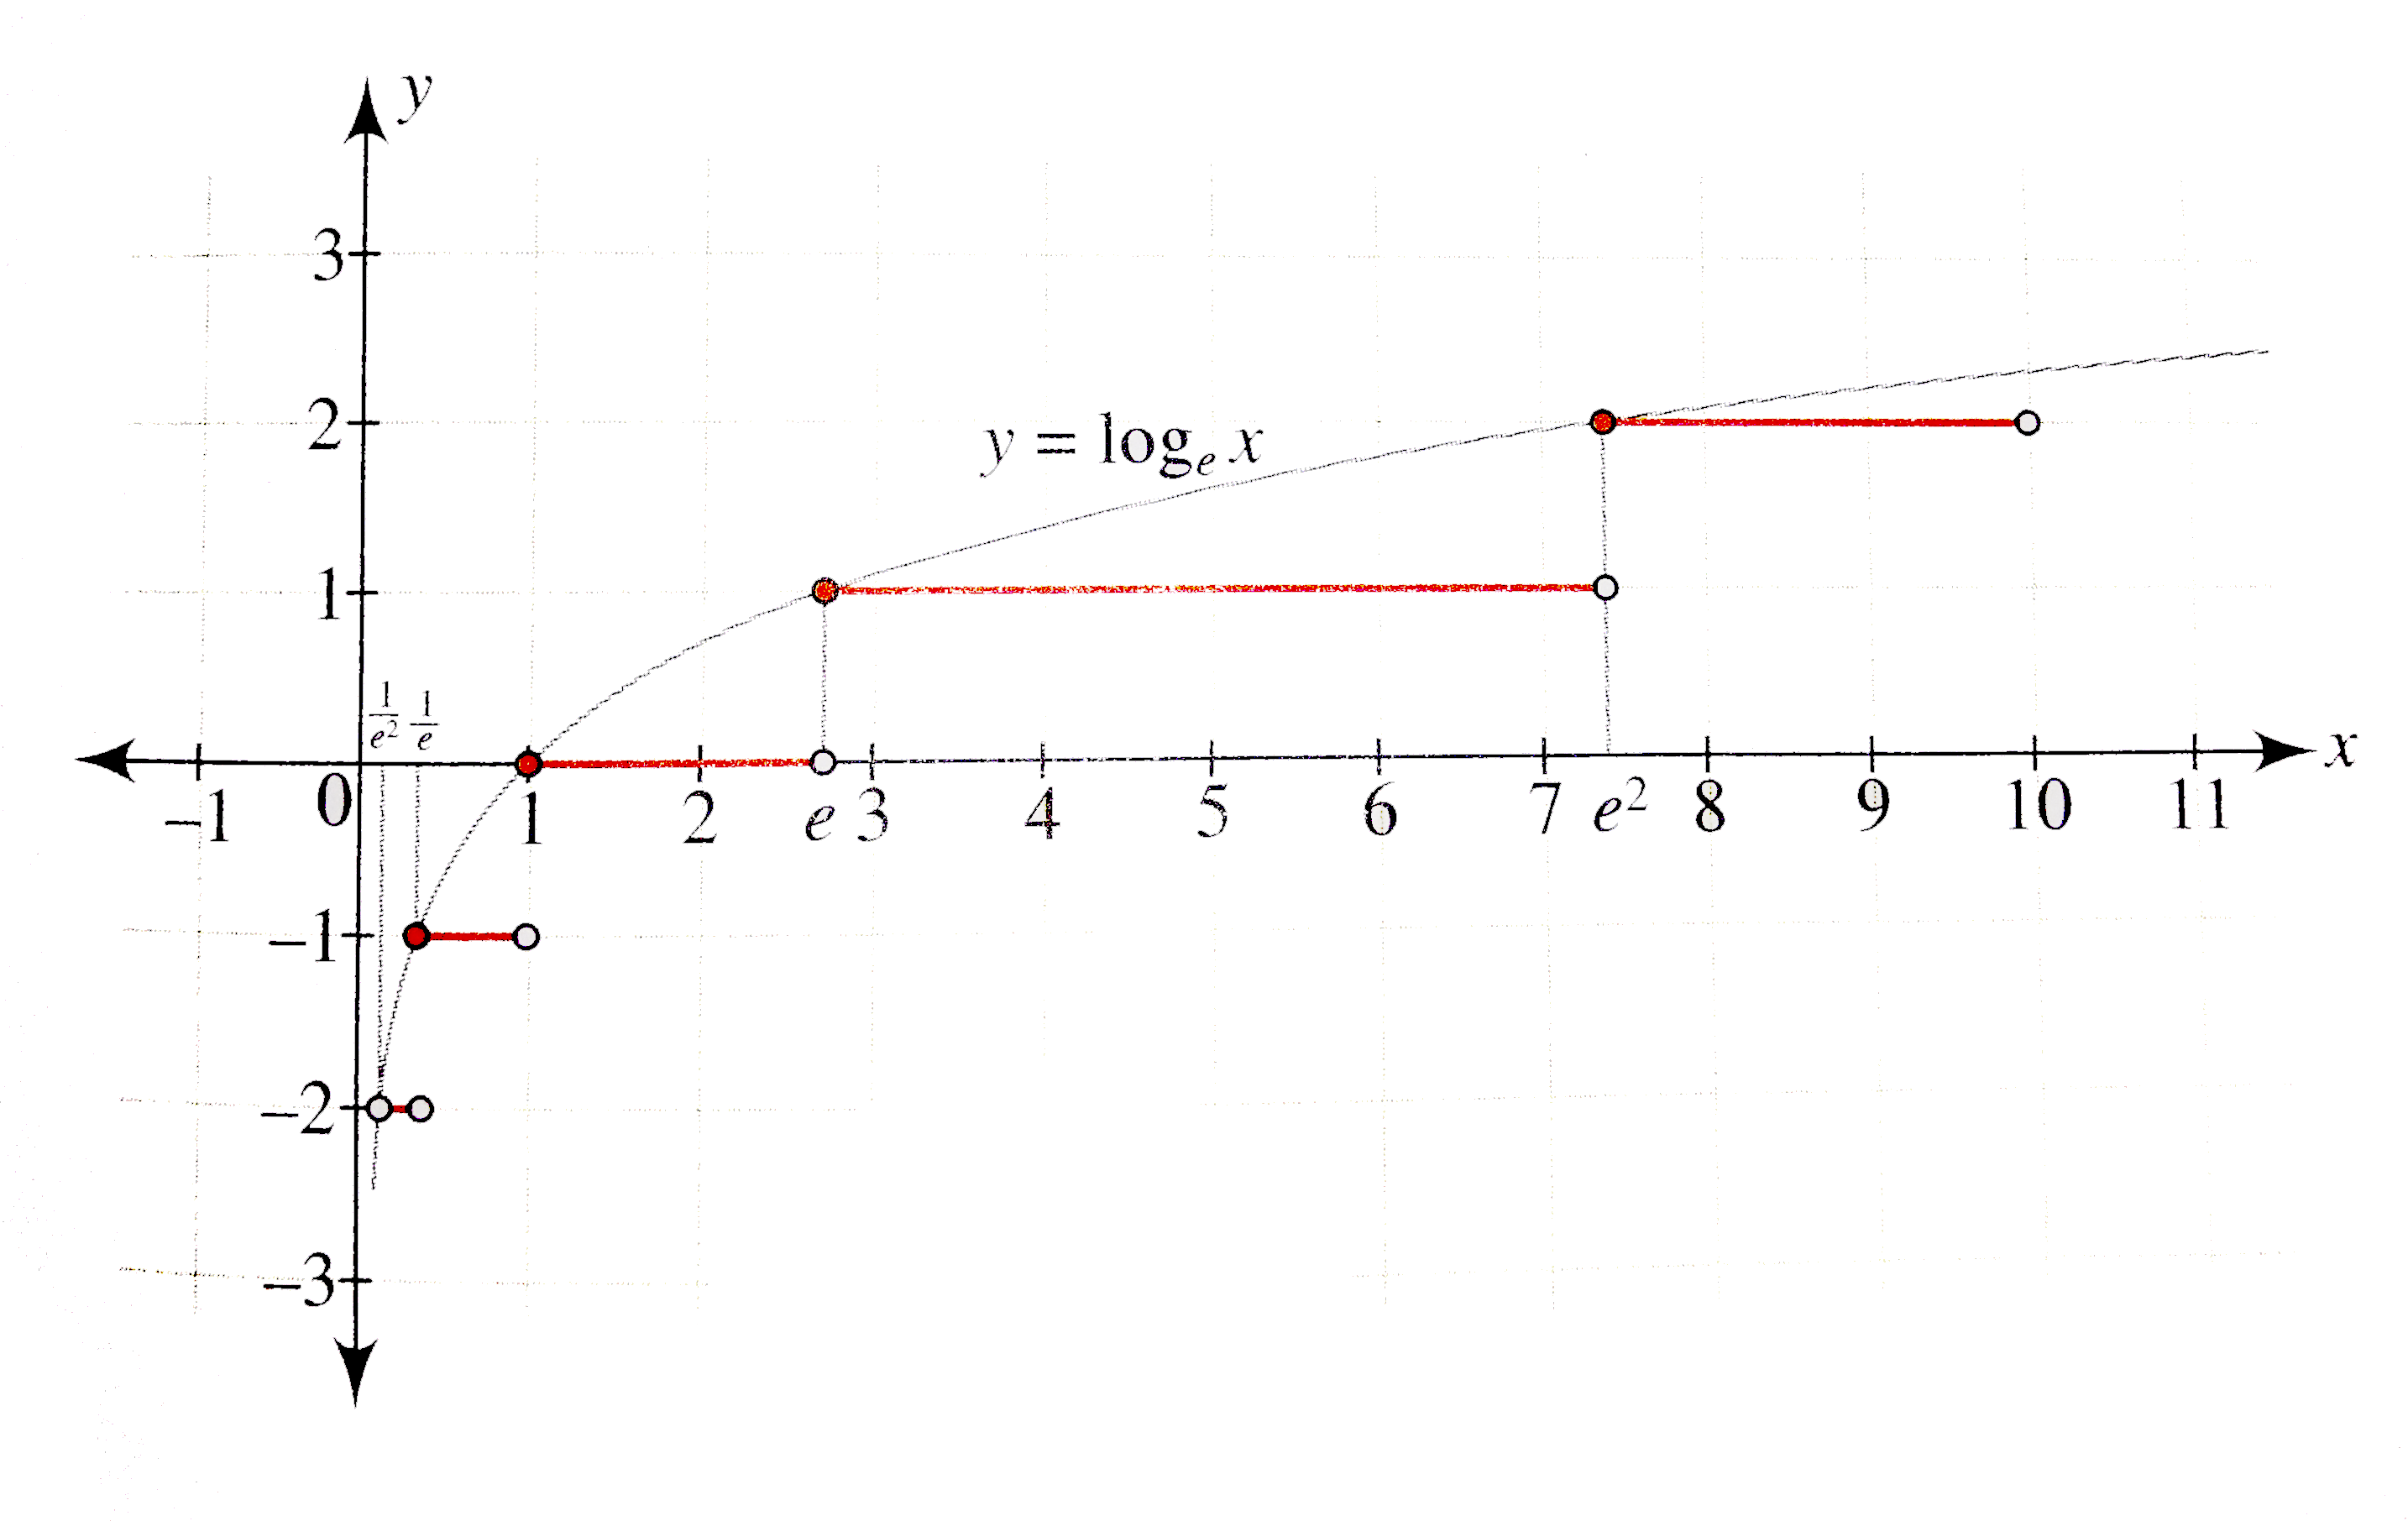
Draw the graph of f(x)=[logex],e−2<x<10, where [⋅] represents the greatest integer function.
Video Solution
Text Solution
We have f(x)=[logex],e−2<x<10 ltBrgt logex is an incresing function in its entire domain.
So [logex] is discontinuous when logex is an integer.
Now e−2<x<10
∴ −2<logex<10
So [logex] is discontinuous when logex=−1,0,1,2.
∴ x=e−1,1,e,e2
∴ f(x)=[logex]=⎧⎪
⎪
⎪
⎪
⎪
⎪
⎪
⎪
⎪⎨⎪
⎪
⎪
⎪
⎪
⎪
⎪
⎪
⎪⎩−2,x∈[e−2,e−1)orlogex∈[−2,−1)−1,x∈[e−1,1)orlogex∈[−1,0)0,x∈[1,e)orlogex∈[0,1)1,x∈[e,e2)orlogex∈[1,2)2,x∈[e2,10)orlogex∈[2,loge10)

|
Updated on:21/07/2023
Topper's Solved these Questions
- BOOK - CENGAGECHAPTER - GRAPHS OF ELEMENTARY FUNCTIONS EXERCISE - Exercise34videos
GRAPHS OF ELEMENTARY FUNCTIONS
- BOOK - CENGAGECHAPTER - GRAPHS OF POLYNOMIAL AND RATIONAL FUNCTIONSEXERCISE - Exercise13videos
GRAPHS OF POLYNOMIAL AND RATIONAL FUNCTIONS
- BOOK - CENGAGECHAPTER - GRAPHS OF TRIGONOMETRIC FUNCTIONSEXERCISE - Exercise22videos
GRAPHS OF TRIGONOMETRIC FUNCTIONS
Similar Questions
Knowledge Check
- Question 1 - Select One or More
If f(x)=x(e|x|+[x]−2|x|+[x]) then (where [.] represent the greatest integer function)
Alimx→0+f(x)=−1Blimx→0−f(x)=0Climx→0f(0)=−1Dlimx→0f(x)=0
Draw the graph of f(x)=cosπ[x], where [⋅] represents the greatest integer function. Find the period of the function.
View SolutionDraw the graph of |y|=[x], where [.] represents the greatest integer function.
View SolutionDraw the graph of y=[cosx],x∈[0,2π], where [⋅] represents the greatest integer function.
View SolutionDraw the graph of f(x)=[x2],x∈[0,2), where [⋅] denotes the greatest integer function.
View SolutionDraw the graph of y=[sinx],x∈[0,2π], where [⋅] represents the greatest integer function.
View SolutionDraw the graph of y=[4−x2],|x|≤2, where [.] represents the greatest integer function.
View SolutionDraw the graph of f(x)=[cot−1x], where [⋅] represents the greatest integer funtion.
View Solution

