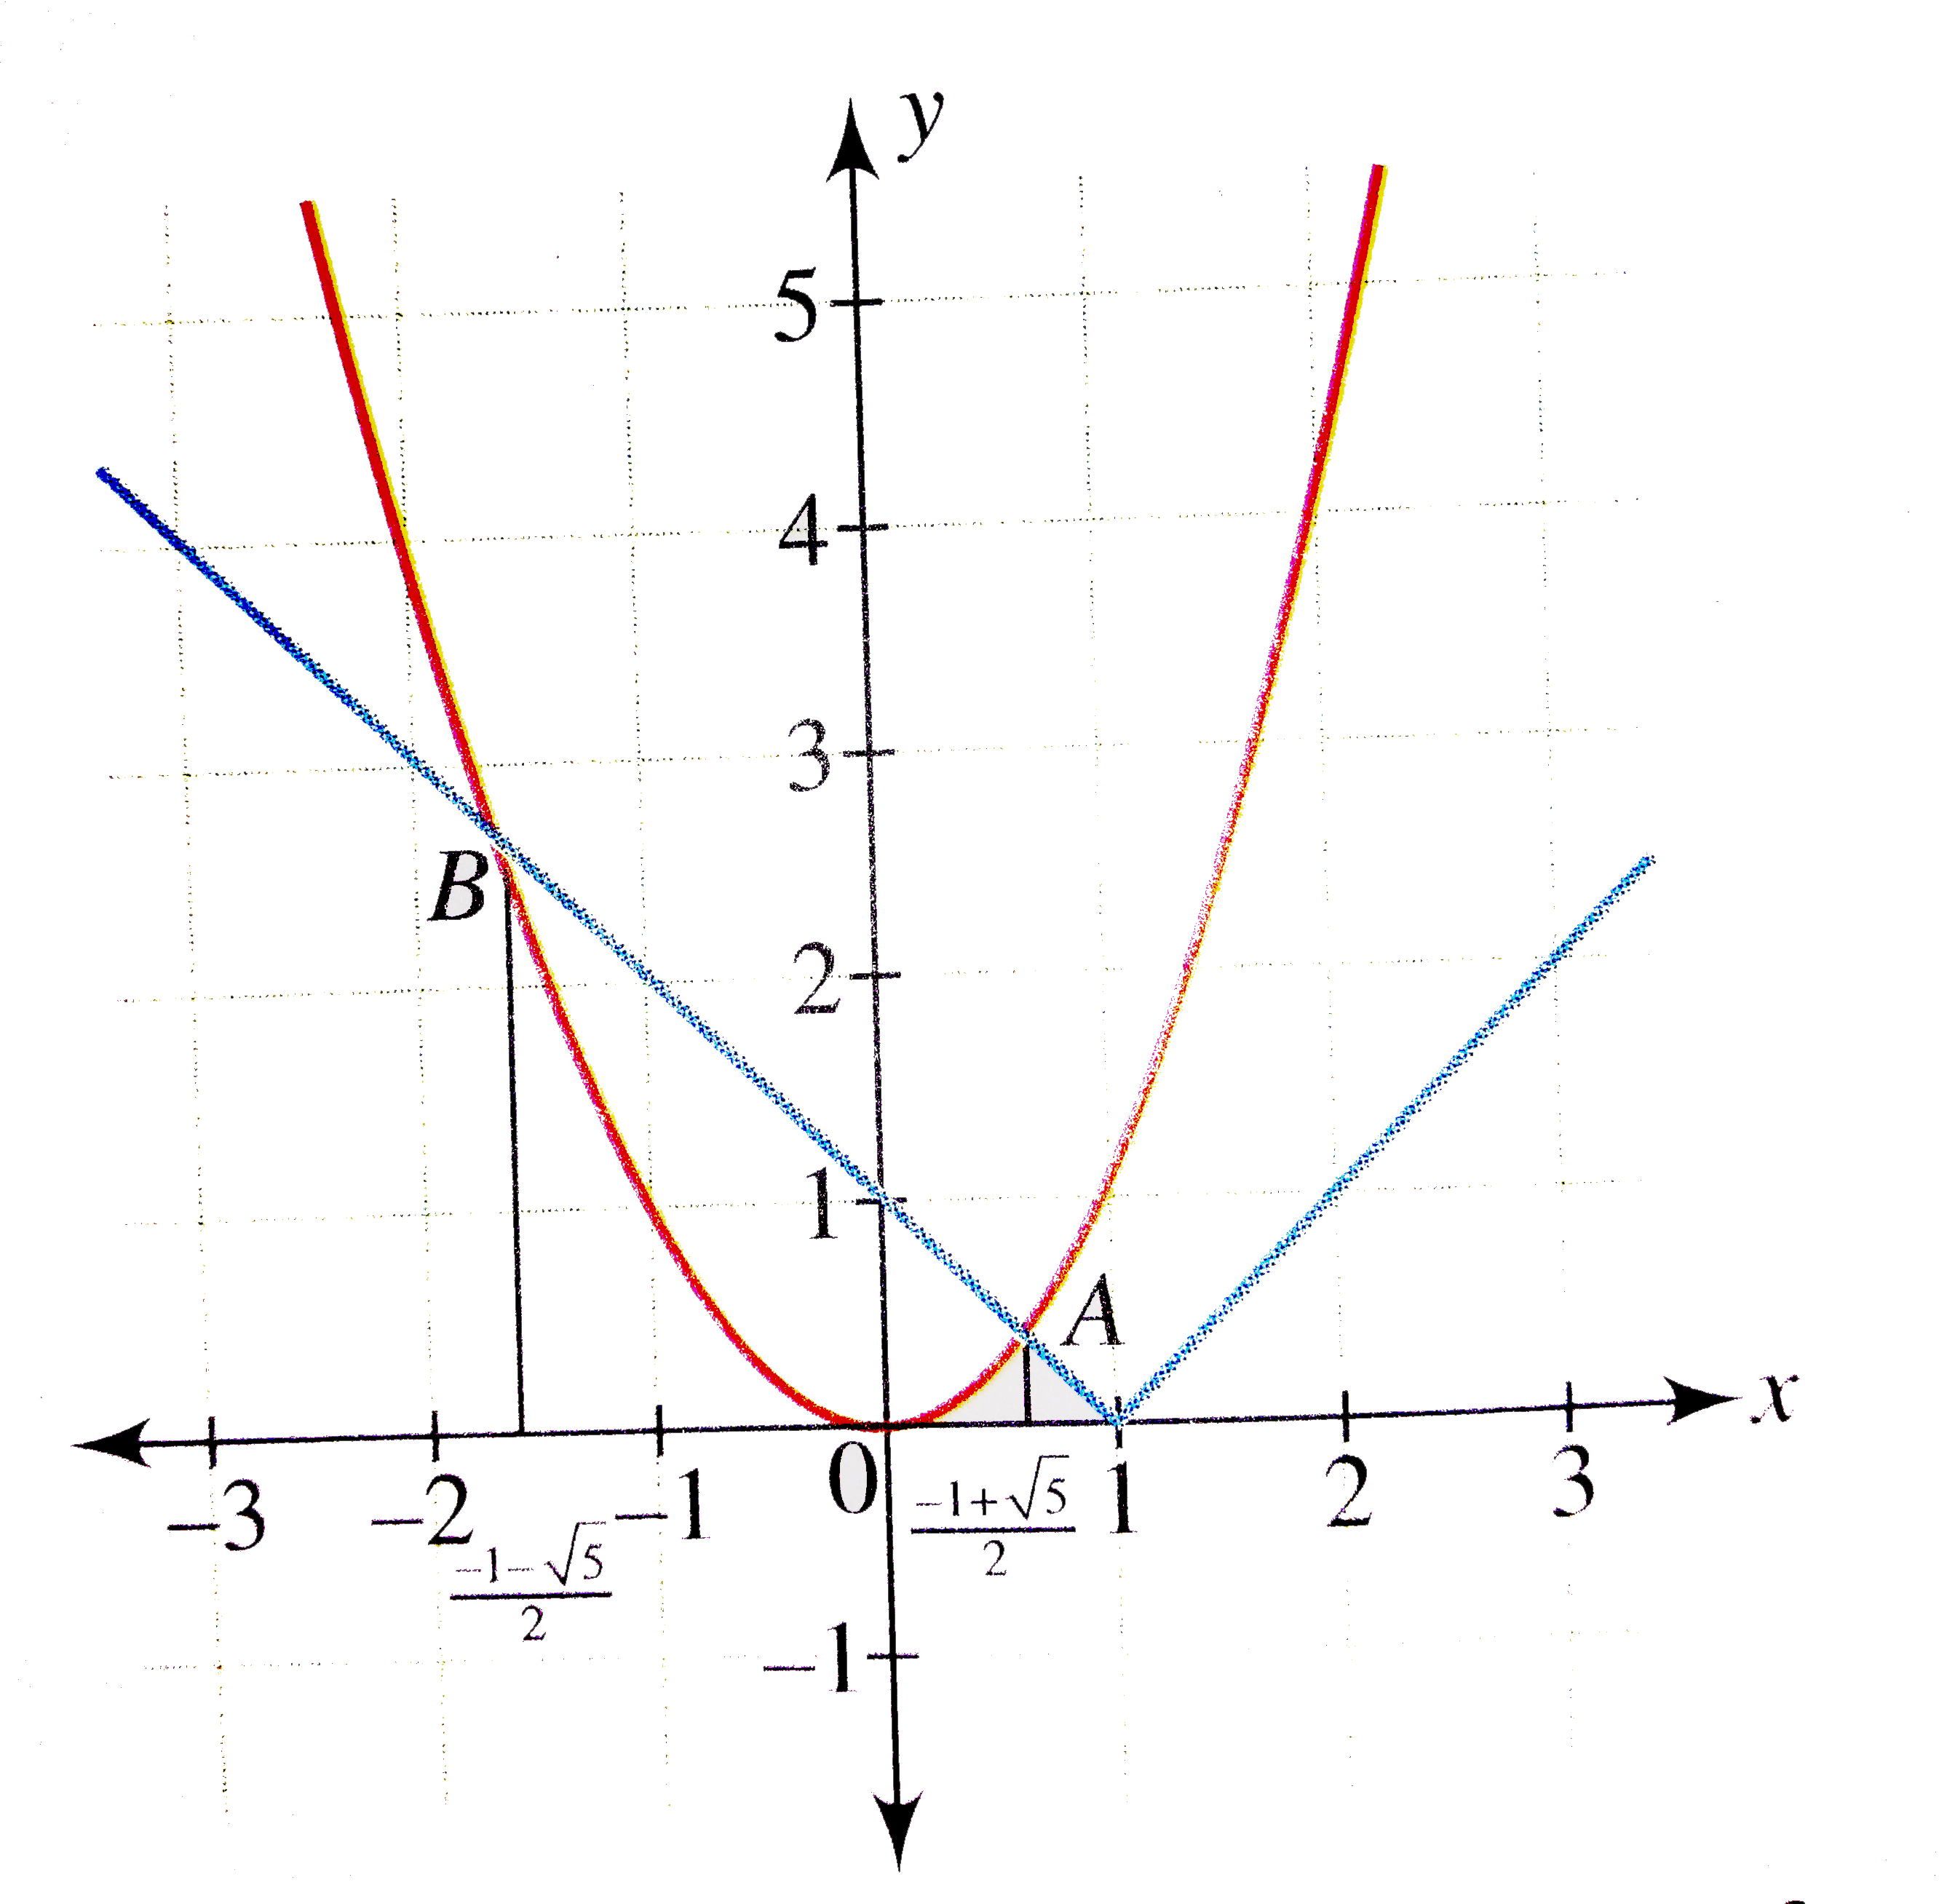
Draw the graph of the function: Solve ∣∣∣x2x−1∣∣∣≤1 using the graphical method.
Video Solution
Text Solution
We have ∣∣∣x2x−1∣∣∣
or x2≤|x−1|,x≠1 (i)
To solve the inequality, we draw the graphs of y=x2andy=|x−1| as shown in the adjacent figure.
Solving y=|x−1|andy=x2 for their points of intersection A and B, we have x−1=x2orx2−x−1=0
or x=−1±√52
The solution set of (i) is the set of those values of x for which the graph of y=x2 lies below the graph of y=x−1
From the graph, the solution is [−1−√52,−1+√52]

|
Topper's Solved these Questions
- GRAPHS OF ELEMENTARY FUNCTIONS BOOK - CENGAGECHAPTER - GRAPHS OF ELEMENTARY FUNCTIONS EXERCISE - Exercise
34 Videos
- GRAPHS OF POLYNOMIAL AND RATIONAL FUNCTIONSBOOK - CENGAGECHAPTER - GRAPHS OF POLYNOMIAL AND RATIONAL FUNCTIONSEXERCISE - Exercise
13 Videos
- GRAPHS OF TRIGONOMETRIC FUNCTIONSBOOK - CENGAGECHAPTER - GRAPHS OF TRIGONOMETRIC FUNCTIONSEXERCISE - Exercise
22 Videos
Similar Questions
Knowledge Check
Solve : x+2x+1<0
A(−∞,−2)U(−1,∞)B(−2,−1)CRDNone of these
Draw the graph of the function f(x)=xx
View SolutionDraw the graph of the function f(x)=(1x)x
View SolutionDraw the graph of the function: f(x)=∣∣x2−3∣∣x|+2|
View SolutionDraw the graph of the function: f(x)=−|x−1|12
View SolutionDraw the graph of the function f(x)=(1+1x)2
View SolutionDraw the graph of the function f(x)=|x|+|x−1|
View SolutionDraw graph of x<−y
View Solution
