Draw the graph of y=sin−1(sinx)
Text Solution
y=sin−1(sinx)
⇒ siny=sinx
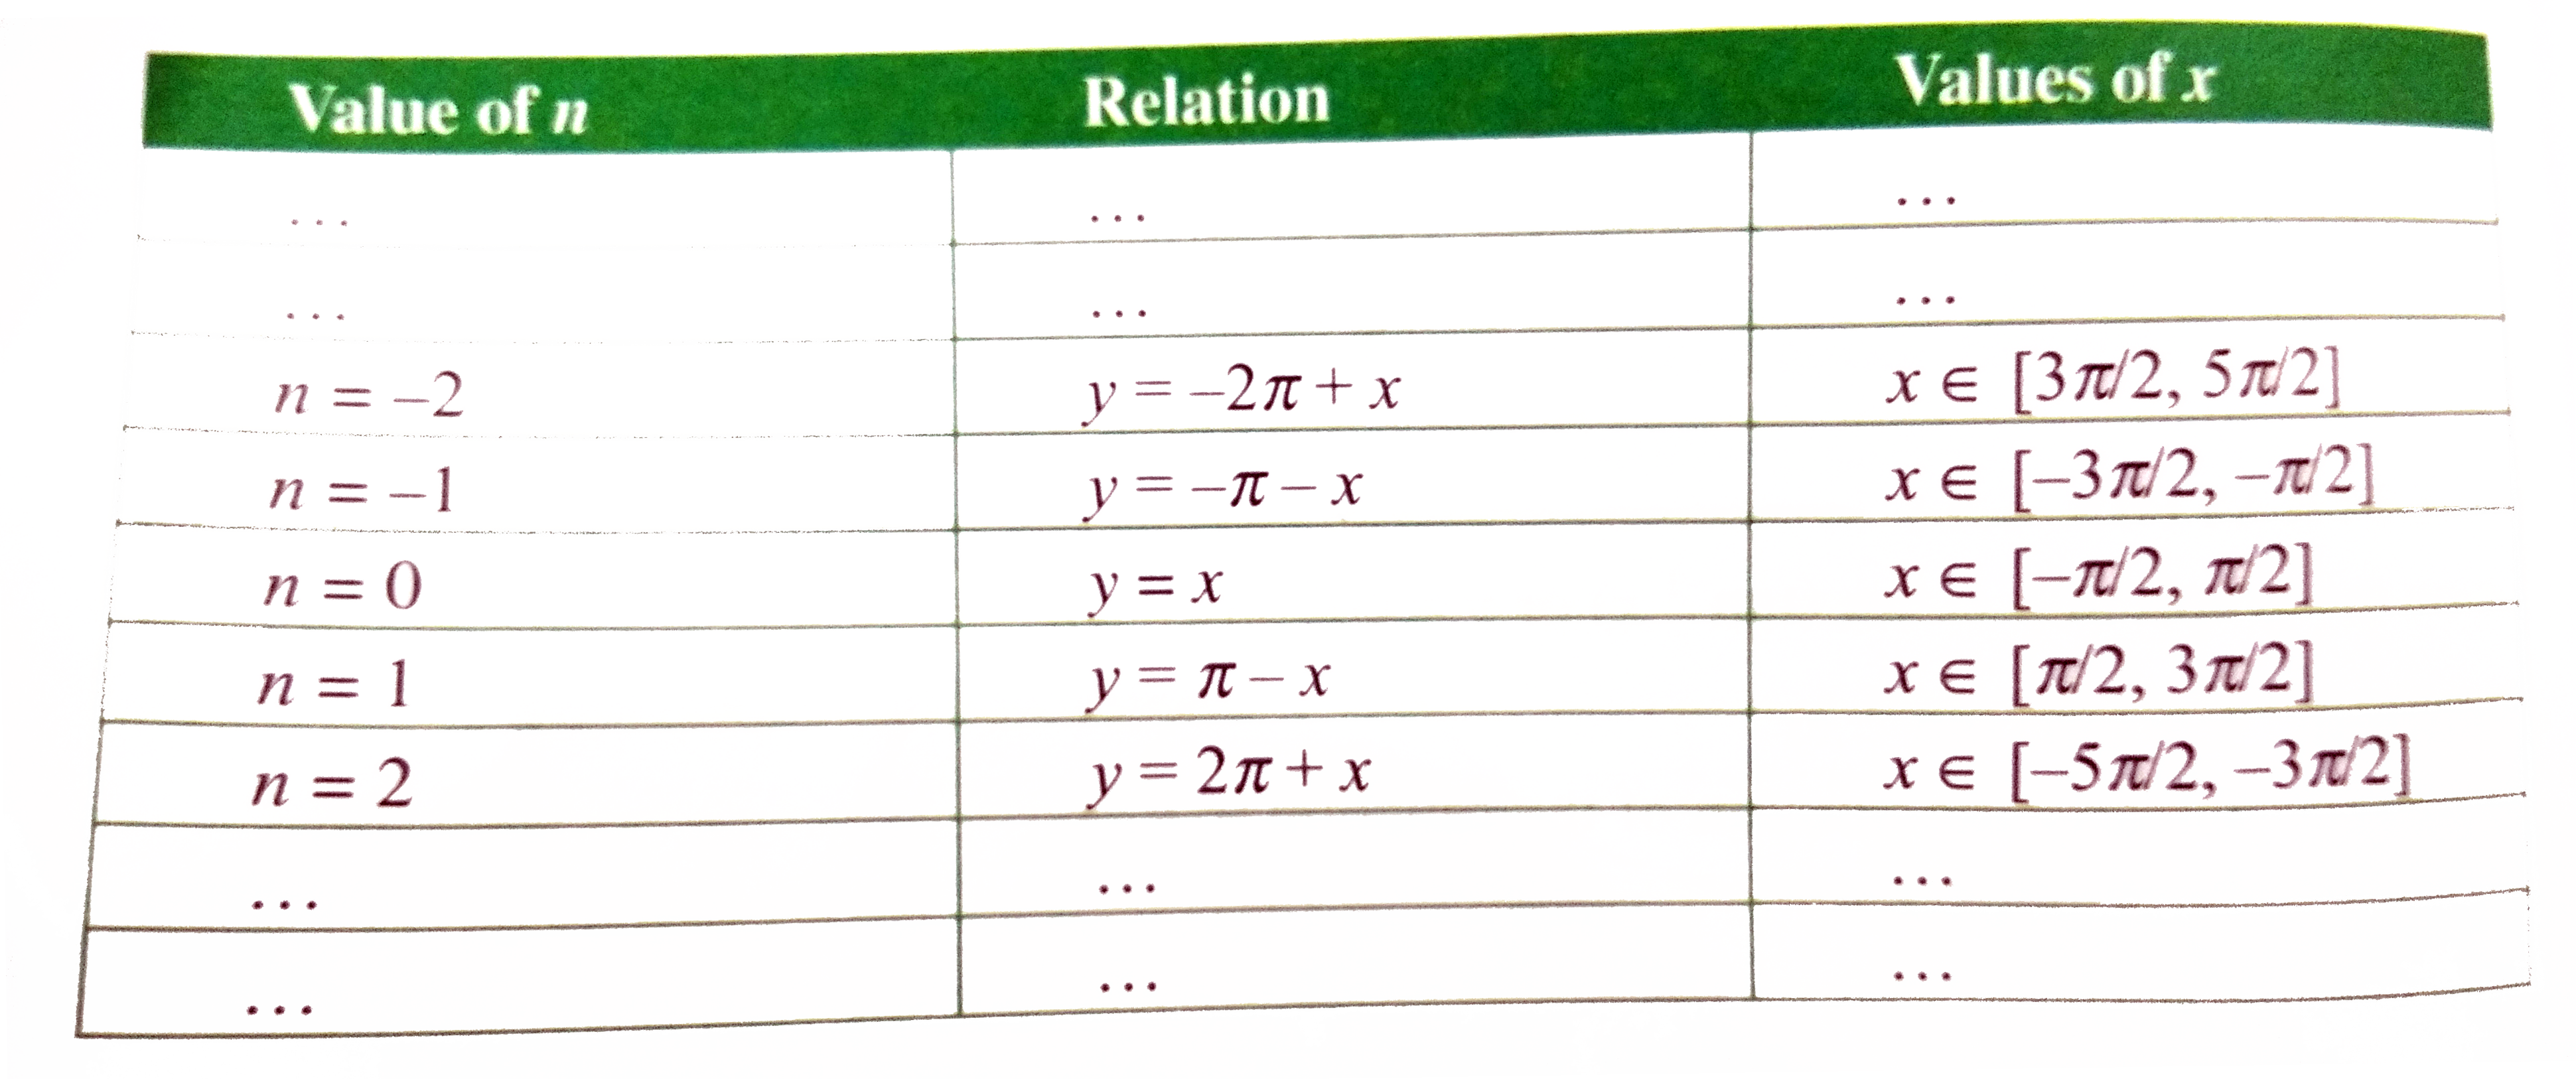
⇒ y=nπ+(−1)nx,n∈Z
Now y∈[−π/2,π/2] so we have the following table for values for values of x and y.

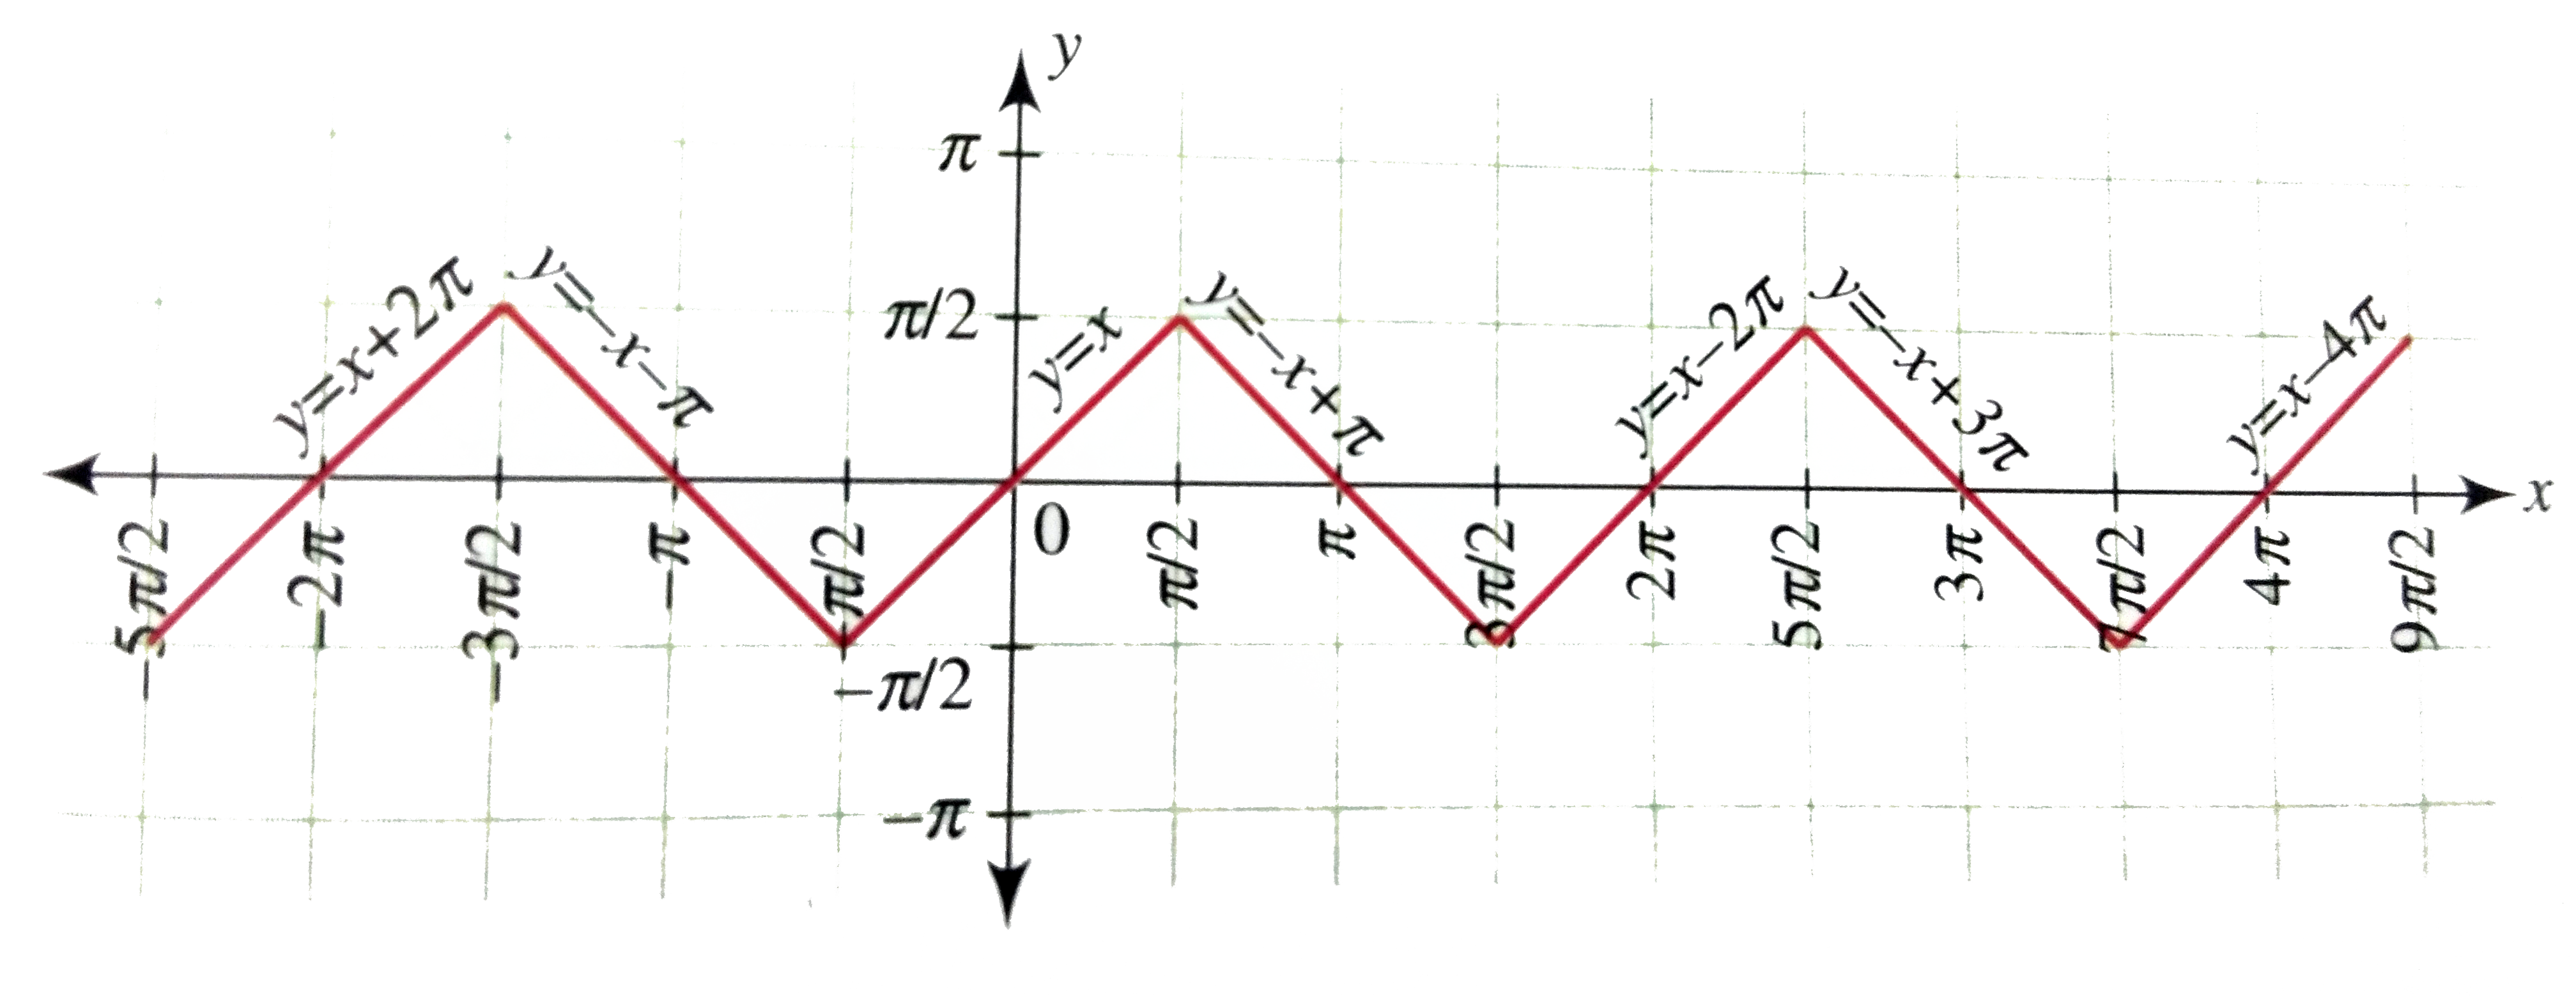
From the above informations, we can plot the graph of y=sin−1(sinx) as shown in the following figure.

|
Topper's Solved these Questions
- GRAPH OF INVERSE TRIGONOMETRIC FUNCTIONSBook:CENGAGEChapter:GRAPH OF INVERSE TRIGONOMETRIC FUNCTIONSExercise:Exercise
Explore 18 Videos
- GETTING STARTED WITH GRAPHSBook:CENGAGEChapter:GETTING STARTED WITH GRAPHSExercise:Exercise
Explore 18 Videos
- GRAPHICAL TRANSFORMATIONSBook:CENGAGEChapter:GRAPHICAL TRANSFORMATIONSExercise:Exercise
Explore 22 Videos
Similar Questions
Draw the graph of y=sin−1|sinx|andy=(sin−1|sinx|)2,0≤x≤2π
View SolutionDraw the graph of y=sin−1|sinx|andy=(sin−1|sinx|)2,0≤x≤2π
View SolutionDraw the graph of y=sin−1(cosx).
View SolutionDraw the graph of y=sin−1(cosx).
View SolutionDraw the graph of y=sin−1,1x
View SolutionDraw the graph of y=sin−1,1x
View SolutionDraw the graph of y=sin−1(x−3).
View SolutionDraw the graph of y=sin−1(x2)
View SolutionDraw the graph of y=sin−1(x−3).
View SolutionDraw the graph of y=sin−1(x2)
View Solution
