A closed vessel of known volume containing known amount of ideal gaseous substance 'A' was observed for variation of pressure with temperature . The expected graph was to be like as in (i) However actual observations reveal the graph to be like (ii). The deviation was attributed to polymerisation of gas molecules as nA(g)⇔AB(g). If it is known that the above reaction given only 50% yield
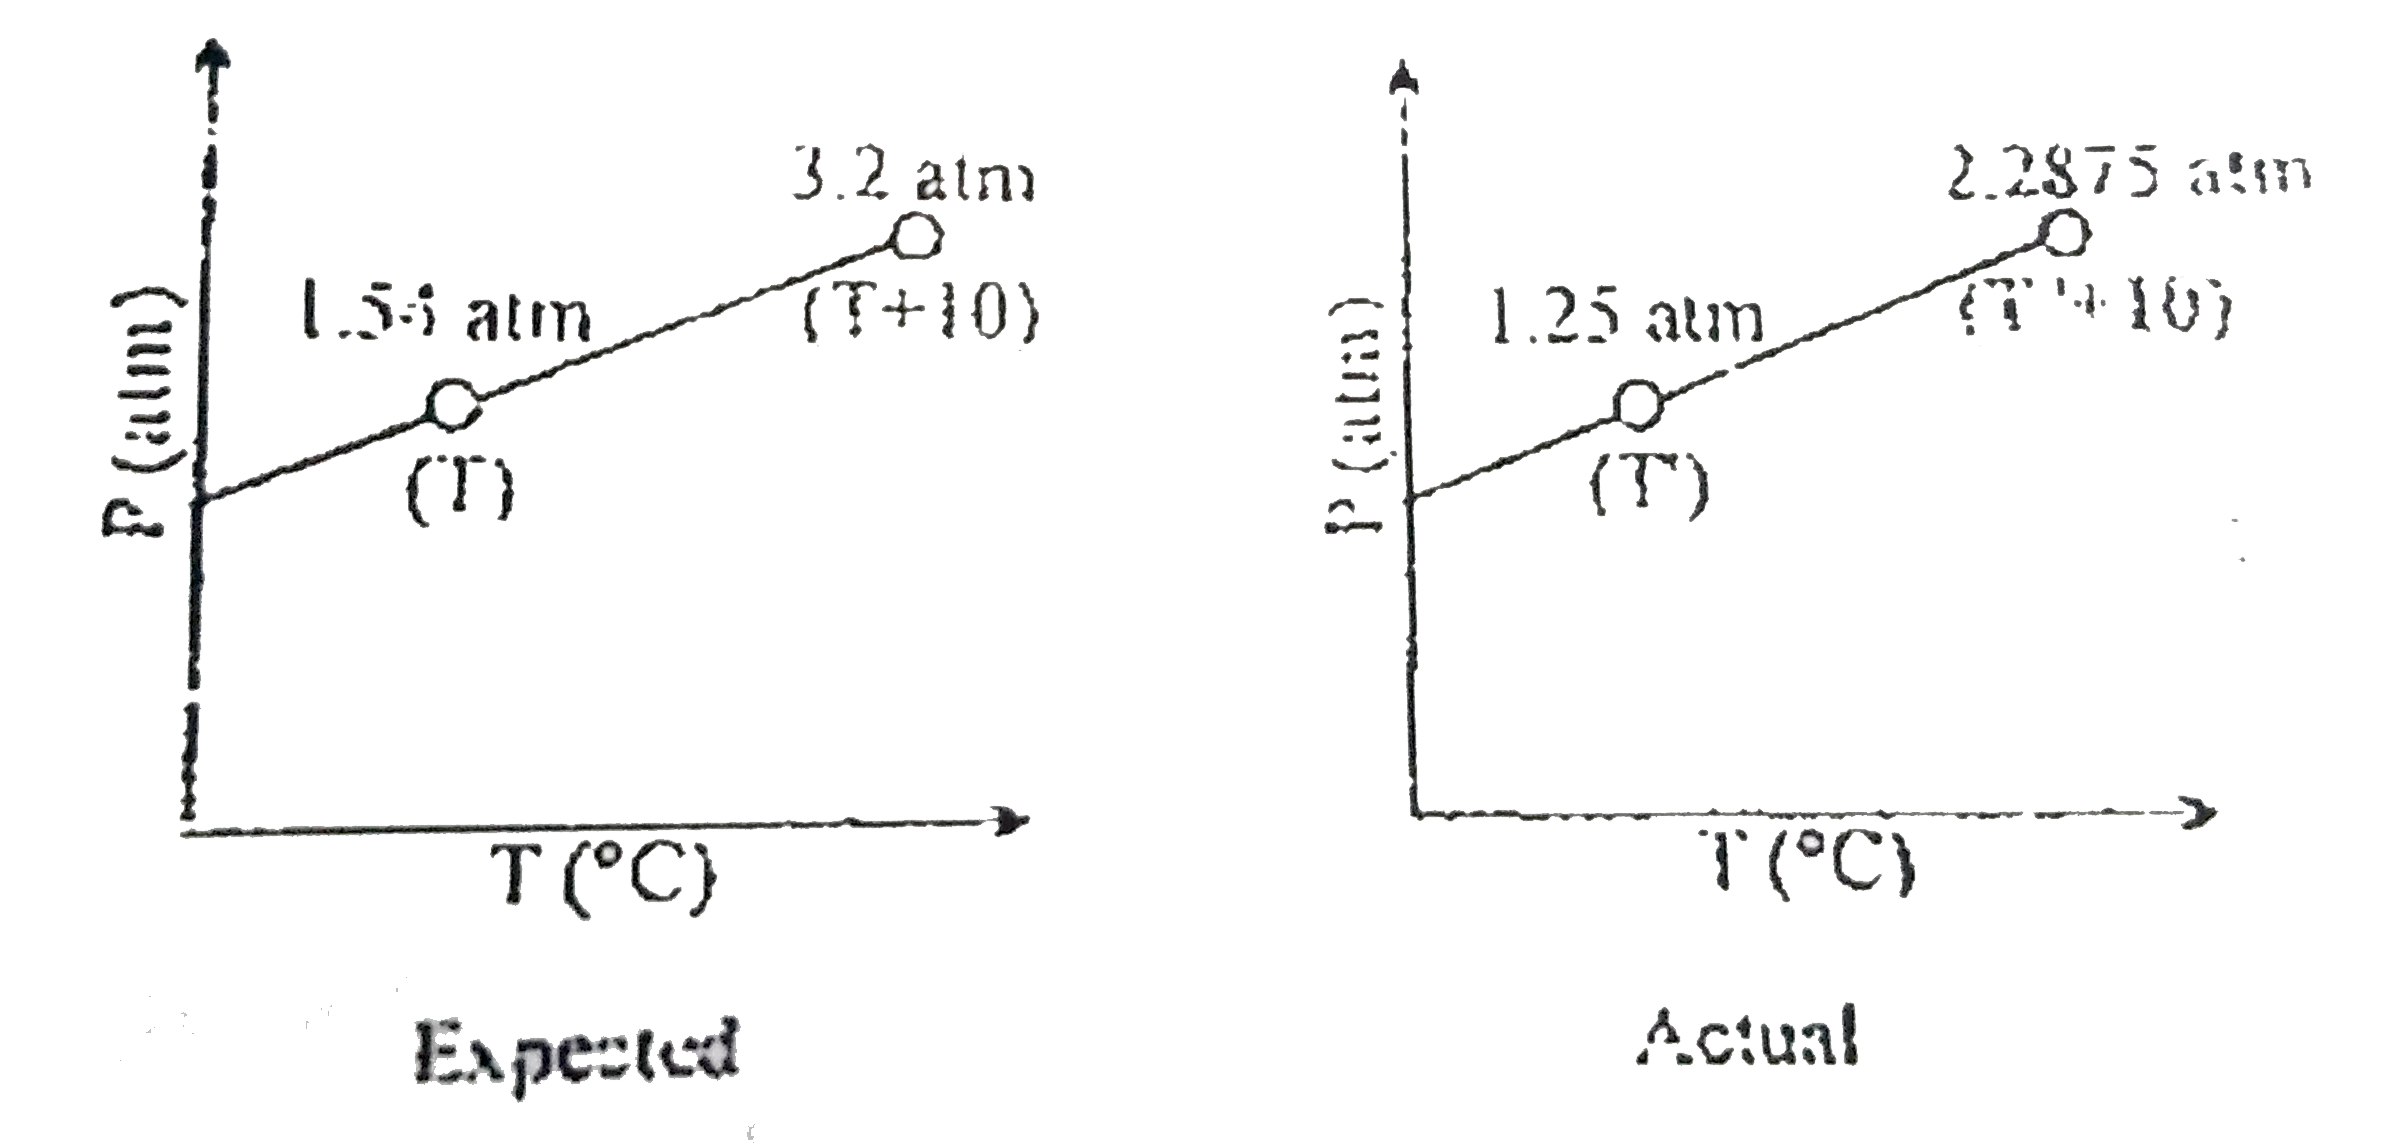
Find the value of n to which the gas A is being polymerised into
nA⇒AnV= constant
t=teq moles a0−a0αa0αn ideal gases:-
PV-nRT
P=nRV(t∘+273)
PVst(.∘C)y=mx+C where m=nRV
mactualmtheoriticl=nactualntheortical=a0a0α+a0αna0=1.03751.66=11.6
0.5×1.6n=0.2
n=4
Topper's Solved these Questions
- TEST PAPERSBOOK - BANSALCHAPTER - TEST PAPERSEXERCISE - CHEMISTRY PART (A)
14 Videos
- TEST PAPERSBOOK - BANSALCHAPTER - TEST PAPERSEXERCISE - CHEMISTRY PART (B)
1 Videos
- TEST PAPERSBOOK - BANSALCHAPTER - TEST PAPERSEXERCISE - Chemistry PART D
4 Videos
- SOLUTIONSBOOK - BANSALCHAPTER - SOLUTIONSEXERCISE - Exercise4
32 Videos
- THERMOCHEMISTRYBOOK - BANSALCHAPTER - THERMOCHEMISTRYEXERCISE - Exercise 4
15 Videos
Similar Questions
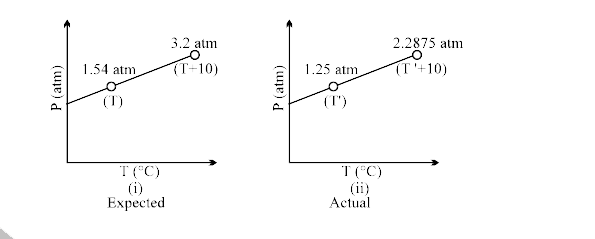
A closed vessel of known volume containing known amount of ideal gaseous substance 'A'was observed for variation of pressure with temperature .The expected graph was to be like as in
( i) However actual observations revealed the graph to be like.
(ii) The deviation was attributed to polymerisation of gas molecules as nA(g) 1 An(g).If it is known that the above reactiongives only 50% yield.
(a) Calculate the ratio of nexperimentntheoritical ( where nexp.= Total no. of gaseous mole actually present ntheoretical=Total no. of mole origianl taken )
( b) Find the value of n to which the gas A is being polymerised into
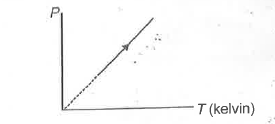
View SolutionThe graph of pressure and temperature for an ideal gas is as shown in figure. The given process is
View Solution
Knowledge Check
Variation of heat of reaction with temperature is known as
AVant Hoff's isothermBVant Hoff's isochoreCKirchoff's equationDKemmerling equationIf heat energy is given to an ideal gas at constant pressure, then select the graph which best represents the variation of VT with temperature (T).
A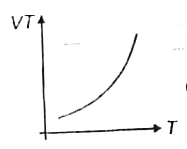 B
B C
C D
D
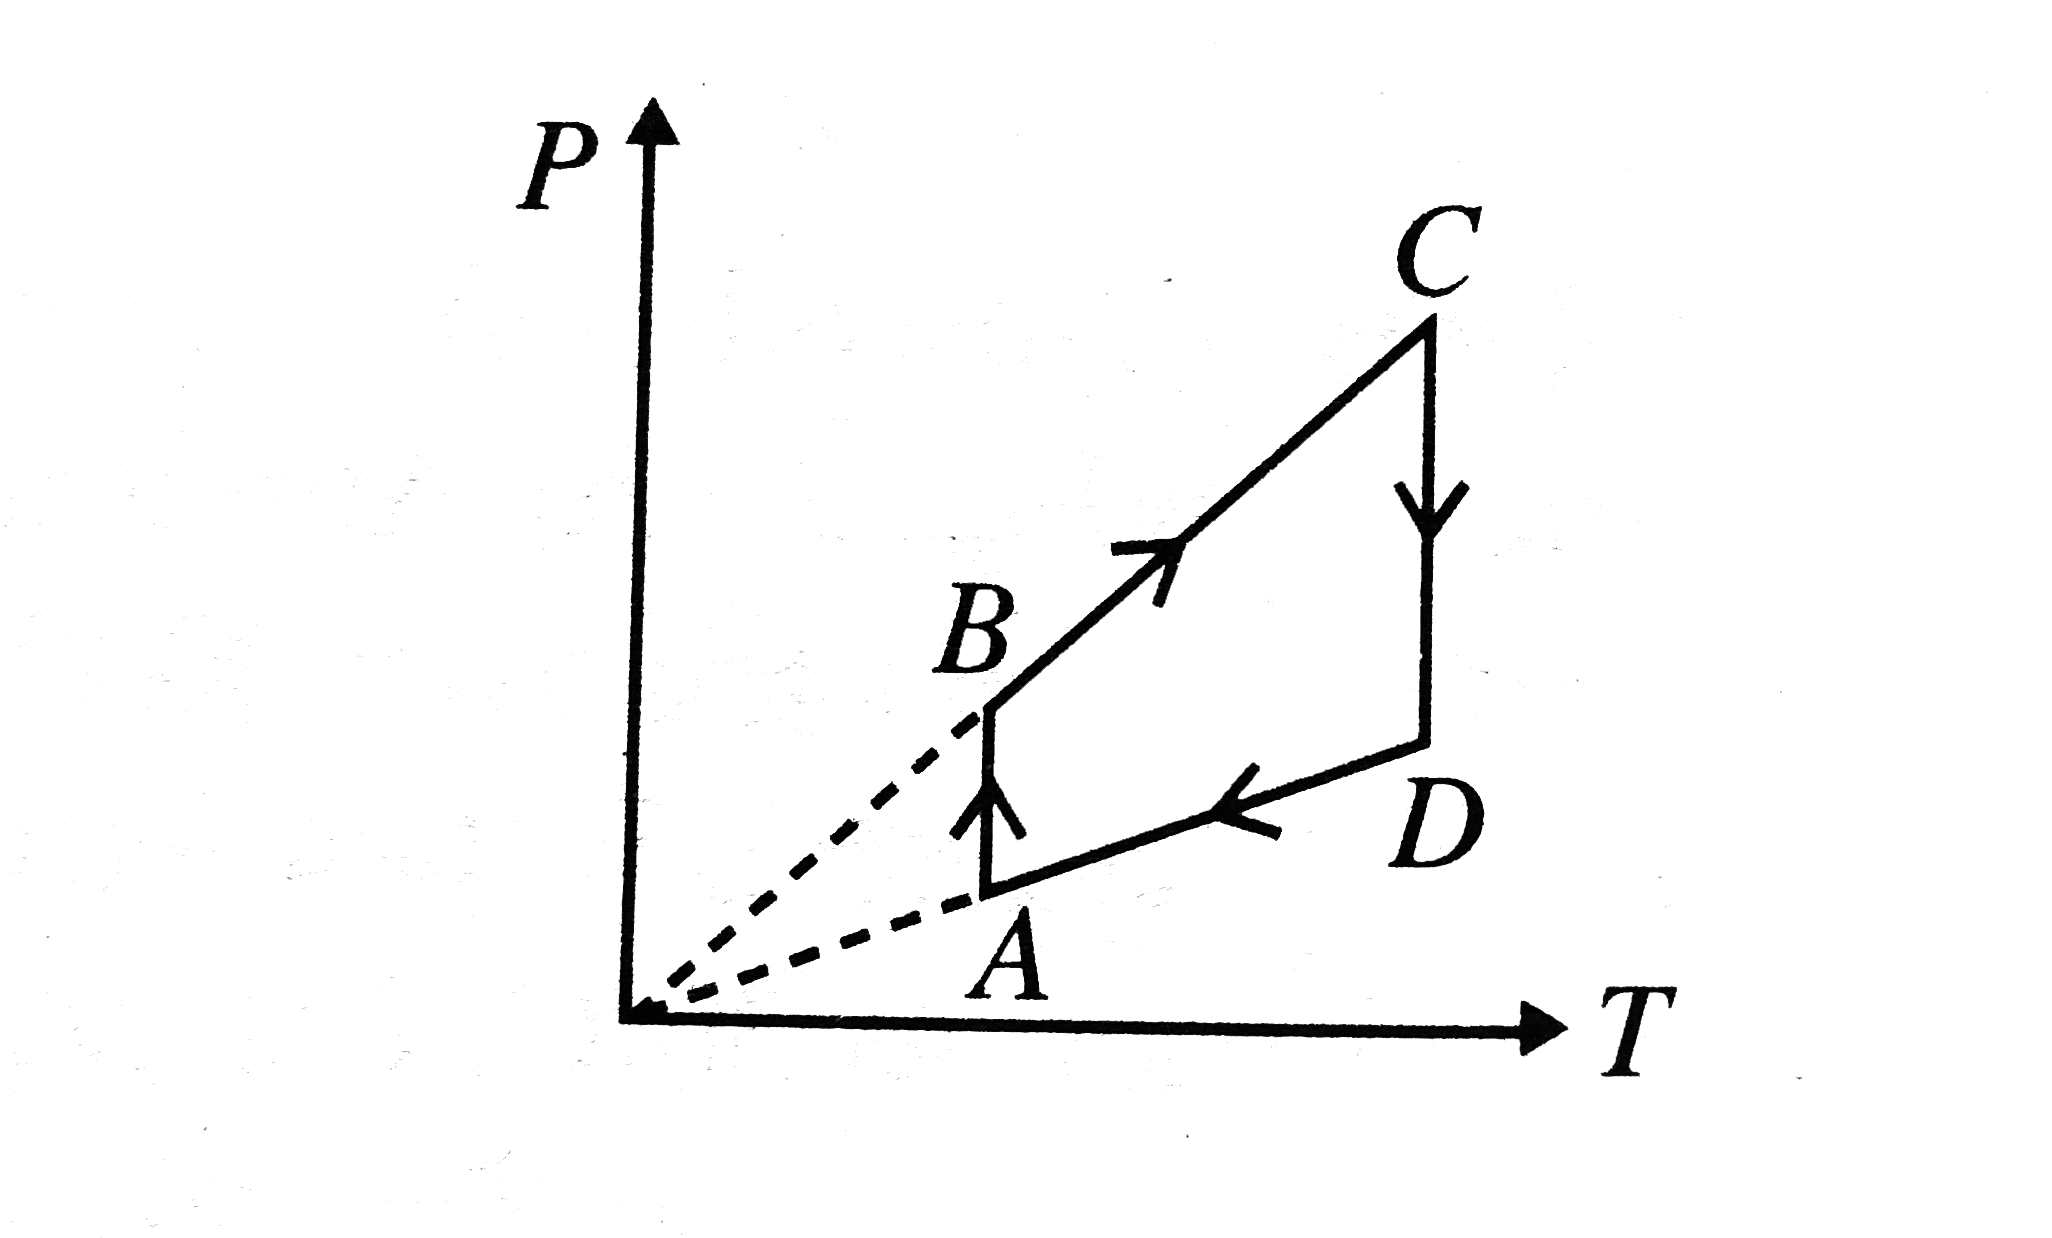
Pressure versus temperature graph of an ideal gas as shown in Fig.
Corresponding density (ρ) versus volume (V) graph will be
 A
A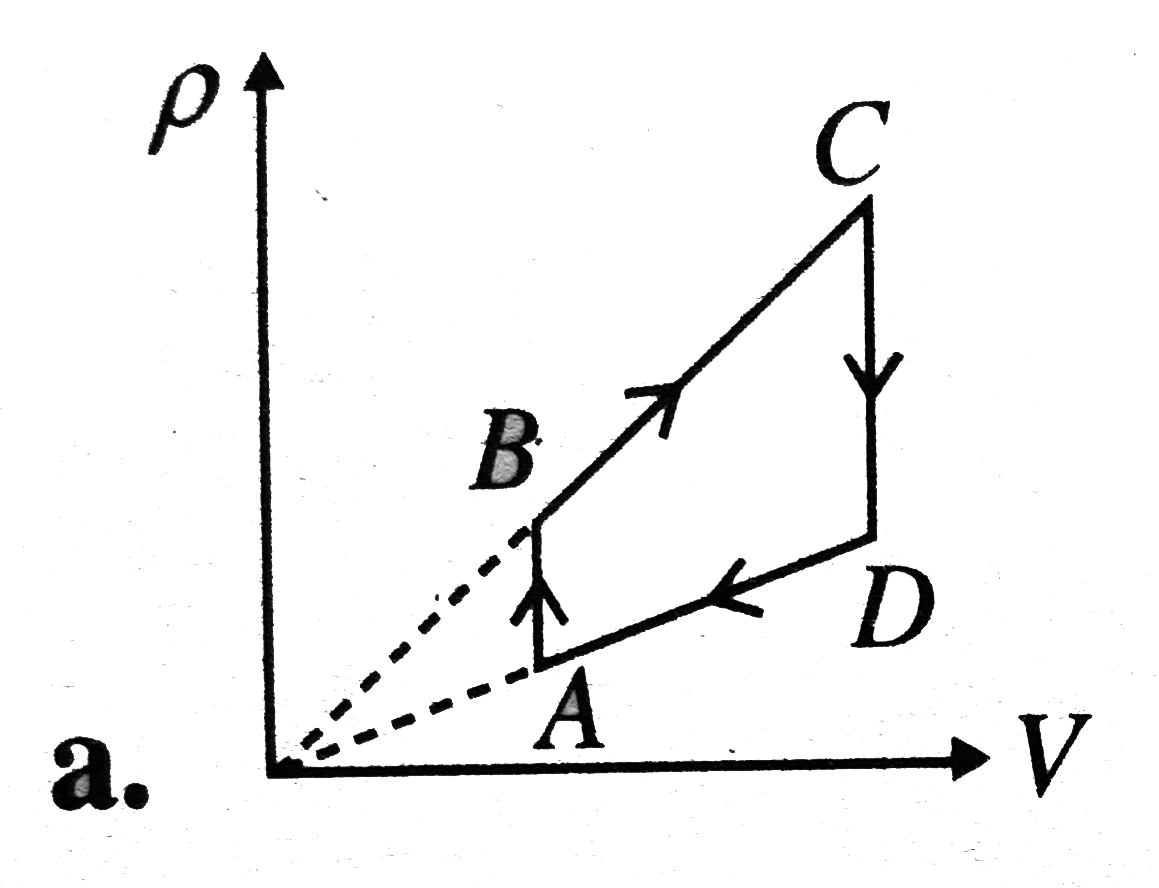 B
B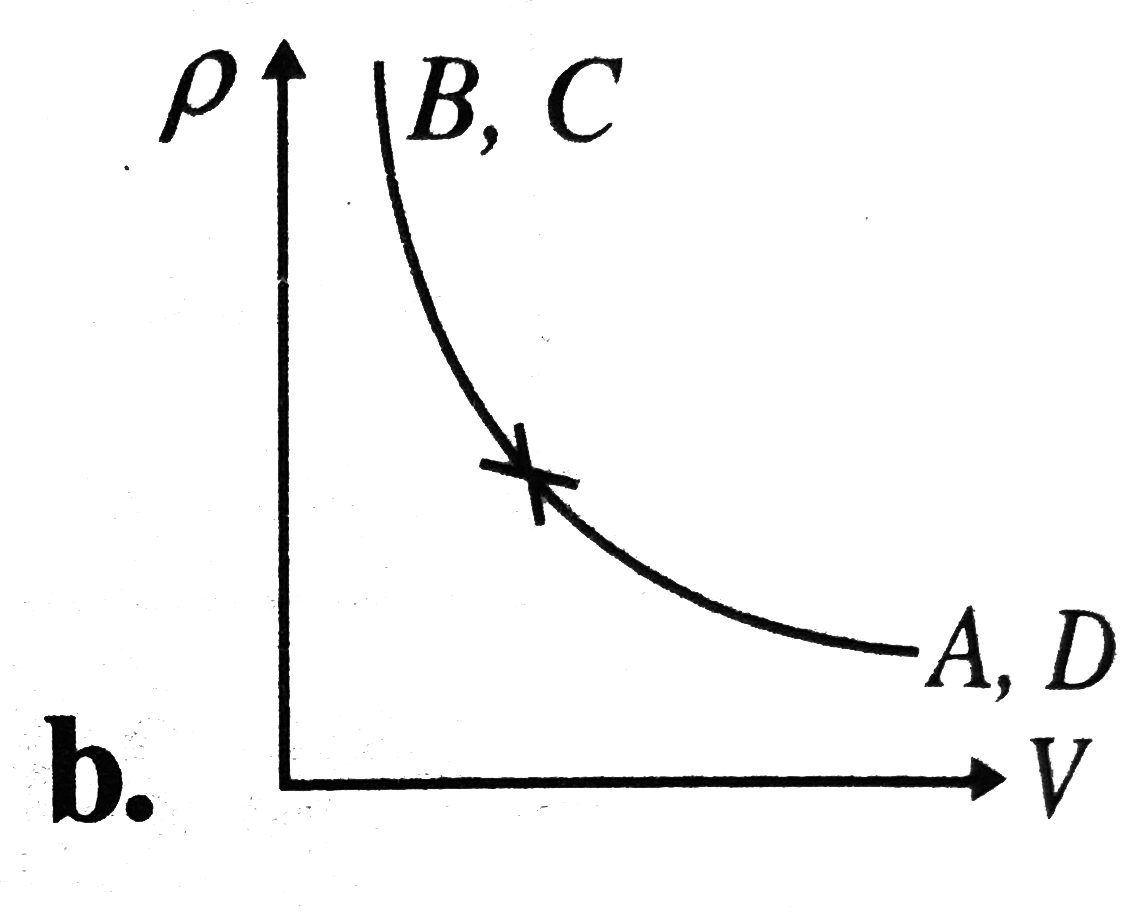 C
C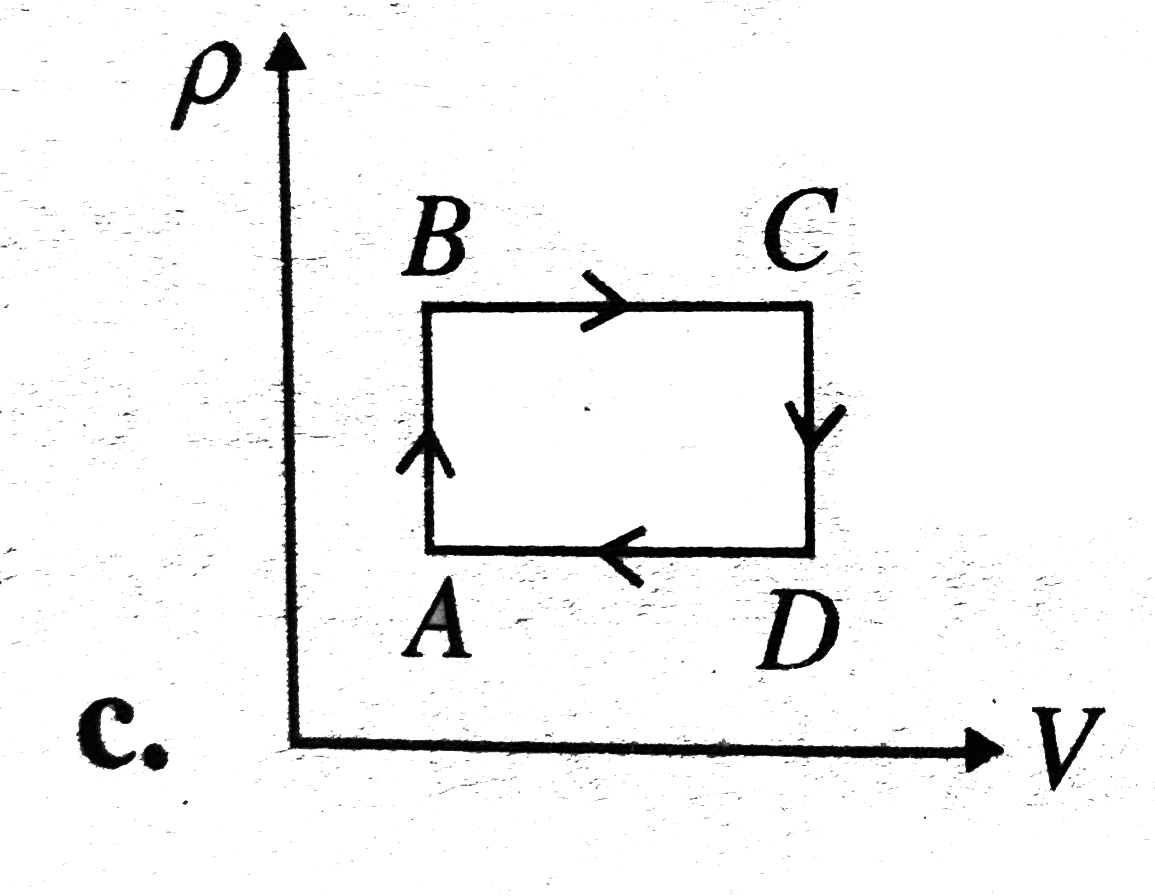 D
D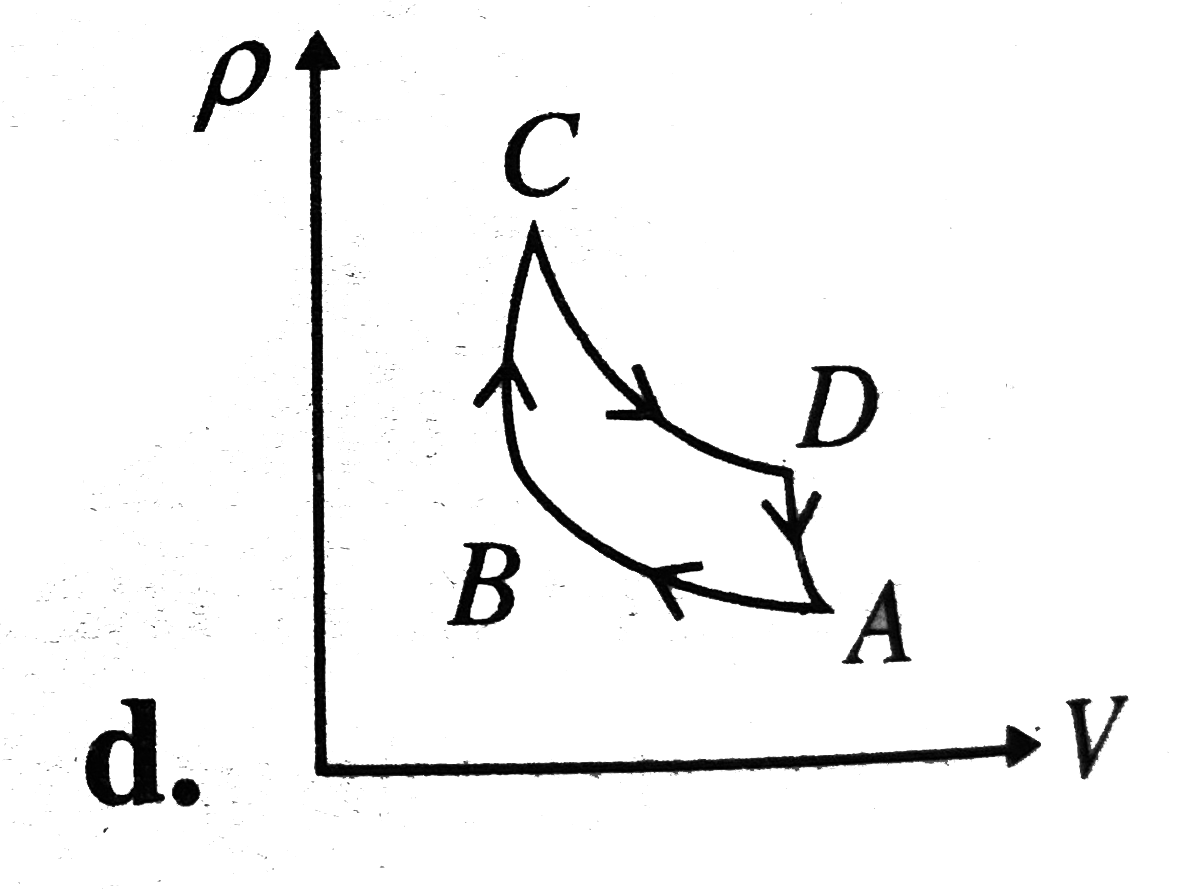
If heat energy is given to an ideal gas at constant pressure, then select the graph which best represents the variation of VT with temperature (T).
View SolutionPressure versus temperature graph of an ideal gas as shown in Fig.
Corresponding density (ρ) versus volume (V) graph will be

View SolutionPressure versus temperature graph of an ideal gas as shown in Fig.
Corresponding density (ρ) versus volume (V) graph will be

View SolutionA closed vessel contains some gas at a given temperature and pressure. If the vessel is given a very high velocity, then the temperature of the gas
View SolutionVariation observed during tissue culture of some plants are known as
View Solution
