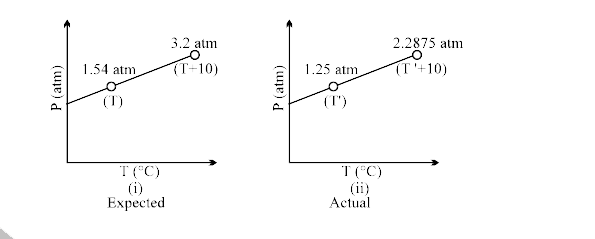
A closed vessel of known volume containing known amount of ideal gaseous substance 'A'was observed for variation of pressure with temperature .The expected graph was to be like as in
( i) However actual observations revealed the graph to be like.
(ii) The deviation was attributed to polymerisation of gas molecules as nA(g) 1 .If it is known that the above reactiongives only 50% yield.
(a) Calculate the ratio of ( where = Total no. of gaseous mole actually present Total no. of mole origianl taken )
( b) Find the value of n to which the gas A is being polymerised into
The correct Answer is:(a) 0.625 (b) 4
Topper's Solved these Questions
- GASEOUS STATE BOOK - MOTIONCHAPTER - GASEOUS STATE EXERCISE - EXERCISE-4( LEVEL-I)
15 Videos
- GASEOUS STATE BOOK - MOTIONCHAPTER - GASEOUS STATE EXERCISE - EXERCISE-4( LEVEL-II)
19 Videos
- GASEOUS STATE BOOK - MOTIONCHAPTER - GASEOUS STATE EXERCISE - EXERCISE-2(LEVEL-II)
35 Videos
- ELECTROCHEMISTRYBOOK - MOTIONCHAPTER - ELECTROCHEMISTRYEXERCISE - EXERCISE-4,II
44 Videos
- GOCBOOK - MOTIONCHAPTER - GOCEXERCISE - Exercise - 4 Level - II
14 Videos
Similar Questions
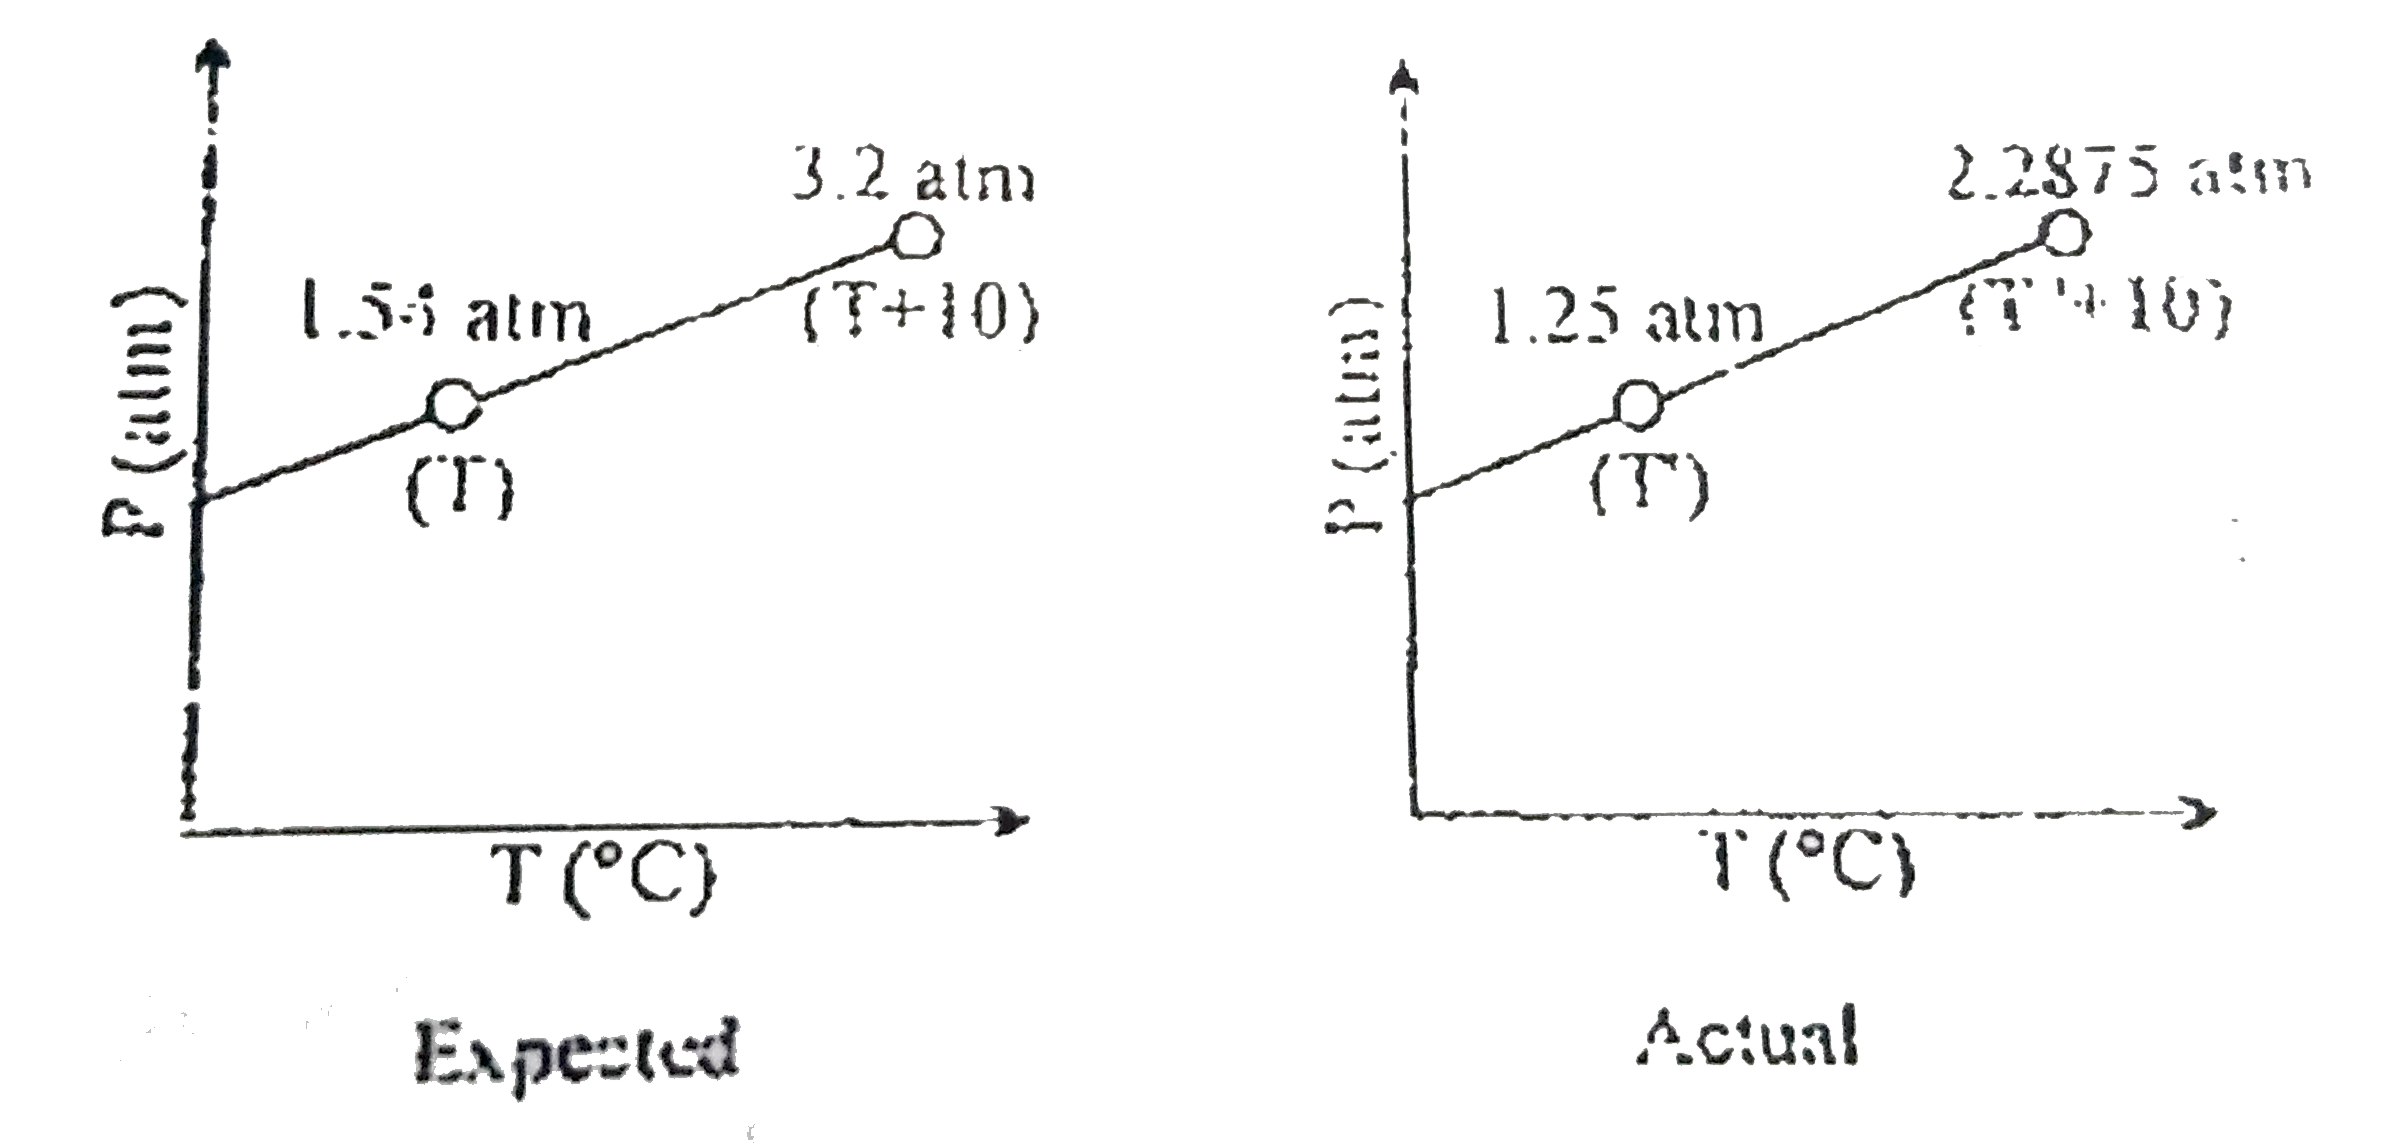
A closed vessel of known volume containing known amount of ideal gaseous substance 'A' was observed for variation of pressure with temperature . The expected graph was to be like as in (i) However actual observations reveal the graph to be like (ii). The deviation was attributed to polymerisation of gas molecules as nA(g)⇔AB(g). If it is known that the above reaction given only 50% yield
Find the value of n to which the gas A is being polymerised into
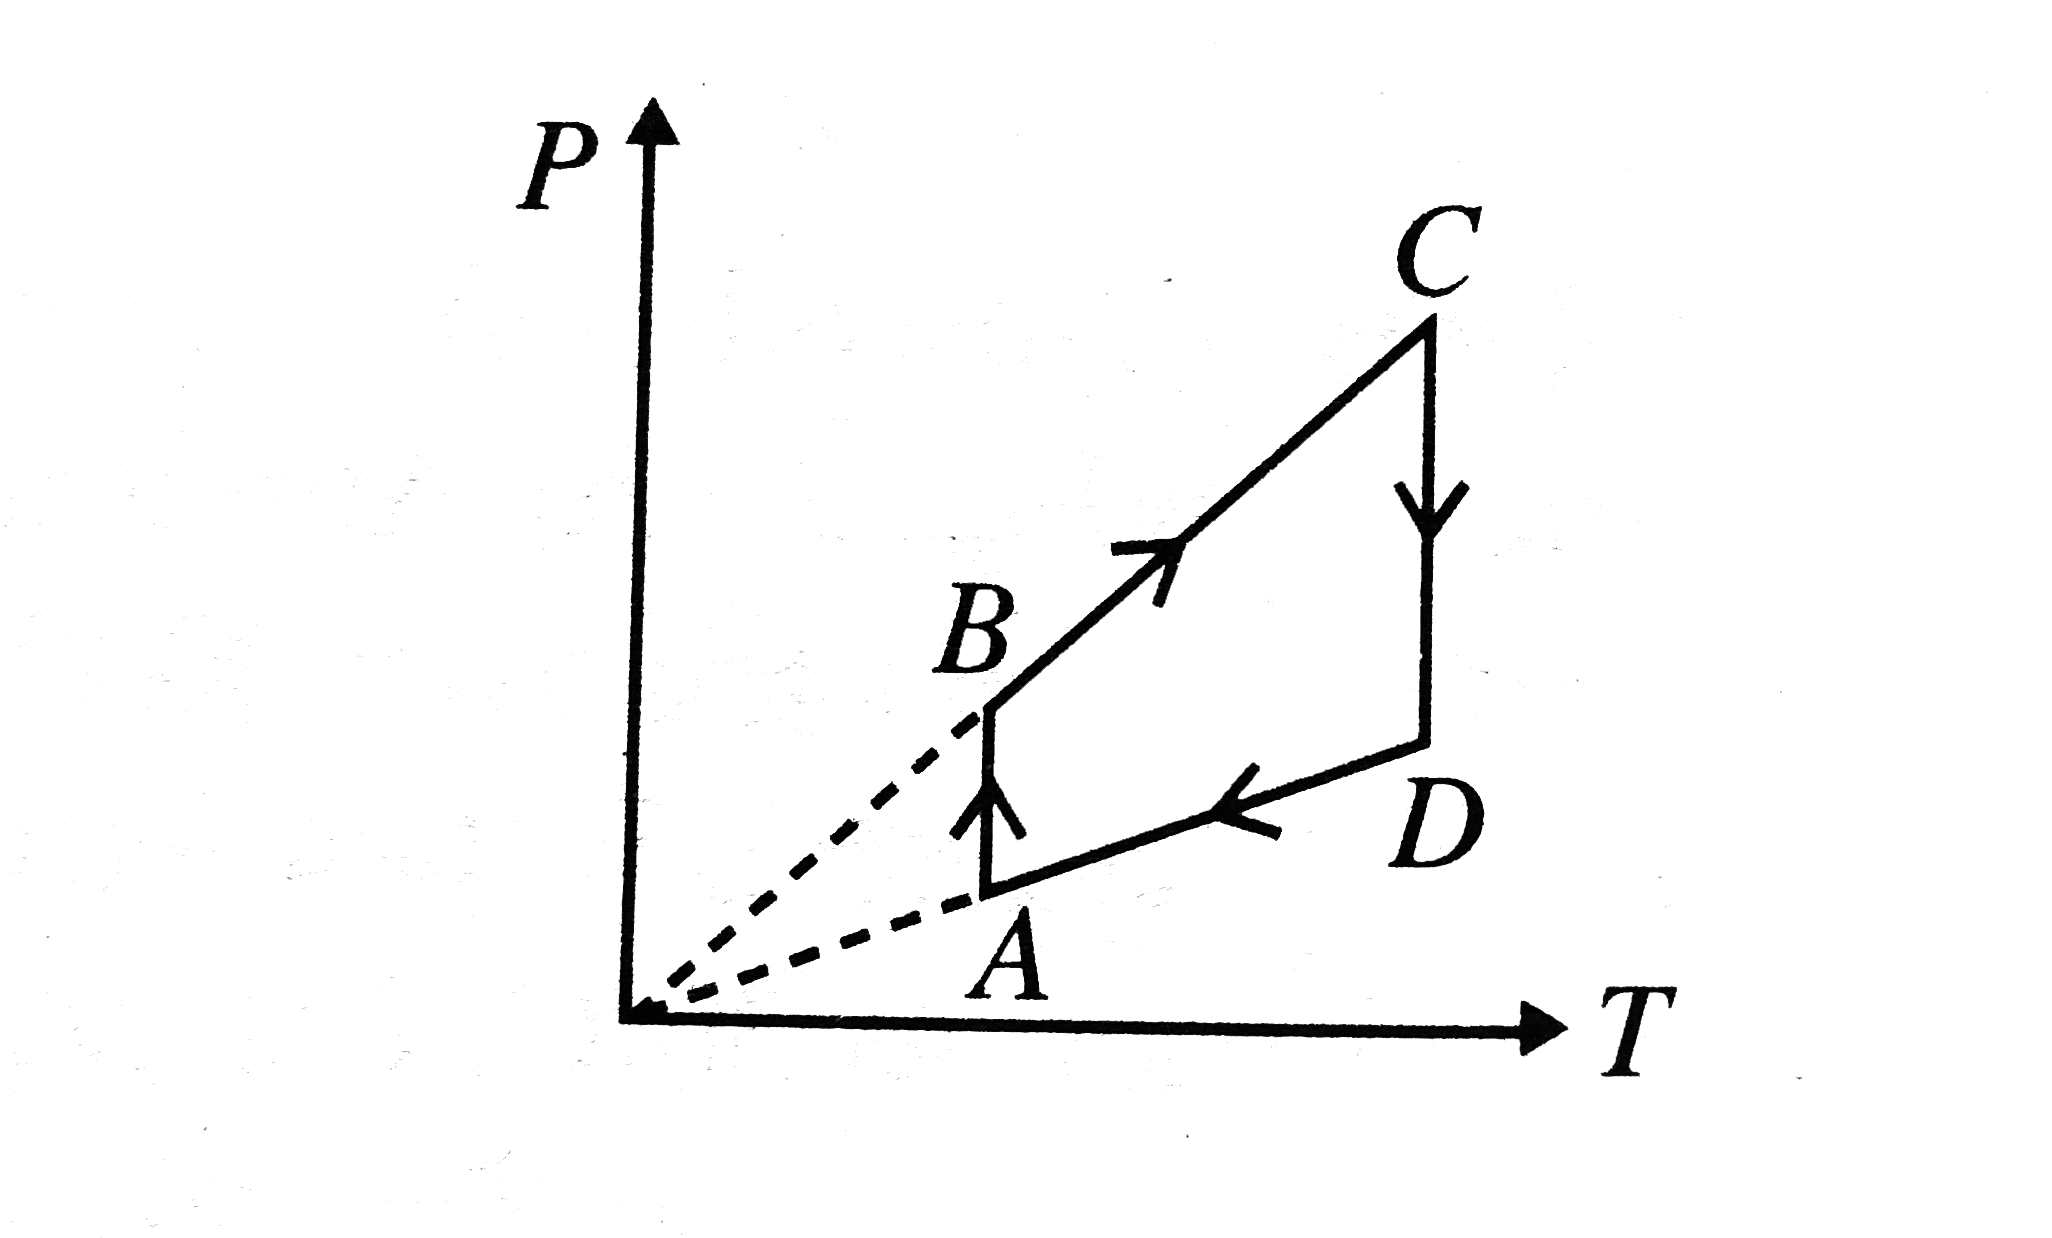
View SolutionPressure versus temperature graph of an ideal gas as shown in Fig.
Corresponding density (ρ) versus volume (V) graph will be
View Solution
Knowledge Check
Variation of heat of reaction with temperature is known as
AVant Hoff's isothermBVant Hoff's isochoreCKirchoff's equationDKemmerling equationPressure versus temperature graph of an ideal gas as shown in Fig.
Corresponding density (ρ) versus volume (V) graph will be
 A
A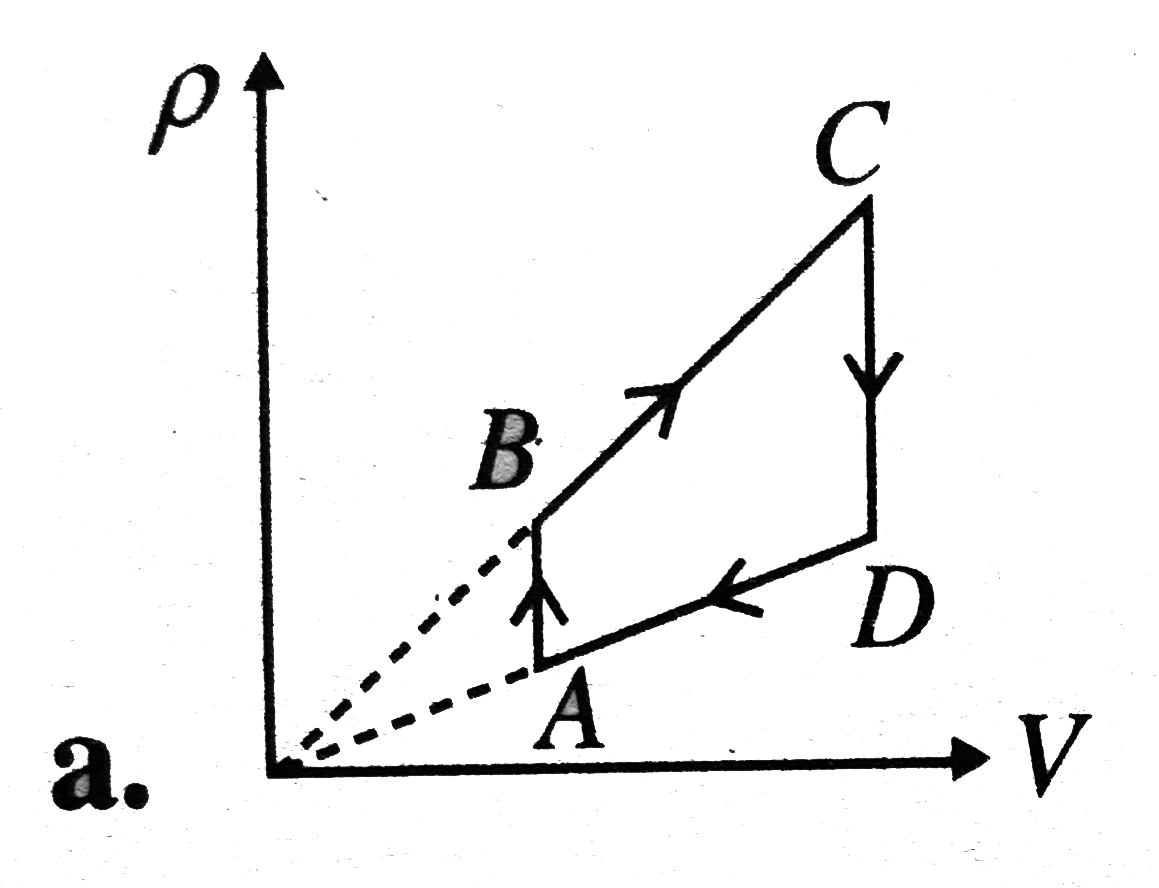 B
B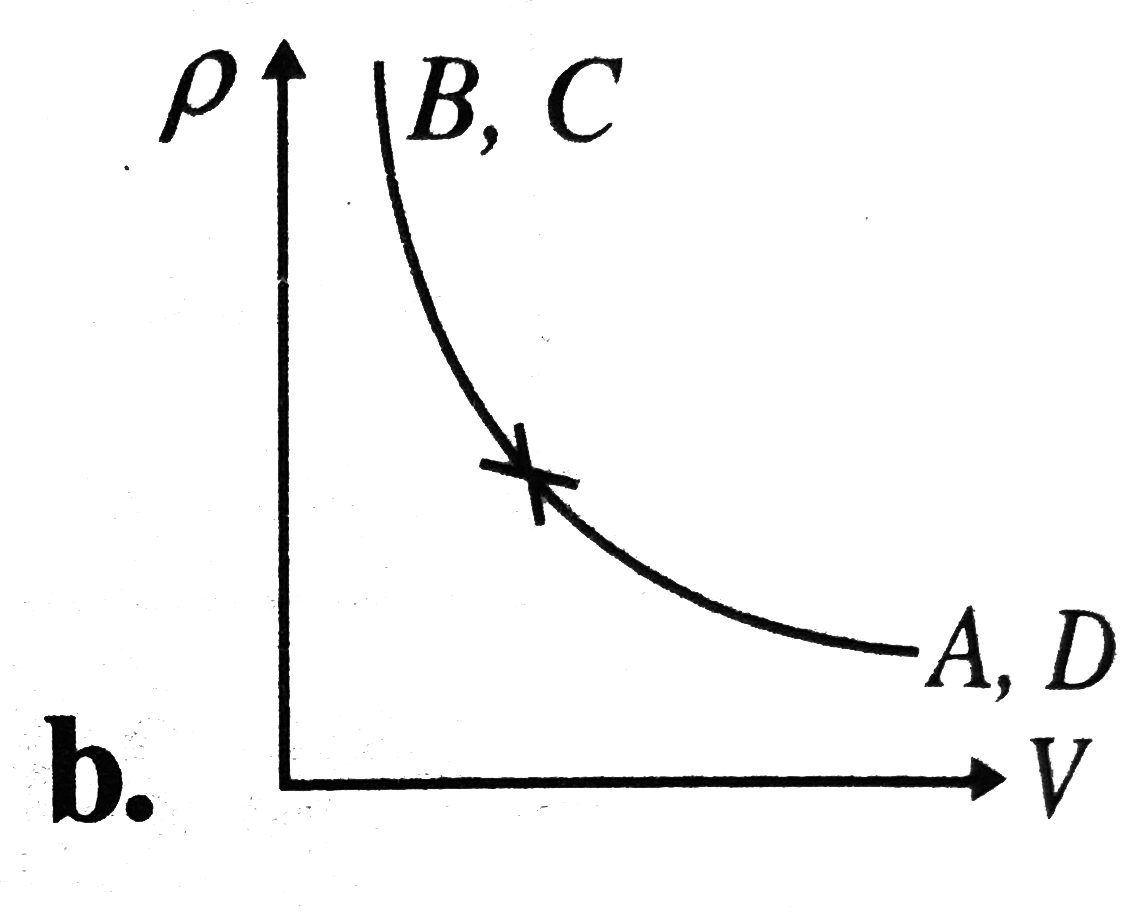 C
C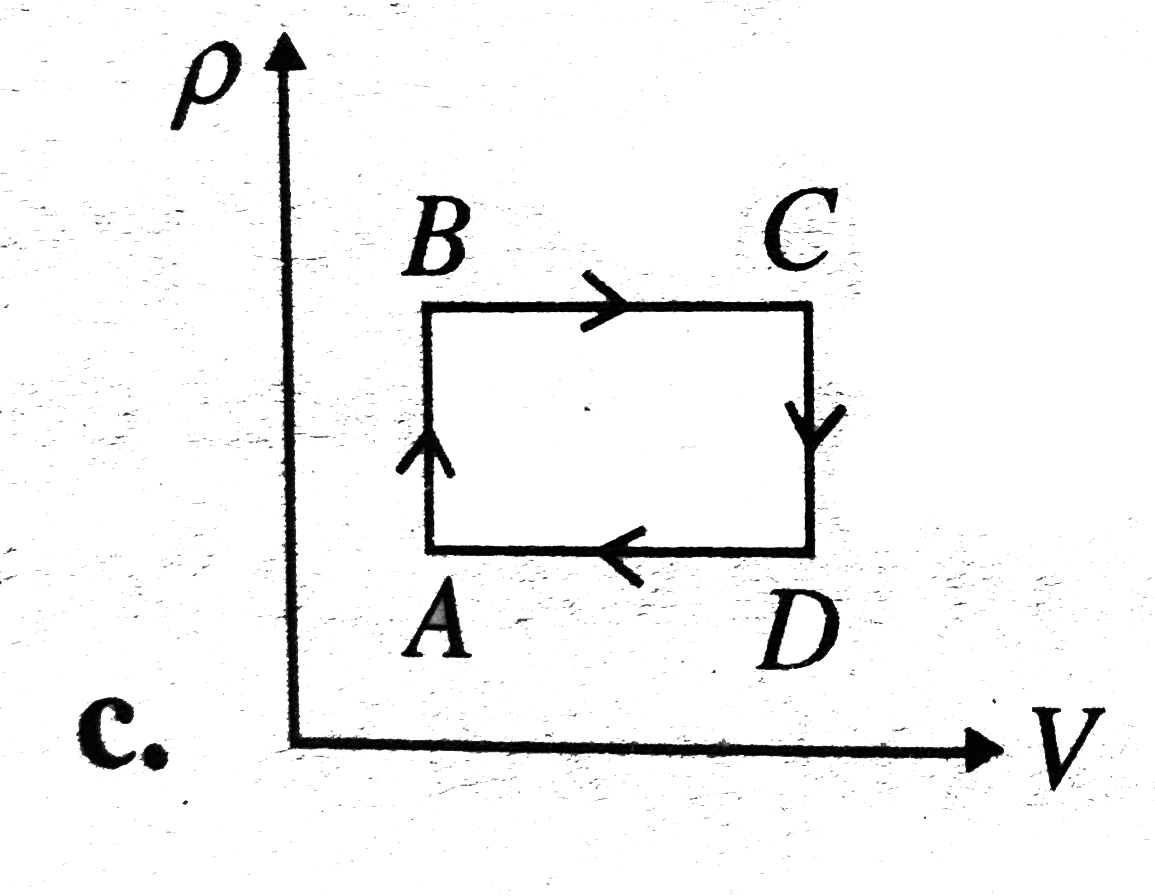 D
D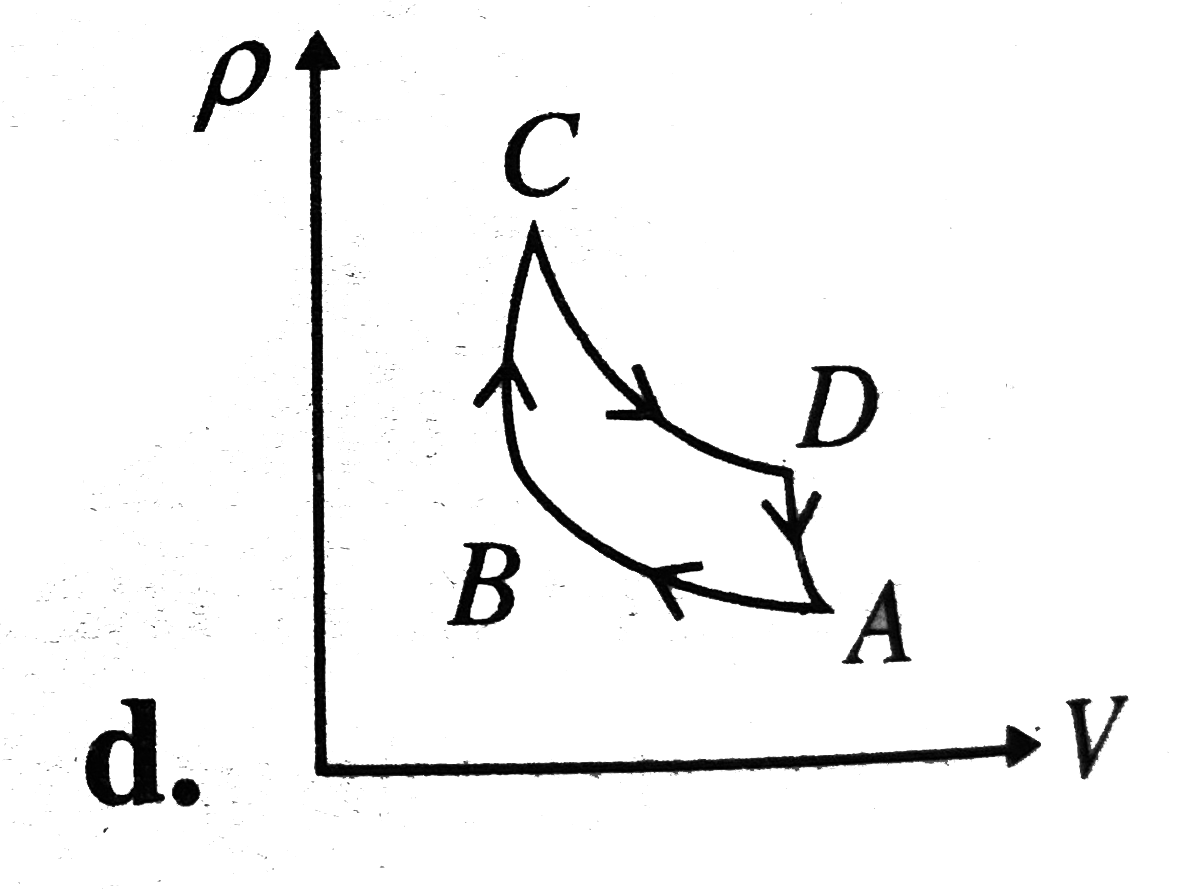
If heat energy is given to an ideal gas at constant pressure, then select the graph which best represents the variation of VT with temperature (T).
A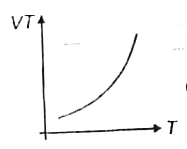 B
B C
C D
D
Pressure versus temperature graph of an ideal gas as shown in Fig.
Corresponding density (ρ) versus volume (V) graph will be

View SolutionIf heat energy is given to an ideal gas at constant pressure, then select the graph which best represents the variation of VT with temperature (T).
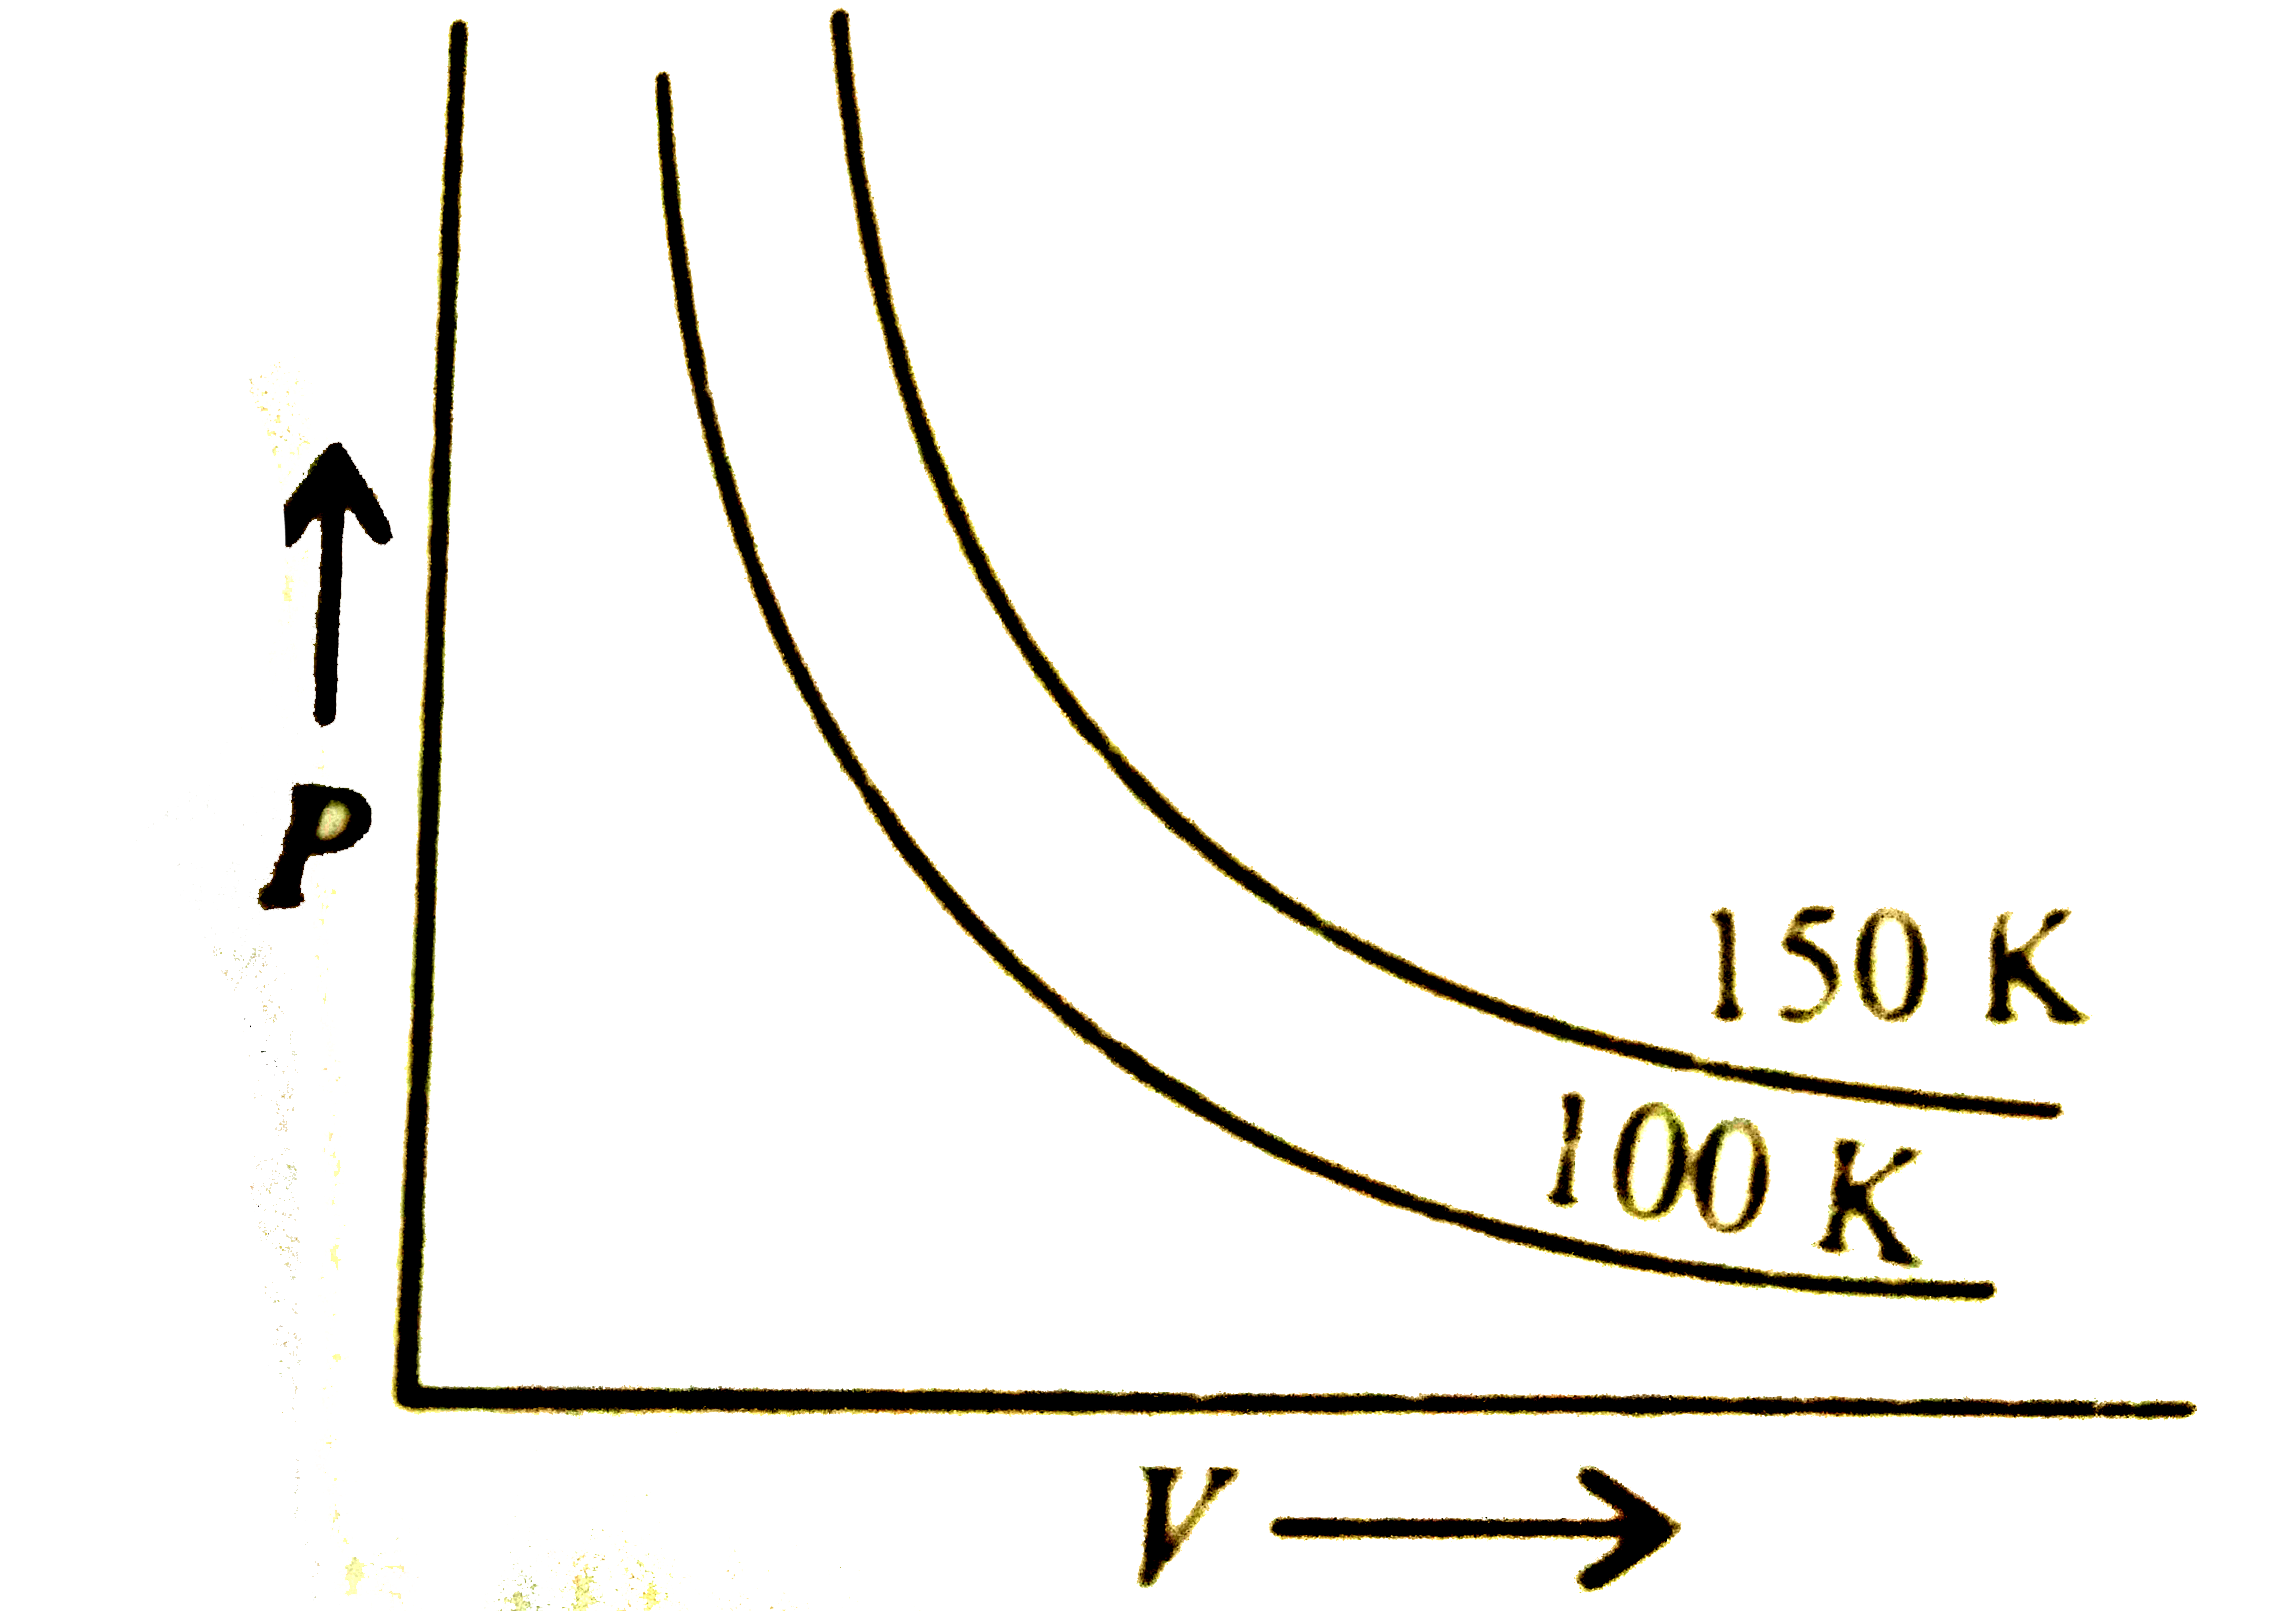
View SolutionA graph is plotted between pressure and volume at different temperatures . On the basis of the graph what changes will you observe in the volume if
(i) the pressure is increased at constant temperature .
(ii) the temperature is decreased at constant pressure .
View SolutionThe proposition equal volumes of different gases contain equal numbers of molecules at the same temperature and pressure is known as
View SolutionAt a constant pressure, of the following graphs that one which represents the variation of the density of an ideal gas with the absolute temperature T, is
View Solution
