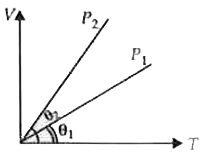
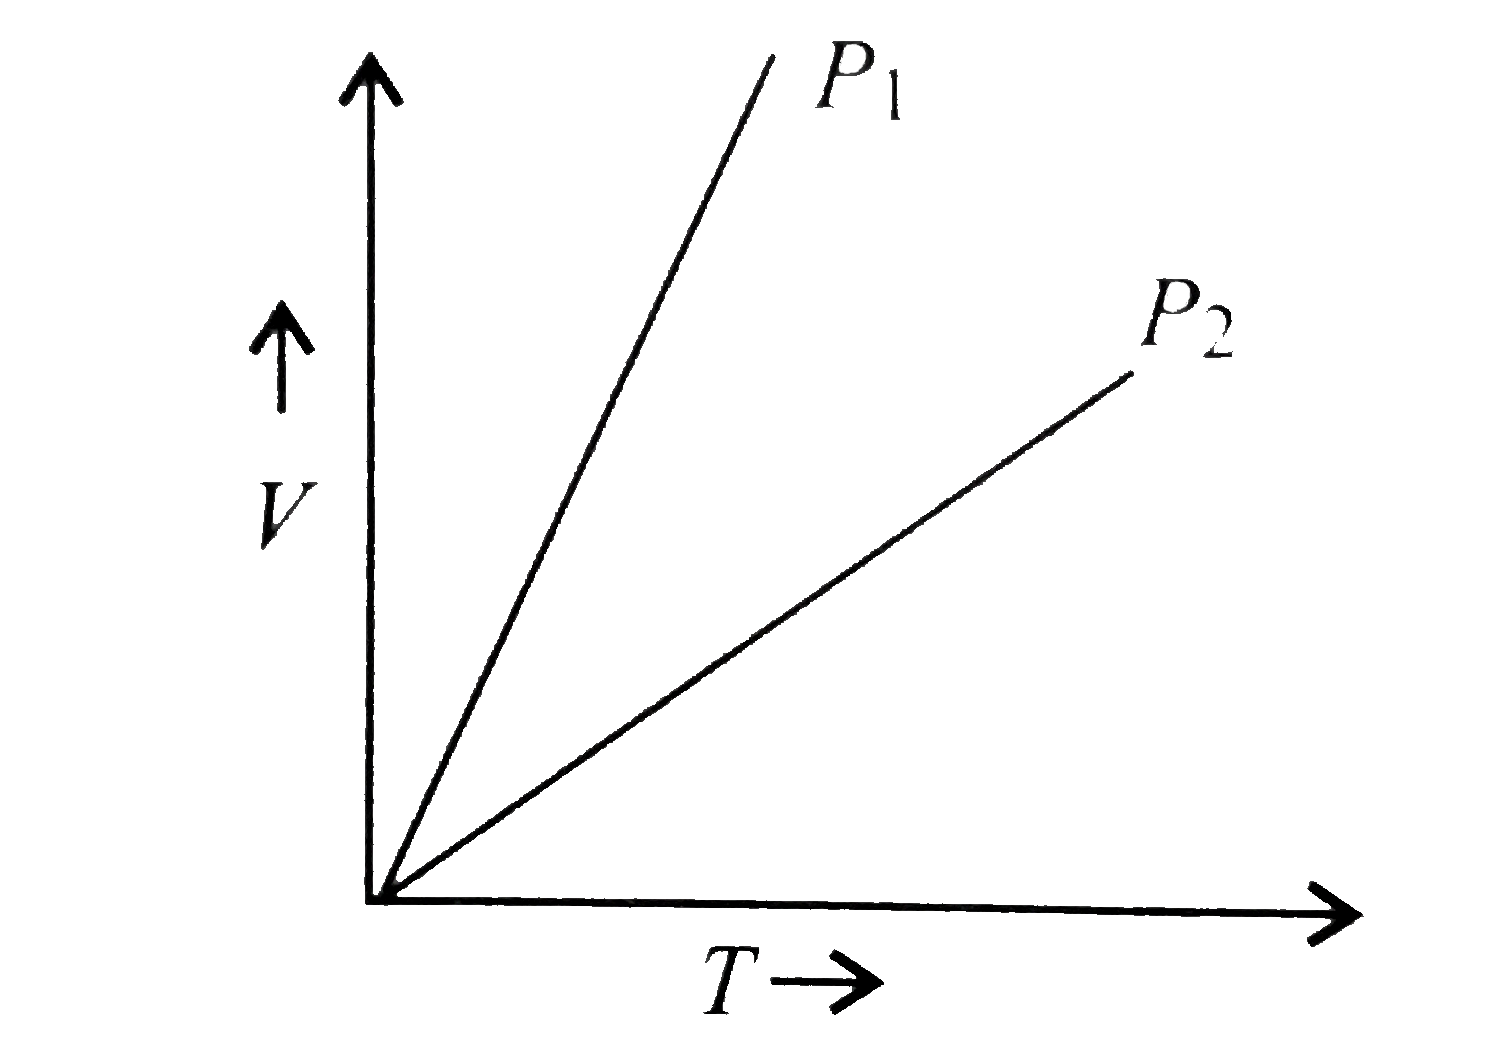
In the V - T diagram (fig.), two different points show pressures p1andp2. Which pressure would be higher- p1orp2?

Text Solution
The V-T graph is a straight line.
Let the equation of the straight line be V=aT+b.
For 1 mol of an ideal gas, pV = RT.
For 1 mol of an ideal gas, pV=RT.
So, p=RTV=RTaT+b=Ra+bT
According to this relation, p increases when T increases. In fig. T2>T1.So,p2>p1.
|
Topper's Solved these Questions
- FIRST AND SECOND LAW OF THERMODYNAMICSBOOK - CHHAYA PUBLICATIONCHAPTER - FIRST AND SECOND LAW OF THERMODYNAMICSEXERCISE - Exercise - Multiple Choice Questions (Mark 1)
31 Videos
- FIRST AND SECOND LAW OF THERMODYNAMICSBOOK - CHHAYA PUBLICATIONCHAPTER - FIRST AND SECOND LAW OF THERMODYNAMICSEXERCISE - Exercise - Very Short Answer Type Questions (Mark 1)
53 Videos
- FIRST AND SECOND LAW OF THERMODYNAMICSBOOK - CHHAYA PUBLICATIONCHAPTER - FIRST AND SECOND LAW OF THERMODYNAMICSEXERCISE - Section Related Questions
50 Videos
- EXPANSION OF SOLIDS AND LIQUIDSBOOK - CHHAYA PUBLICATIONCHAPTER - EXPANSION OF SOLIDS AND LIQUIDSEXERCISE - CBSE SCANNER
2 Videos
- FRICTION BOOK - CHHAYA PUBLICATIONCHAPTER - FRICTION EXERCISE - CBSE SCANNER
7 Videos
Similar Questions
Knowledge Check
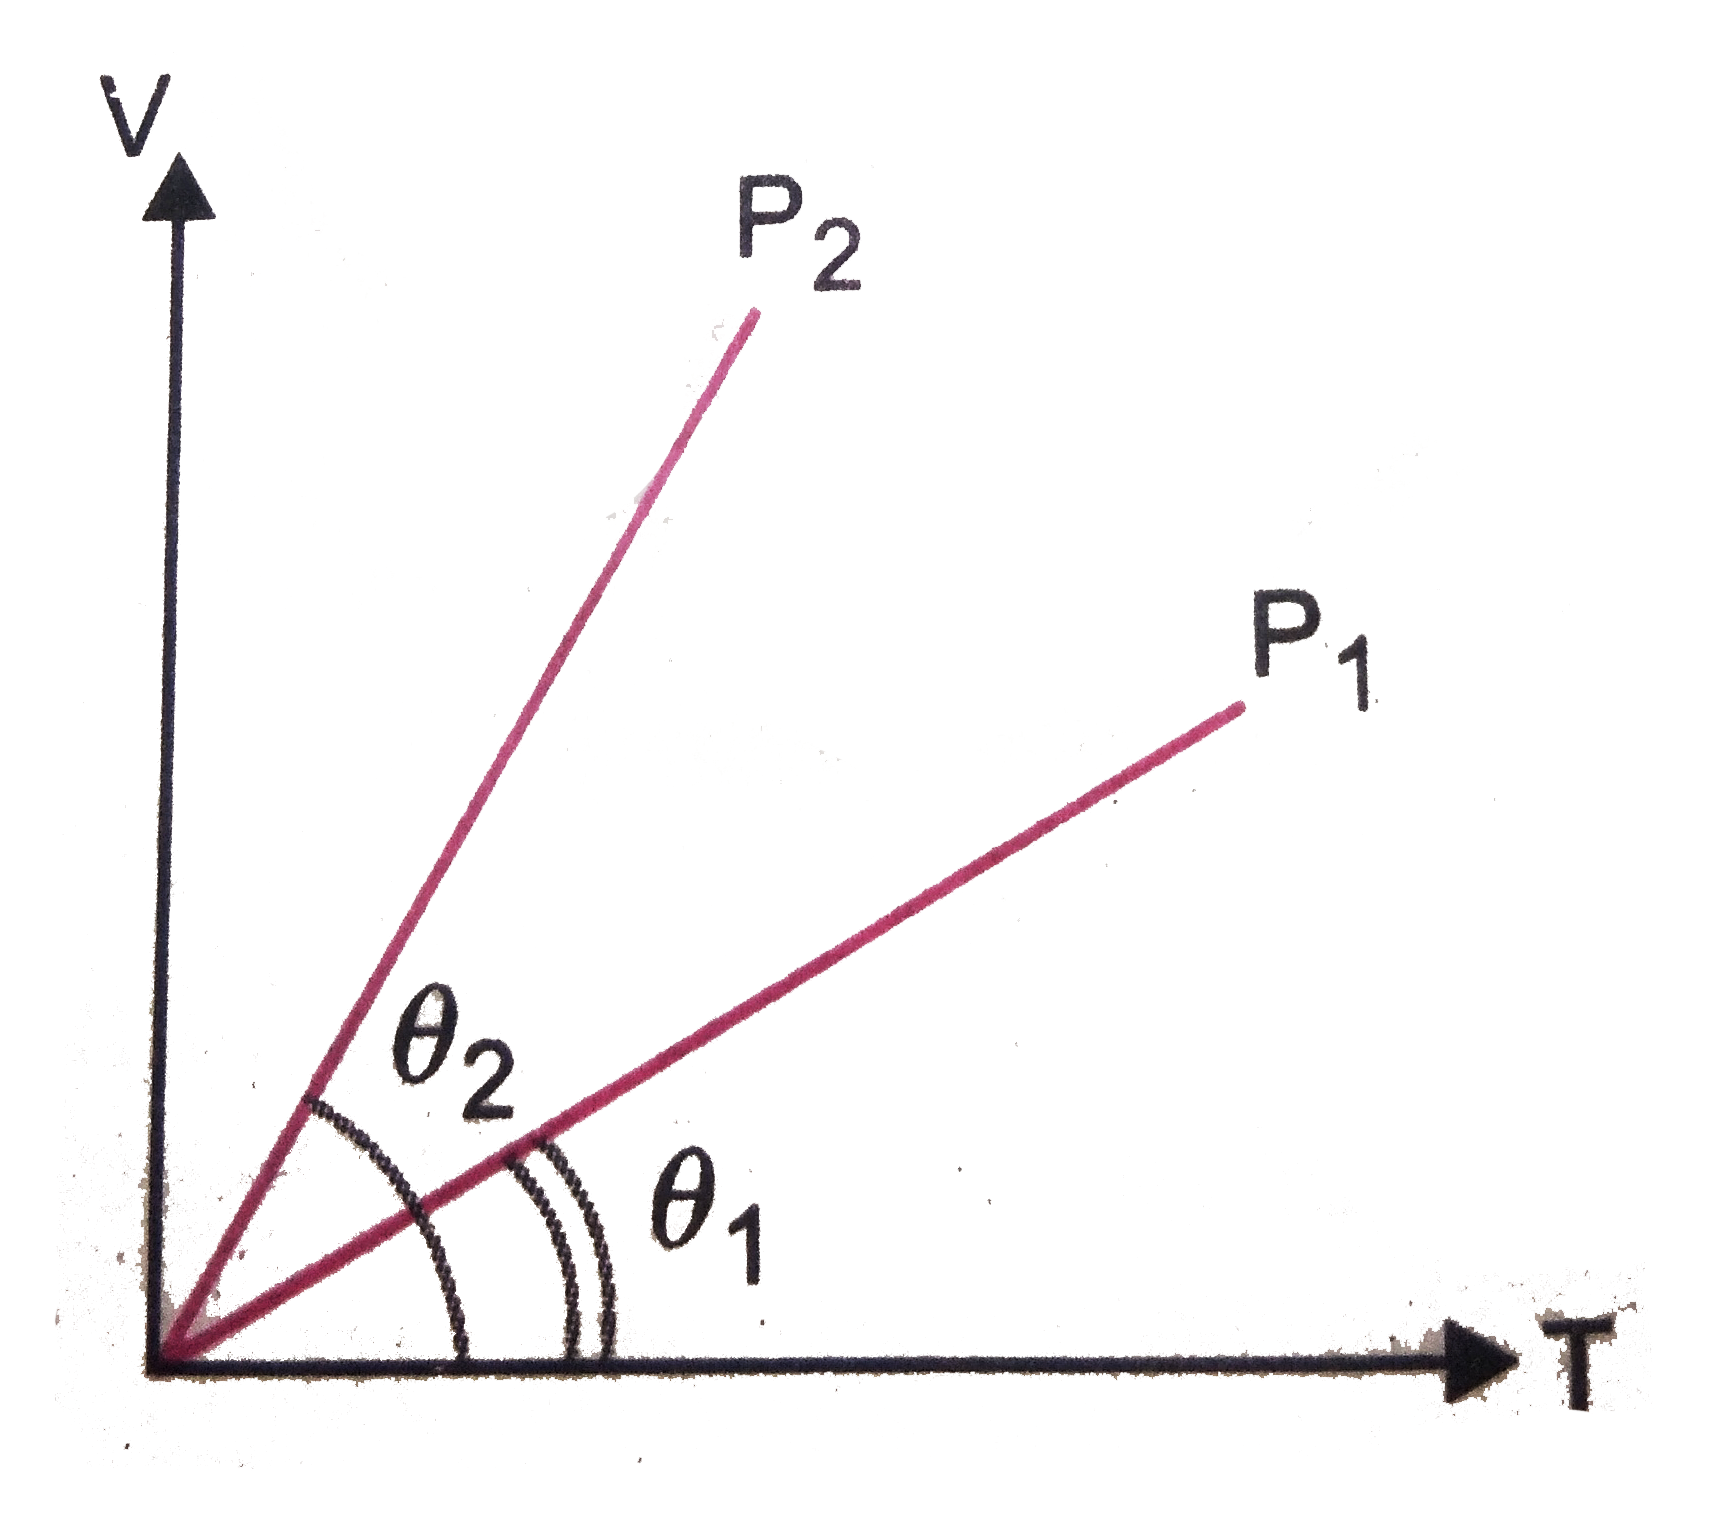
In the given (V-T) diagram, what is the relation between pressures P1 and P2 ?
 AP2>P1BCannot be predictedCP2=P1DP2>P1
In the given (V-T) diagram, what is the relation between pressure P1andP2 ?
 ACannot be predictedBP2=P1CP2>P1DP2<P1
In V-T diagram shown in fig., what is the relation between P1andP2 ?
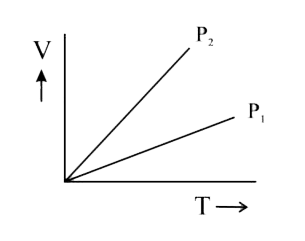 AP2andP1BP2>P1CP1>P2DCannot say
In the given (V-T) diagram, what is the relation between pressure P1andP2 ?

View SolutionV vs T curves at constant pressure P1 and P2 for an ideal gas are shown below
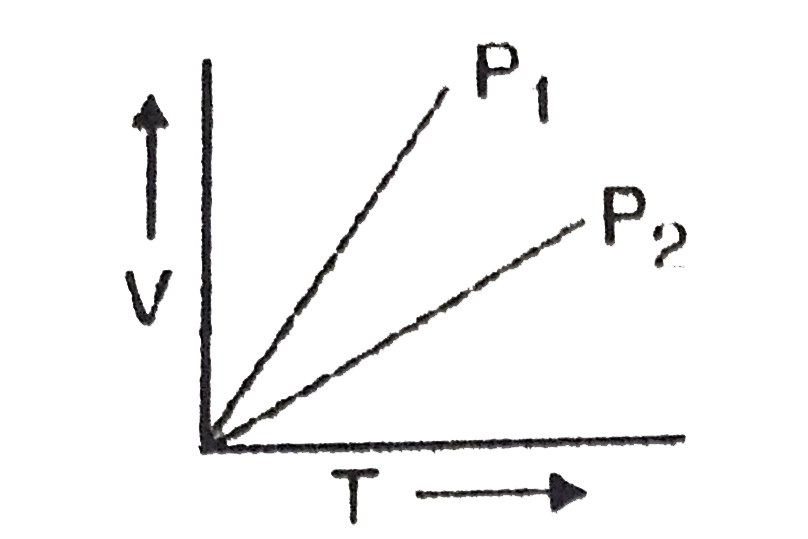
Which is correct ?
View SolutionV vs T curves at different pressures P1 and P2 for an ideal gas are shown below:
Which one of the following is correct?
View SolutionV vs T curves at different pressures P1 and P2 for an ideal gas are shown below:

Which one of the following is correct?
View SolutionV vs T curves at constant pressure P1 and P2 for an ideal gas are shown below

Which is correct ?
View Solution
