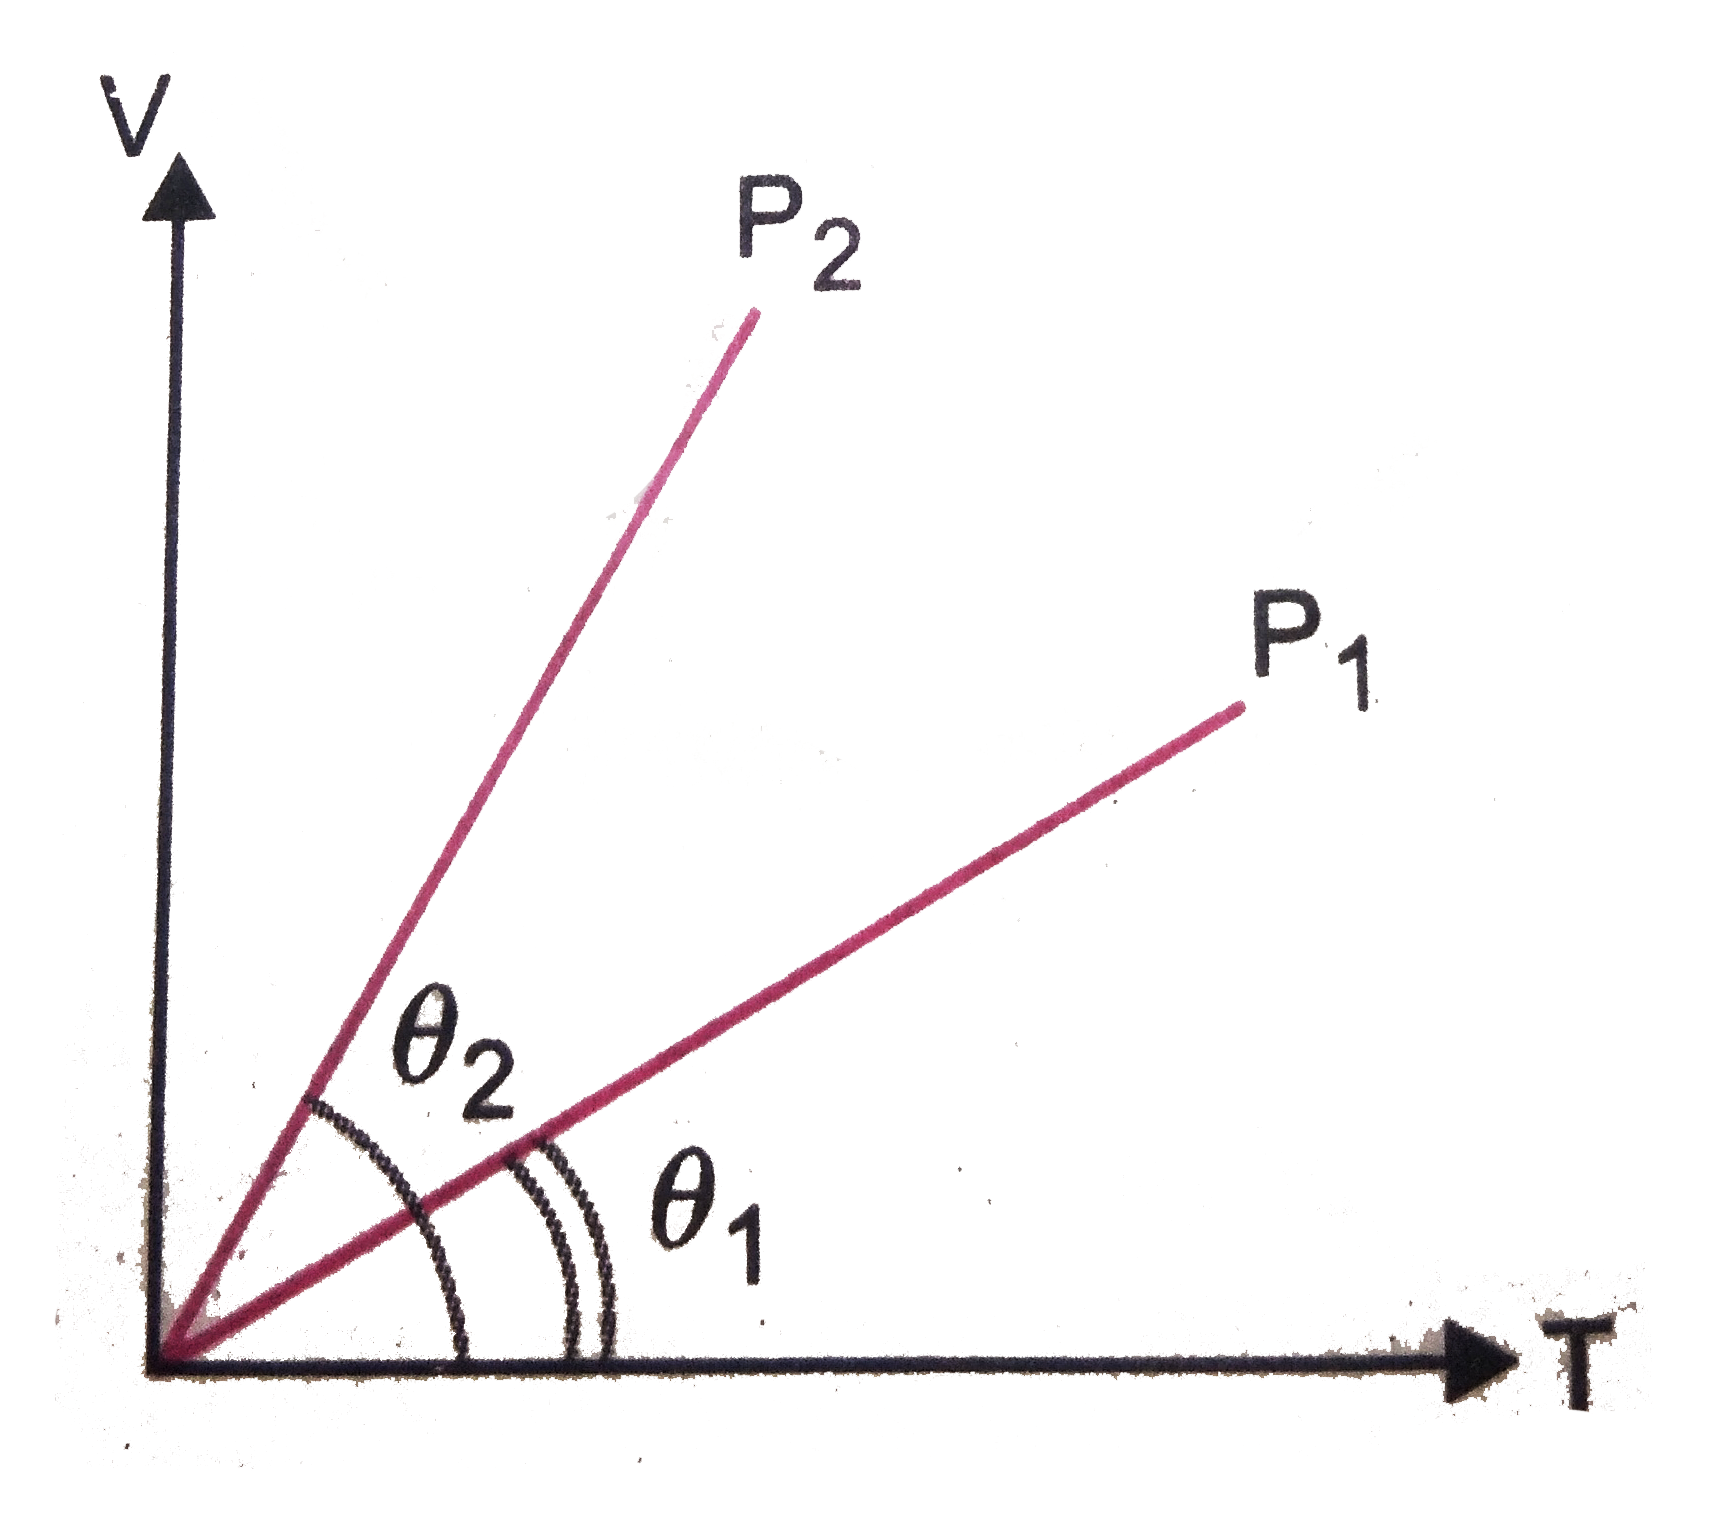
In the given (V-T) diagram, what is the relation between pressure P1andP2 ?
p2=p1
p2>p1
p2<p1
Cannot be predicted
The correct Answer is:C
V.T graph is a straight line passing through origin. Hence proess is isobaric.
V=(nRp)T ⇒slope=nRp
Slope of 2> slope of 1
∴ p2>p1
Topper's Solved these Questions
- THERMOMETRY THERMAL EXPANSION AND KINETIC THEORY OF GASESBook:DC PANDEY ENGLISHChapter:THERMOMETRY THERMAL EXPANSION AND KINETIC THEORY OF GASESExercise:A Tacking it together
Explore 55 Videos
- THERMOMETRY THERMAL EXPANSION AND KINETIC THEORY OF GASESBook:DC PANDEY ENGLISHChapter:THERMOMETRY THERMAL EXPANSION AND KINETIC THEORY OF GASESExercise:B medical entrance special format questions
Explore 14 Videos
- THERMOMETRY THERMAL EXPANSION AND KINETIC THEORY OF GASESBook:DC PANDEY ENGLISHChapter:THERMOMETRY THERMAL EXPANSION AND KINETIC THEORY OF GASESExercise:Check point 14.3
Explore 20 Videos
- SUPERPOSITION OF WAVESBook:DC PANDEY ENGLISHChapter:SUPERPOSITION OF WAVESExercise:Level 2 Subjective
Explore 8 Videos
- THERMOMETRY,THERMAL EXPANSION & KINETIC THEORY OF GASESBook:DC PANDEY ENGLISHChapter:THERMOMETRY,THERMAL EXPANSION & KINETIC THEORY OF GASESExercise:Level 2 Subjective
Explore 9 Videos
Similar Questions
Knowledge Check
Given is the graph between PVT and P for 1 gm of oxygen gas at two different temperatures T1andT2 Fig. Given, density of oxygen =1.427kgm−3. The value of (PV)/(T) at the point A and the relation between T1andT2 are respectively :
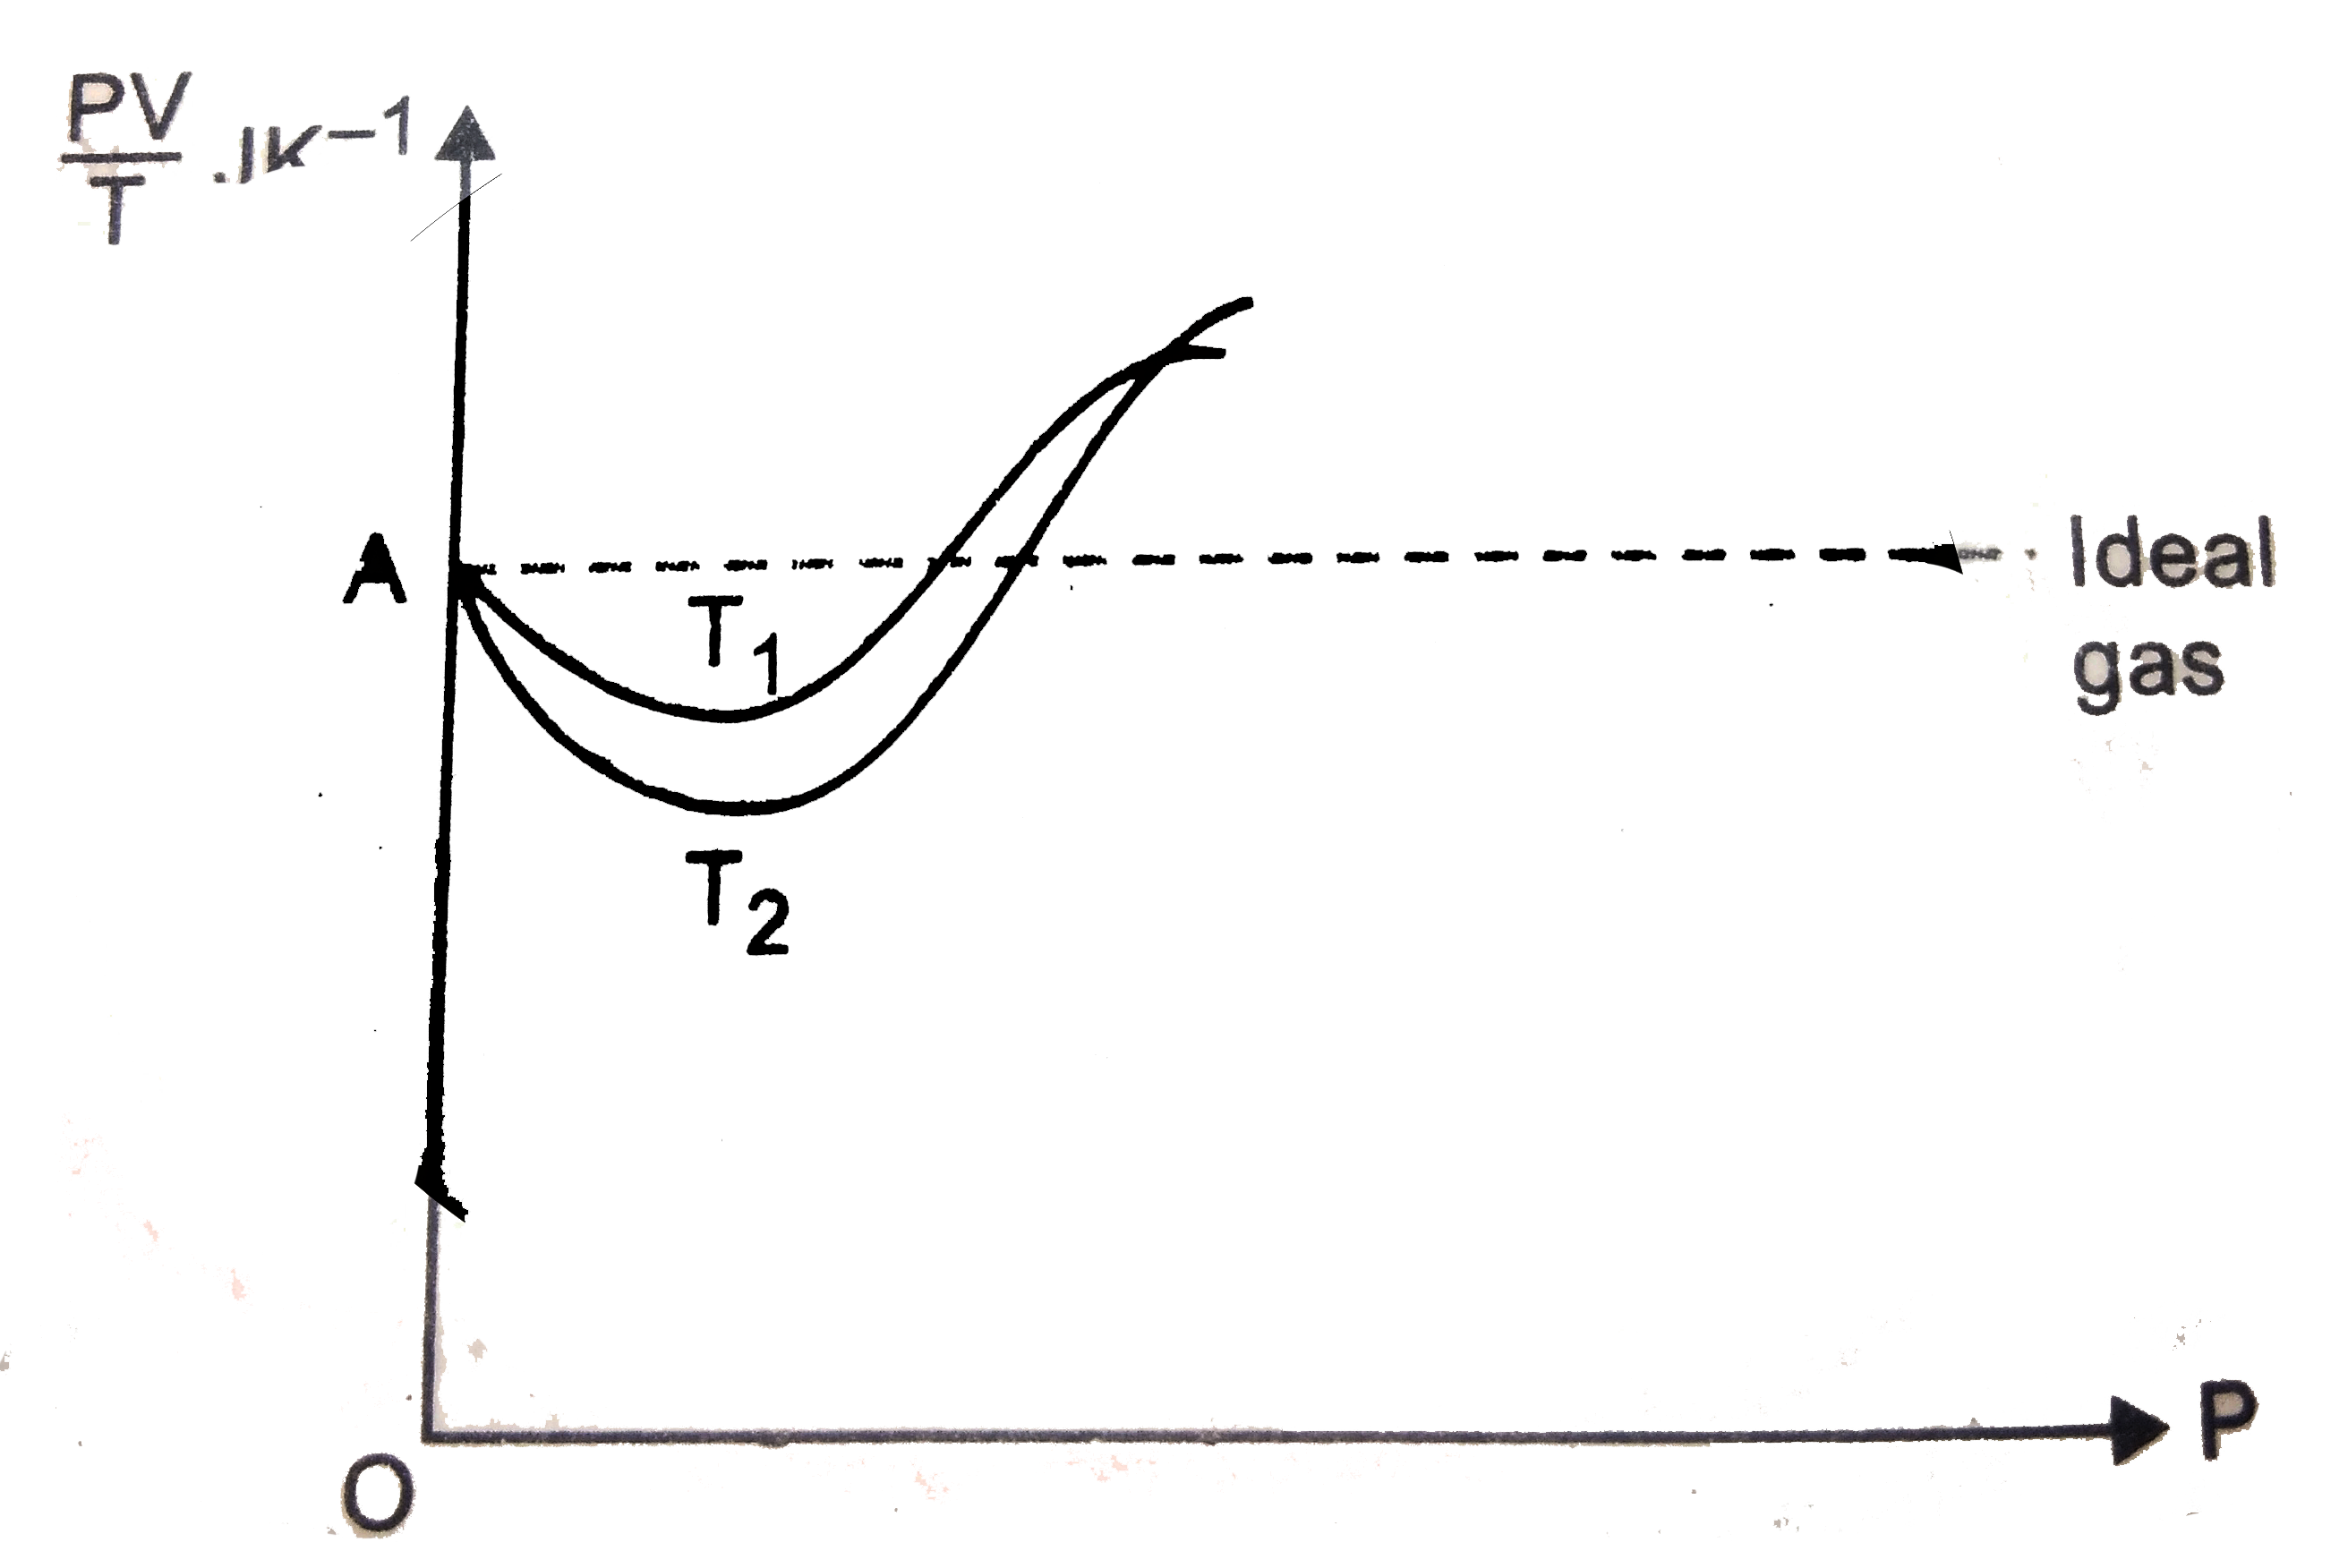 A0.259JK−1andT1<T2B8.314gJmol−1K−1andT1>T2C0.259JK−1andT1>T2D4.28gJK−1andT1<T2
Volume versus temperature graphs for a given mass of an ideal gas are shown in figure. At two different values of constant pressure. What can be inferred about relation between P1 and P2 ?
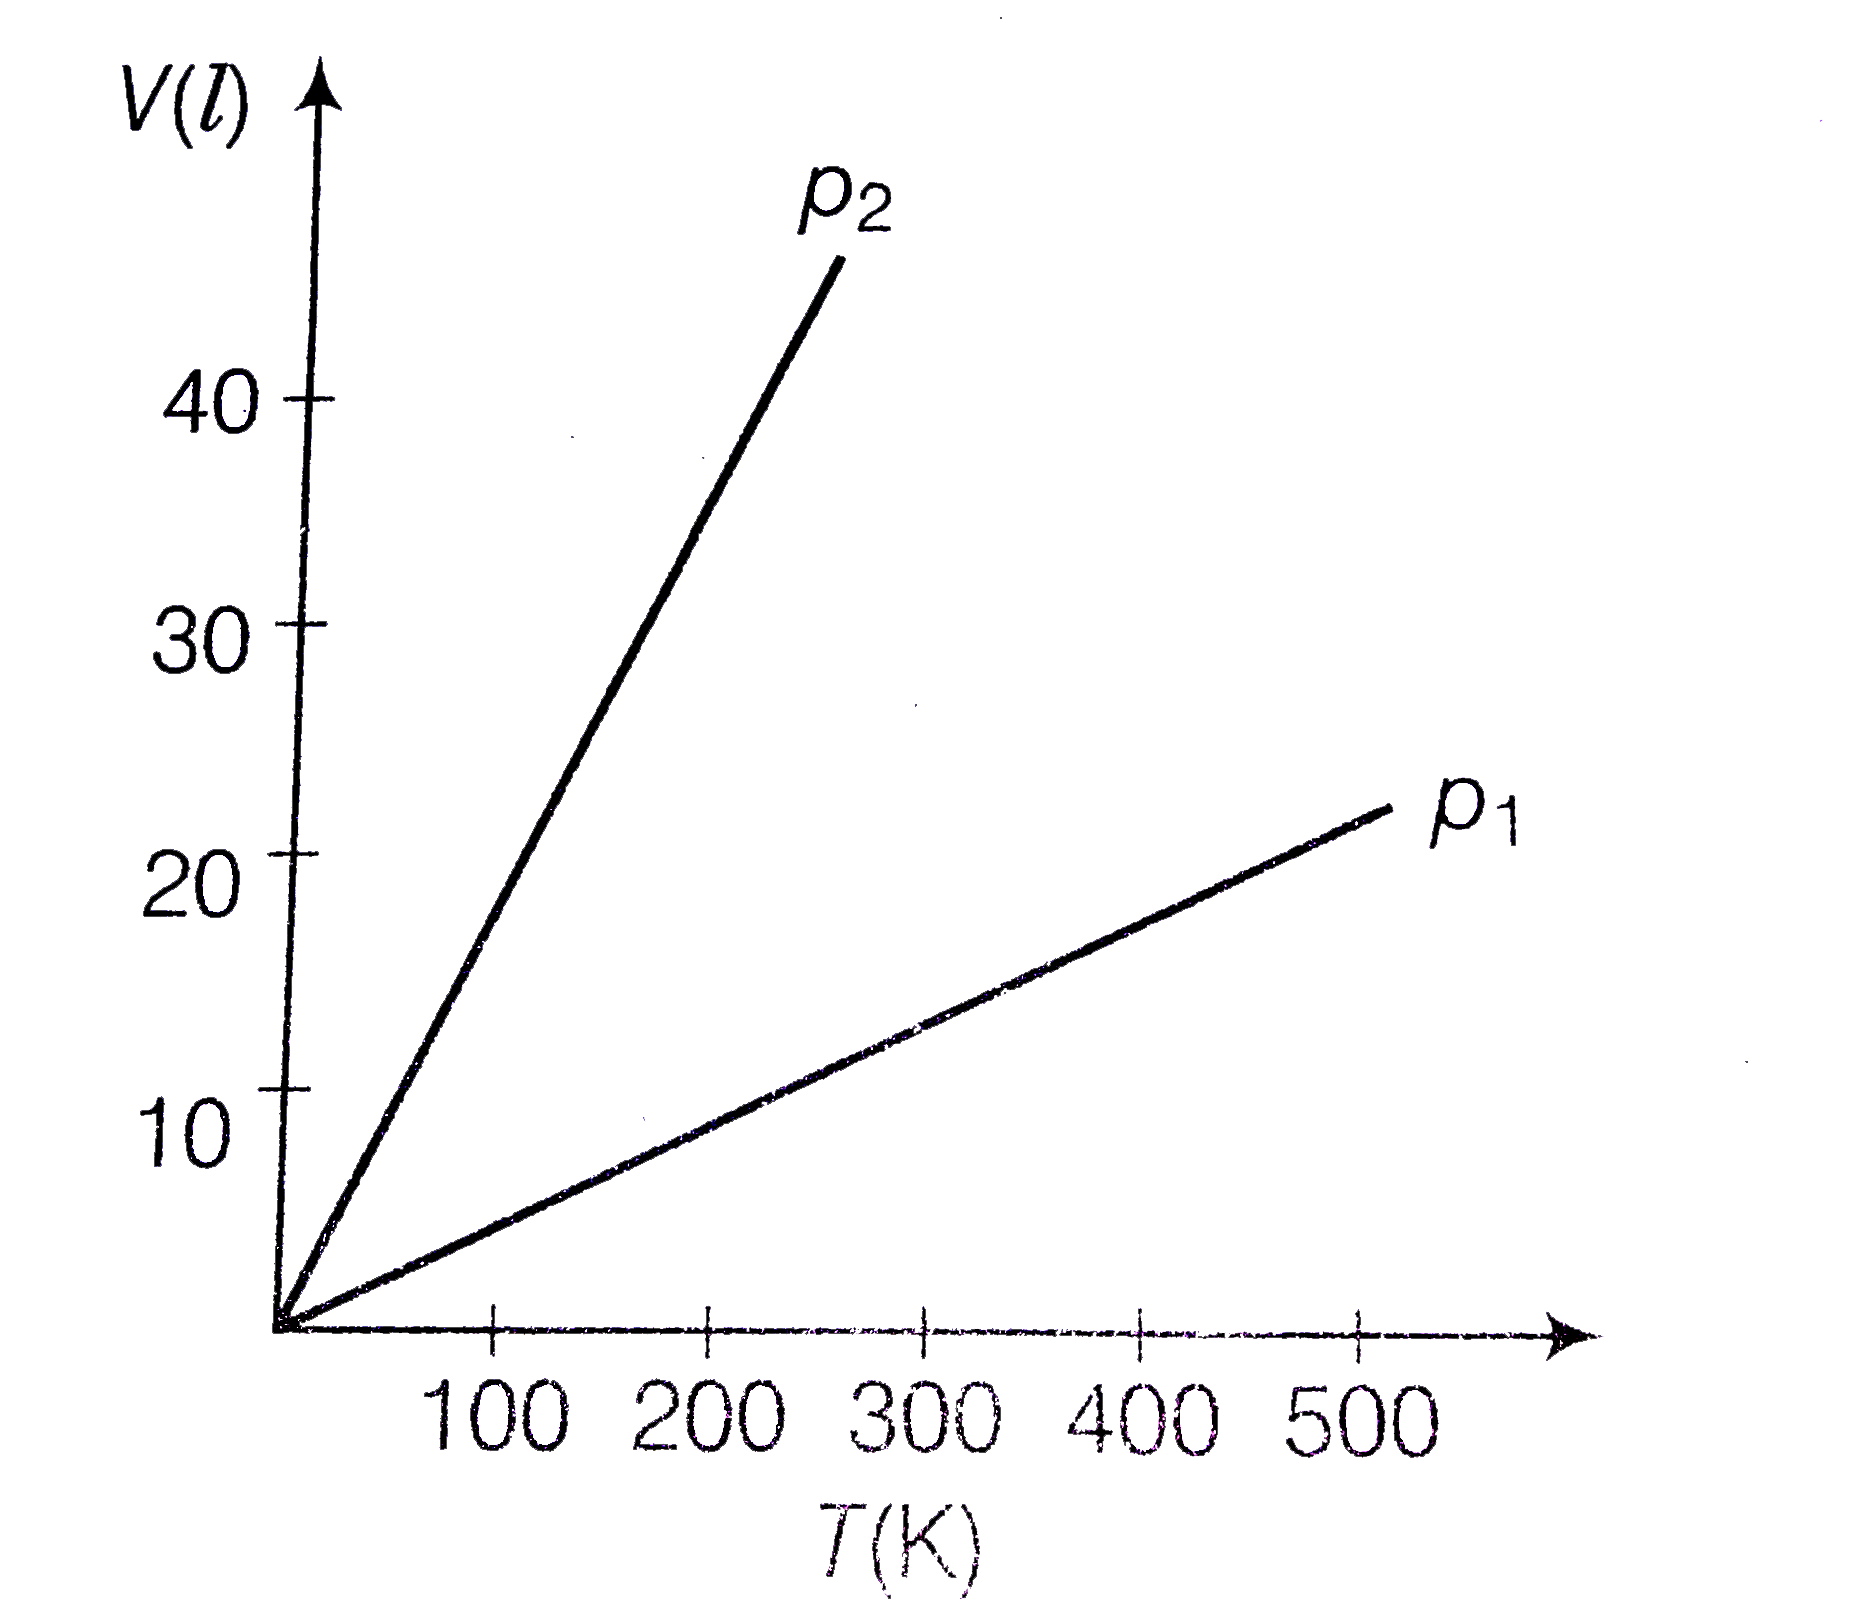 AP1>P2BP1=P2CP1<P2Ddata is insufficient
The relationship between PC,VC and TC is
View SolutionIn the given elliptical P−V diagram
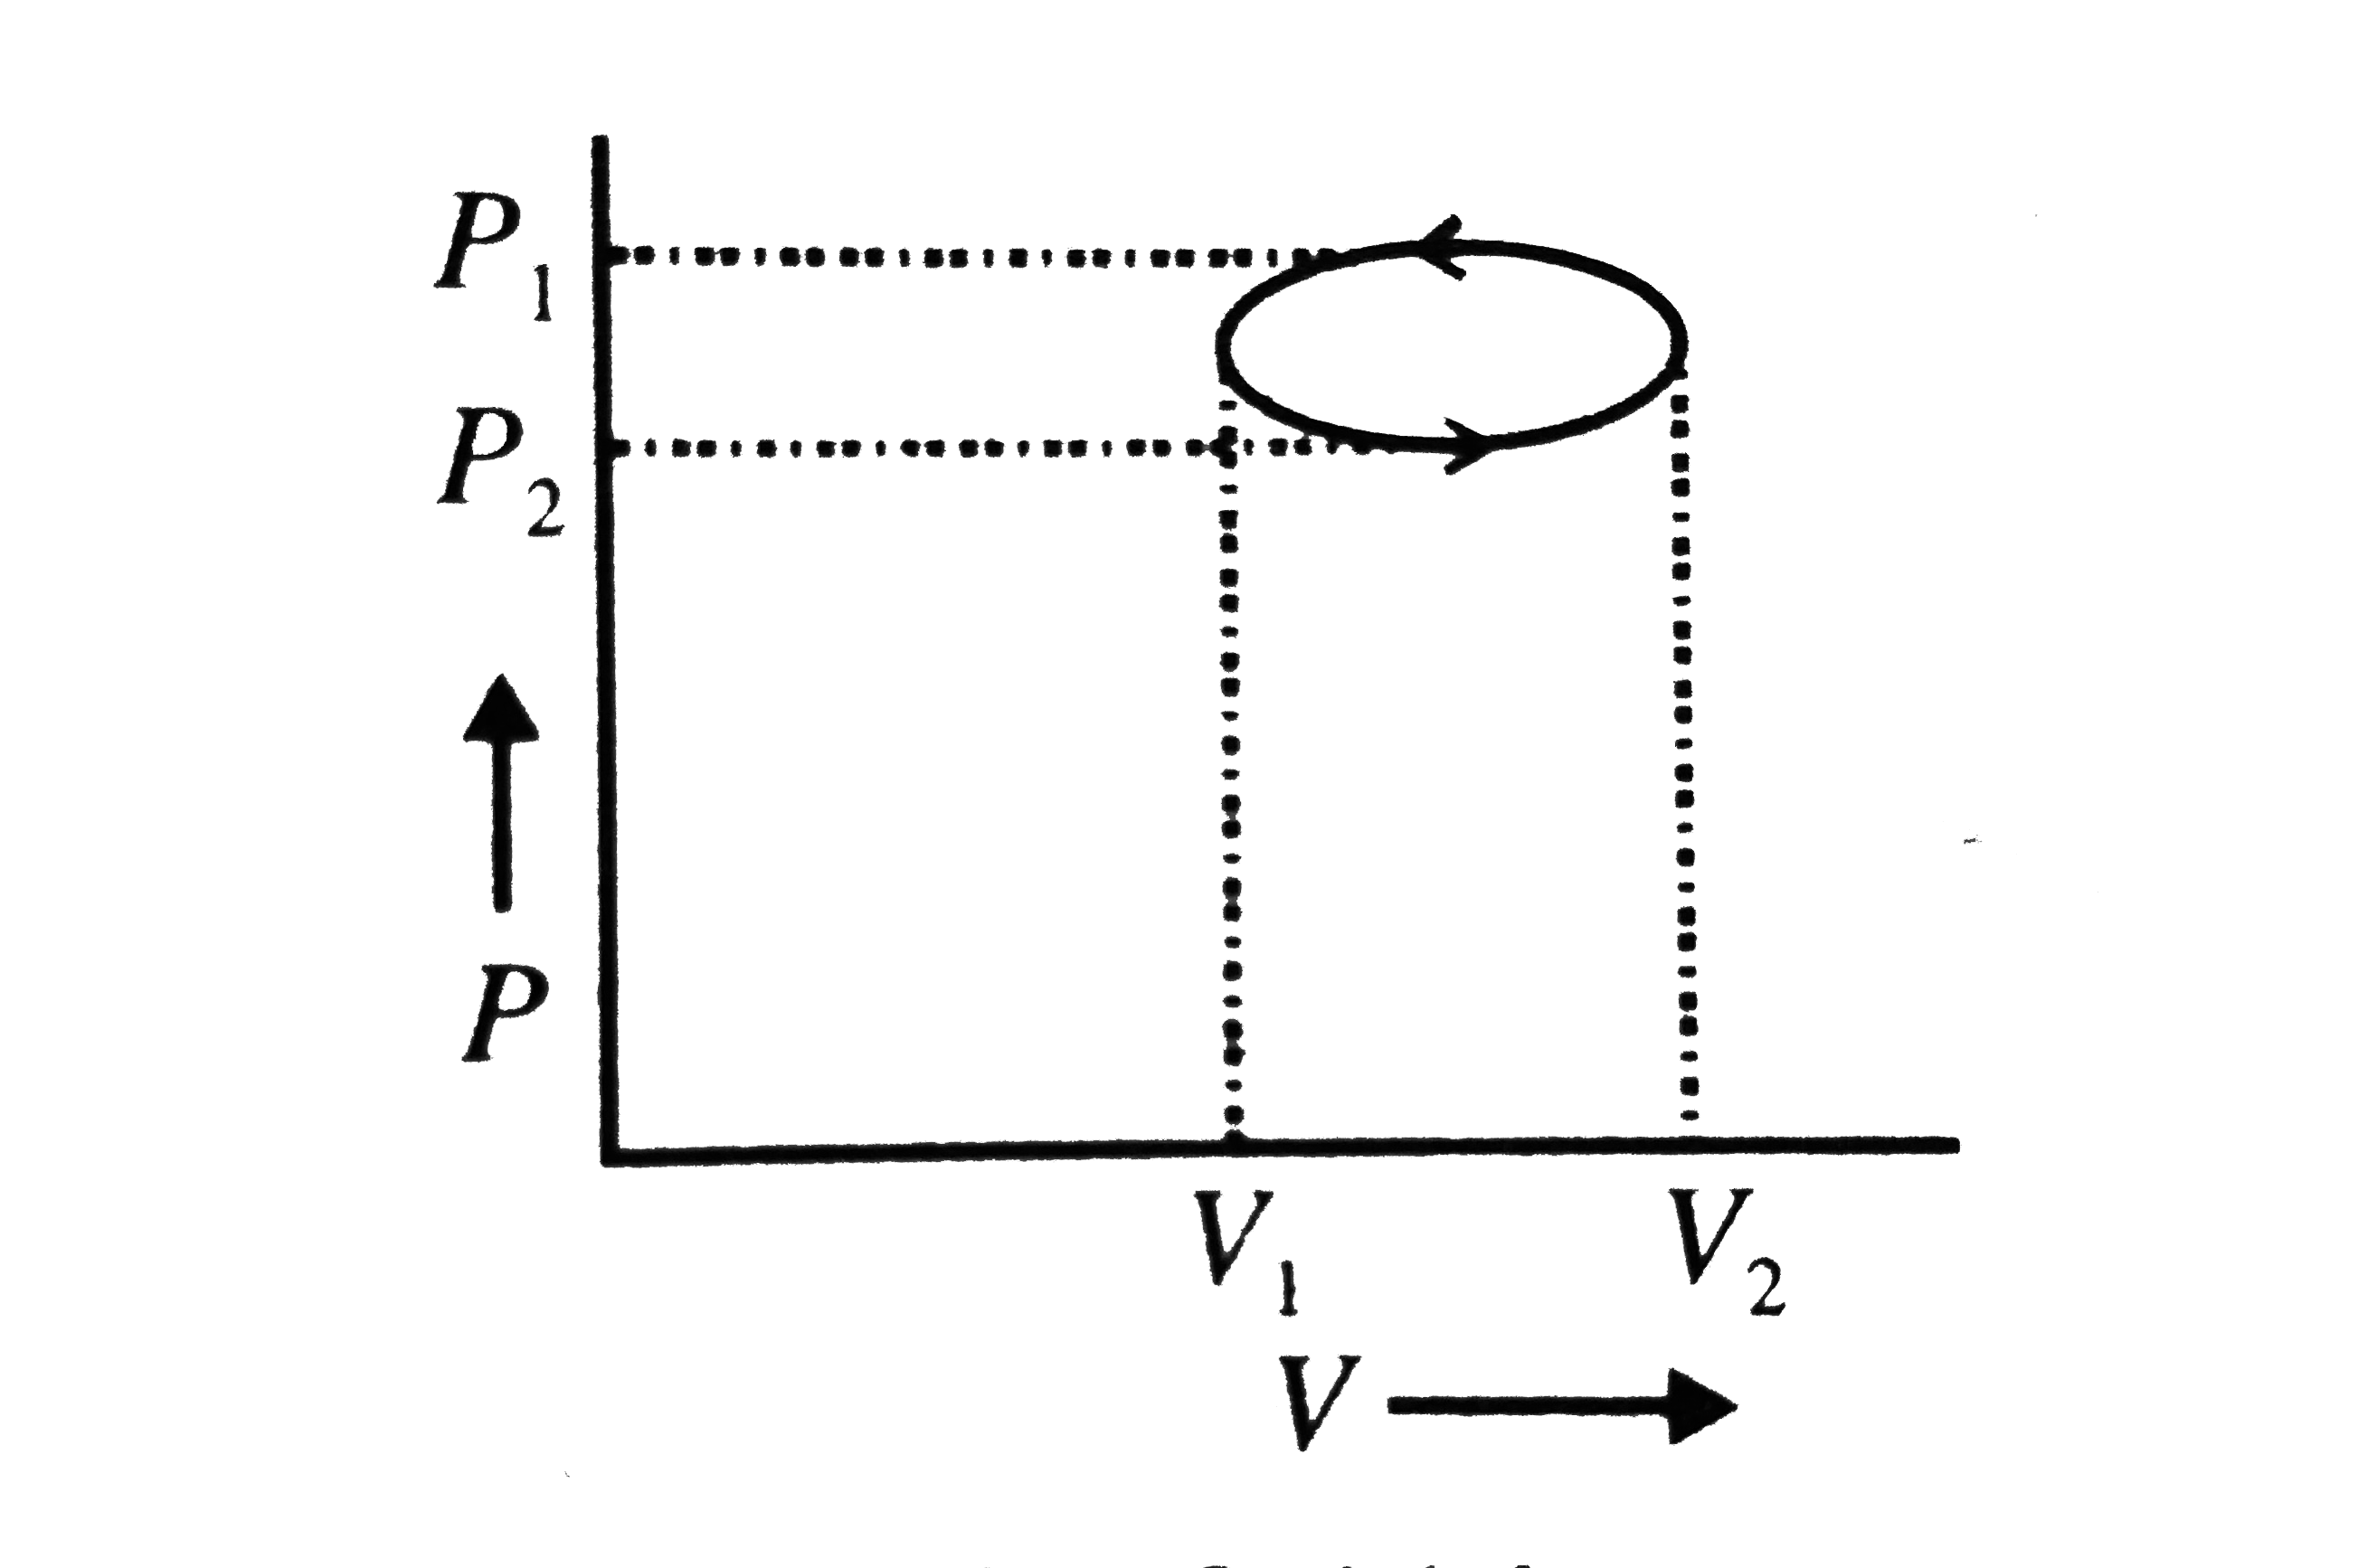
View SolutionVolume versus temperature graphs for a given mass of an ideal gas are shown in figure. At two different values of constant pressure. What can be inferred about relation between P1 and P2 ?

View SolutionVolume versus temperature graphs for a given mass of an ideal gas are shown in figure. At two different values of constant pressure. What can be inferred about relation between P1 and P2 ?

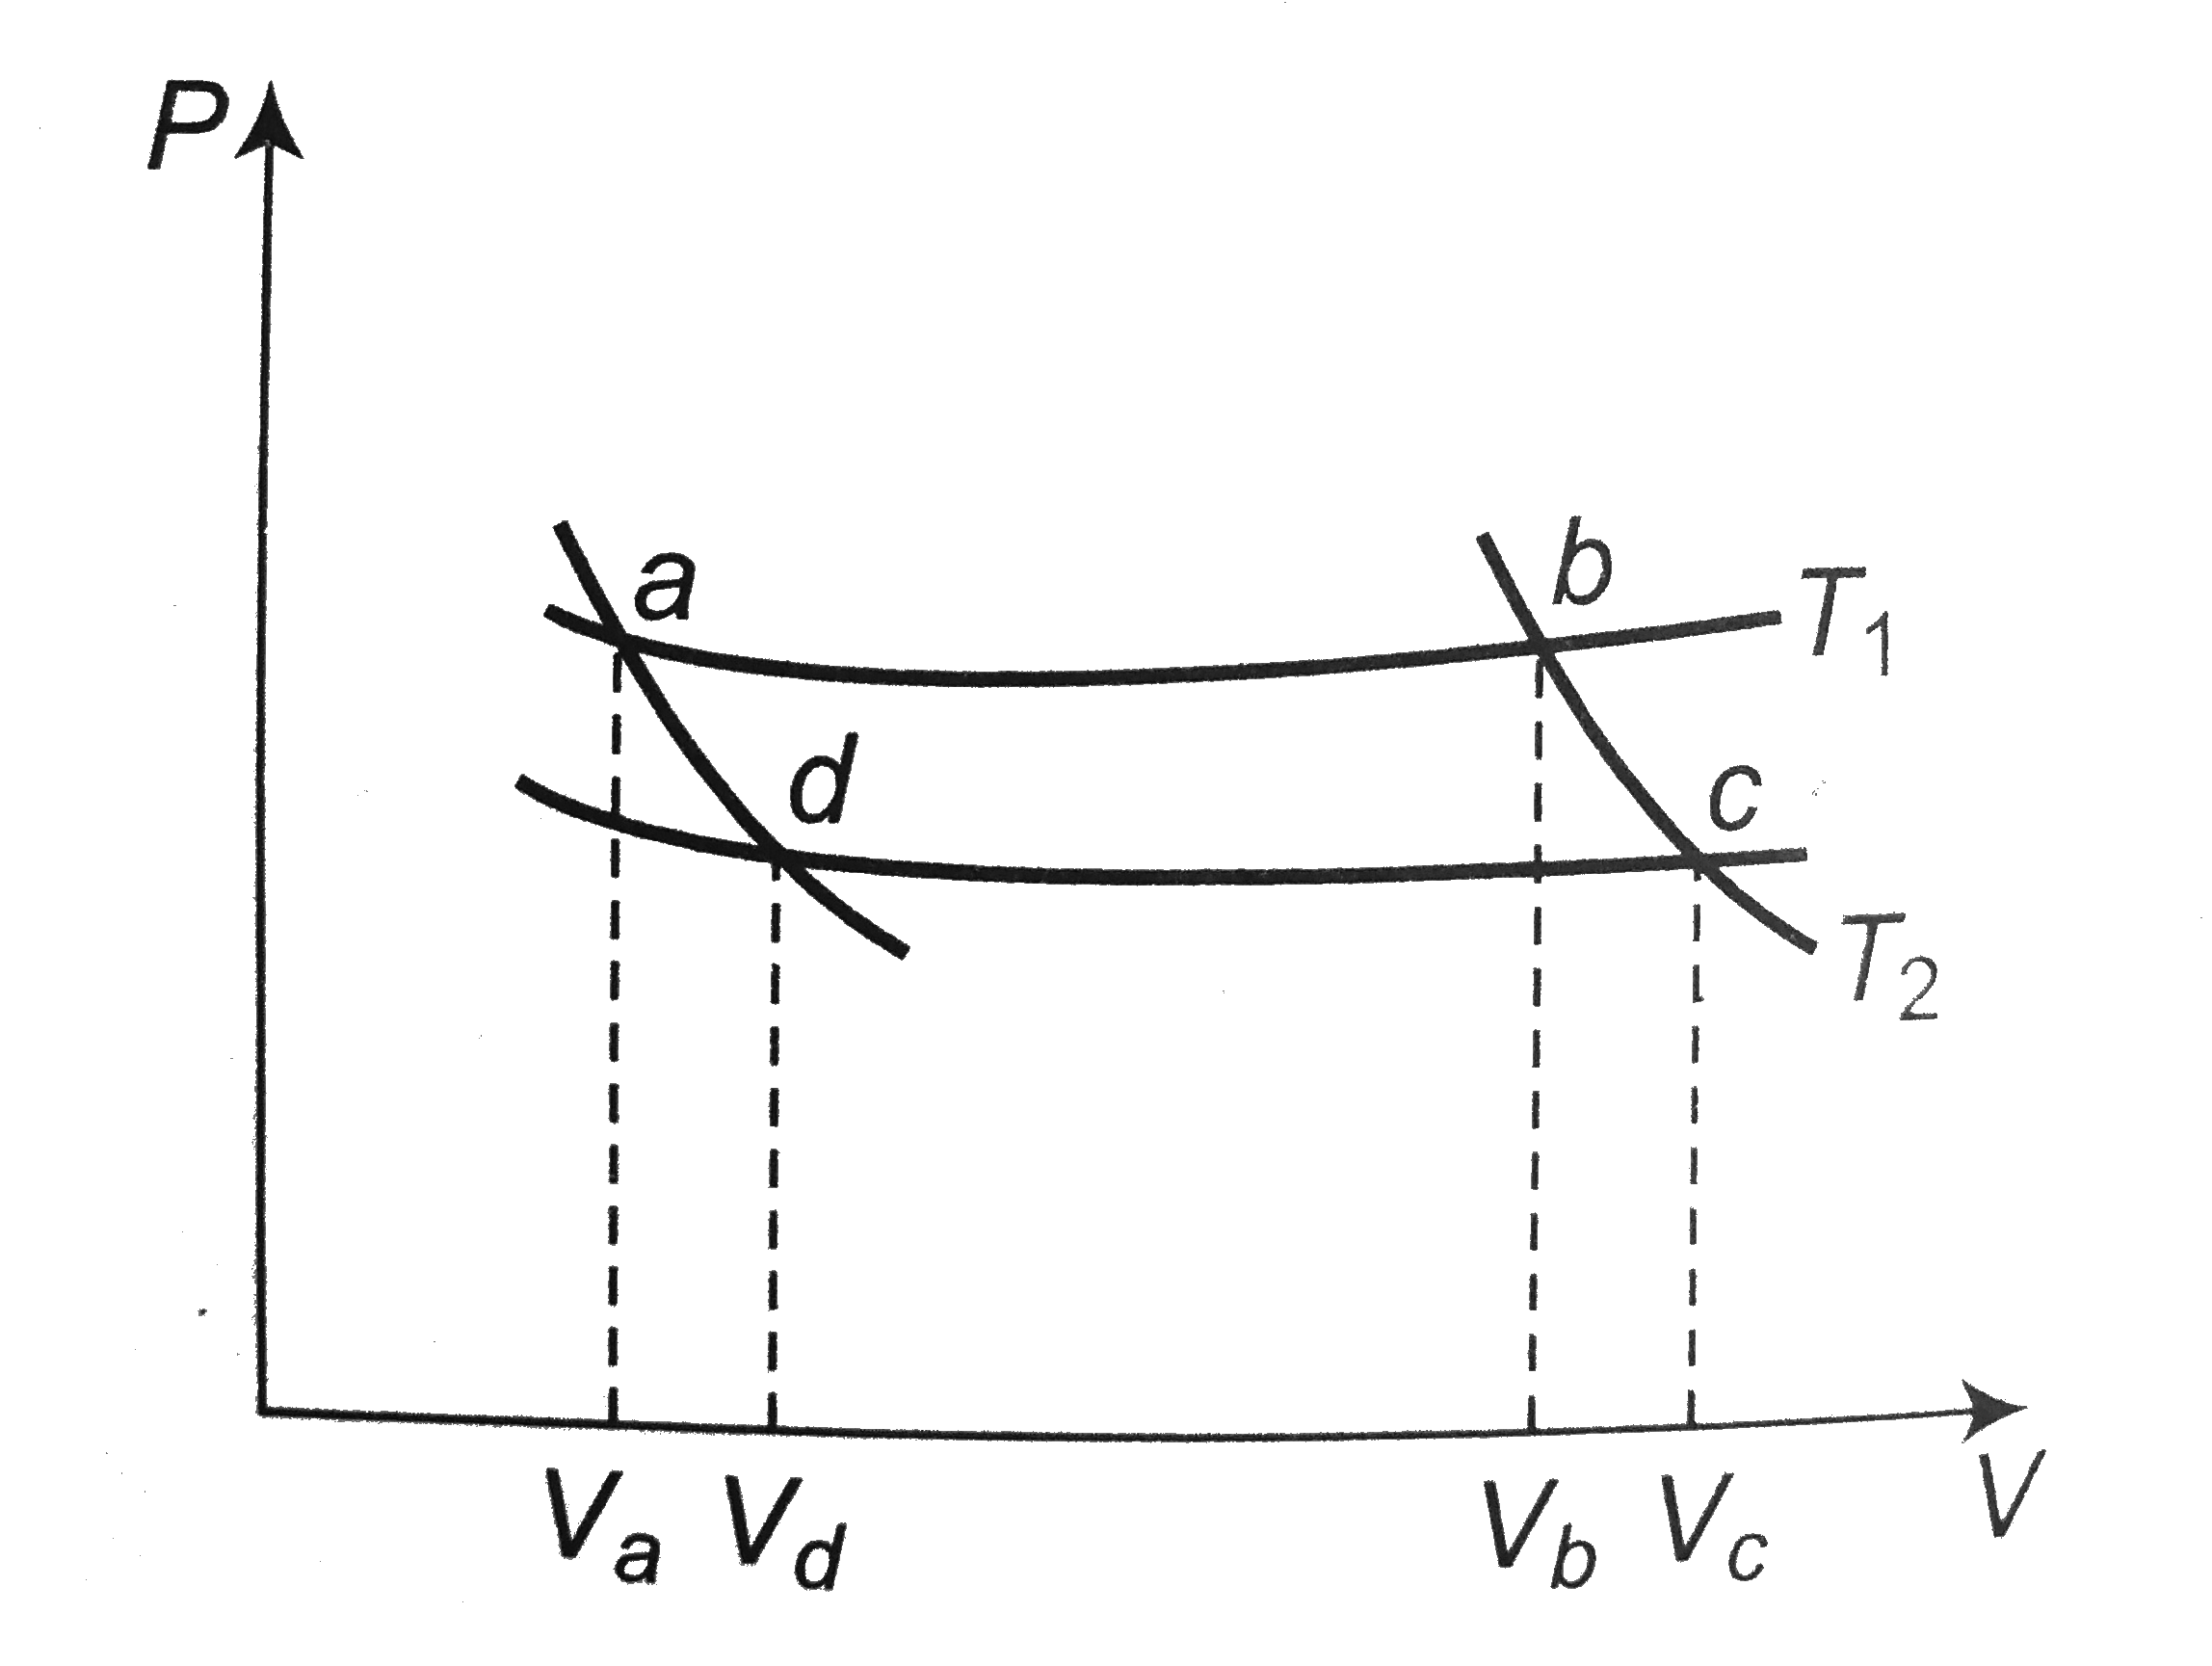
View SolutionIn the following P-V diagram two adiabatics cut two isothermals at temperature T1andT2 (fig). The value of VaVd will be
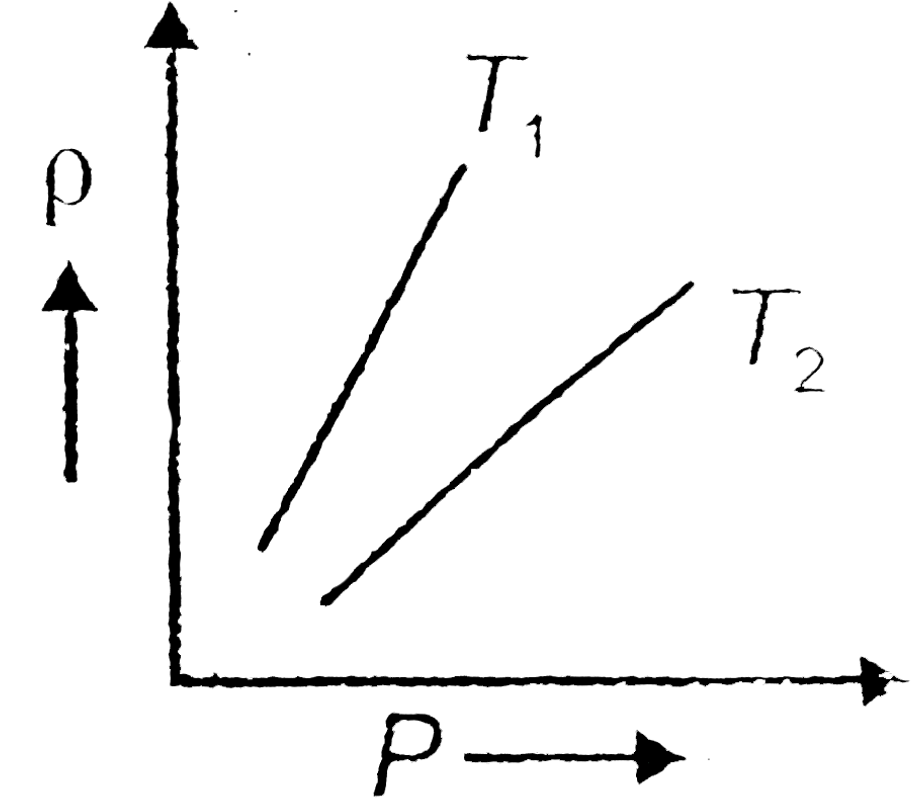
View SolutionThe density (ρ) versus pressure (P) graphs of a given mass of an ideal gas is shown at two temperatures T1andT2. Then relation between T1andT2 may be
View Solution