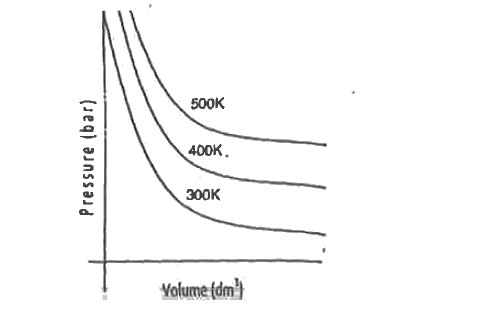
Explain graphical representation of Boyle's law on effect of pressure v/s volume.

Text Solution
Boyls.s law can also be represented graphically by plotting pressure along y-axis and volume along x-axis. It is to be noted that v decreases as P increases. However, the product always remains unchanged at a given temperature. Since temperatureis kept constant, these graphs of P versus V are called isotherms.
|
Topper's Solved these Questions
- STATES OF MATTER : GASES AND LIQUIDS BOOK - SUBHASH PUBLICATIONCHAPTER - STATES OF MATTER : GASES AND LIQUIDS EXERCISE - THREE MARK QUESTIONS AND ANSWERS
9 Videos
- STATES OF MATTER : GASES AND LIQUIDS BOOK - SUBHASH PUBLICATIONCHAPTER - STATES OF MATTER : GASES AND LIQUIDS EXERCISE - NUMERICAL PROBLEMS AND ANSWERS
25 Videos
- STATES OF MATTER : GASES AND LIQUIDS BOOK - SUBHASH PUBLICATIONCHAPTER - STATES OF MATTER : GASES AND LIQUIDS EXERCISE - NUMERICAL PROBLEMS AND ANSWERS
25 Videos
- SOME BASIC CONCEPTS OF CHEMISTRY BOOK - SUBHASH PUBLICATIONCHAPTER - SOME BASIC CONCEPTS OF CHEMISTRY EXERCISE - NUMERICAL PROBLEMS AND ANSWERS:
49 Videos
- STRUCTURE OF ATOMBOOK - SUBHASH PUBLICATIONCHAPTER - STRUCTURE OF ATOMEXERCISE - NUMERICAL PROBLEMS AND ANSWERS
29 Videos
Similar Questions
Knowledge Check
Boyle.s Law is
AP1V1=P2V2BP2V1=P1V2CV1T1=V2T2DV1T1=V2T2Boyle’s law says that
AP∝VBp∝1VCV∝TDV∝1TAccodring to Boyle's law, the product of pressure and volume is a constant. Hence,
AIf volume of lungs is increased, the pressure decreases, proportionatelyBIf volume of lungs is increased, the pressure also increases proportionatelyCIf volume of lungs is increased, the pressure decreases disprotionatelyDIf volume of lungs is increased, the pressure remains the same
Give the graphical representation of Boyle.s law and Charles.s law .
View SolutionGive the mathematical expression of Boyle.s law.
View SolutionState Boyle's law in terms of pressure and density of a gas.
View SolutionGive the mathematical expression for Boyle.s law
View SolutionAccoding to Boyle's law, the product of pressure and volume is a constant. Hence,
View Solution
