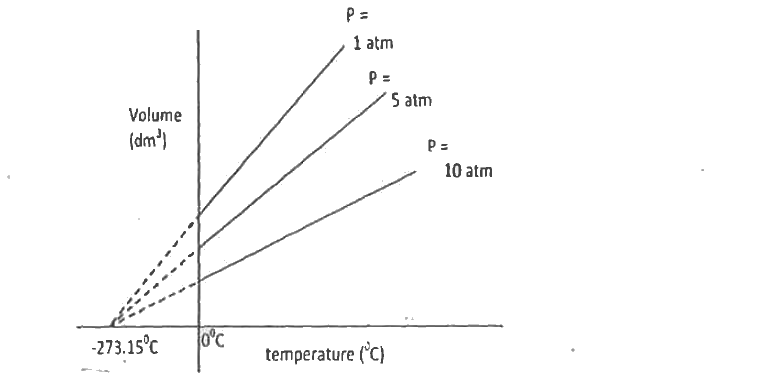
Explain graphical representation of Charle's law on effect of volume v/s
Text Solution
The equation V=K2T is similar to y=mX.Hence a graph of volume along y-axis and temperature in kelvin scal along X-axis be a striaght be a stright line passing through origin. Its slope represents K2.
|
Topper's Solved these Questions
- STATES OF MATTER : GASES AND LIQUIDS BOOK - SUBHASH PUBLICATIONCHAPTER - STATES OF MATTER : GASES AND LIQUIDS EXERCISE - THREE MARK QUESTIONS AND ANSWERS
9 Videos
- STATES OF MATTER : GASES AND LIQUIDS BOOK - SUBHASH PUBLICATIONCHAPTER - STATES OF MATTER : GASES AND LIQUIDS EXERCISE - NUMERICAL PROBLEMS AND ANSWERS
25 Videos
- STATES OF MATTER : GASES AND LIQUIDS BOOK - SUBHASH PUBLICATIONCHAPTER - STATES OF MATTER : GASES AND LIQUIDS EXERCISE - NUMERICAL PROBLEMS AND ANSWERS
25 Videos
- SOME BASIC CONCEPTS OF CHEMISTRY BOOK - SUBHASH PUBLICATIONCHAPTER - SOME BASIC CONCEPTS OF CHEMISTRY EXERCISE - NUMERICAL PROBLEMS AND ANSWERS:
49 Videos
- STRUCTURE OF ATOMBOOK - SUBHASH PUBLICATIONCHAPTER - STRUCTURE OF ATOMEXERCISE - NUMERICAL PROBLEMS AND ANSWERS
29 Videos
Similar Questions
Knowledge Check
The correct representation of Charles law is given in
A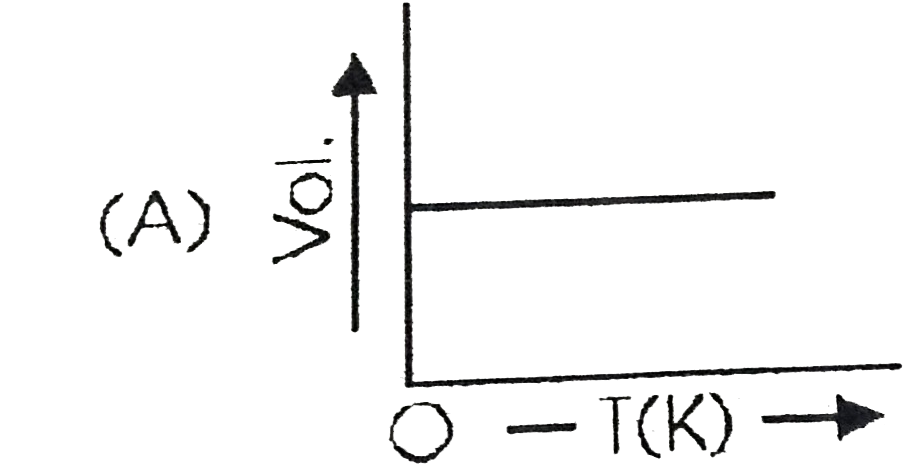 B
B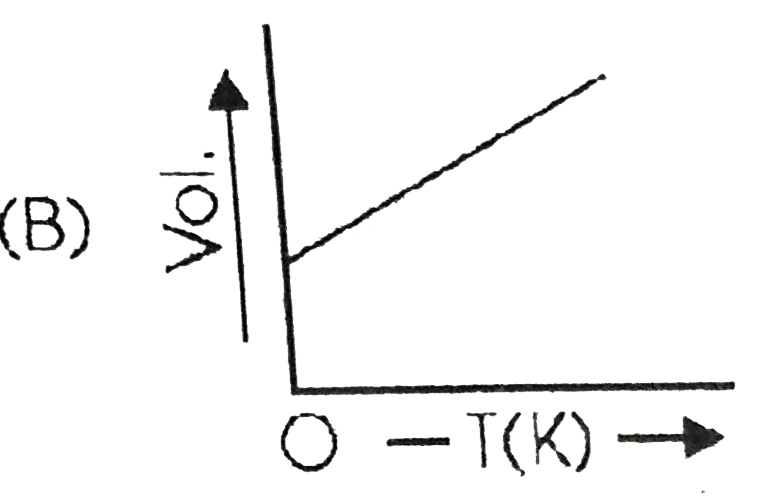 C
C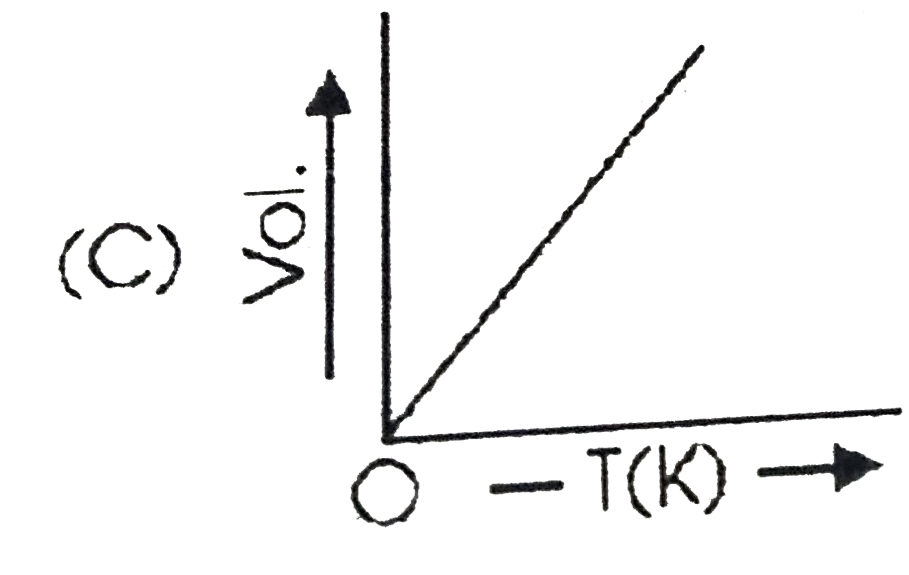 D
D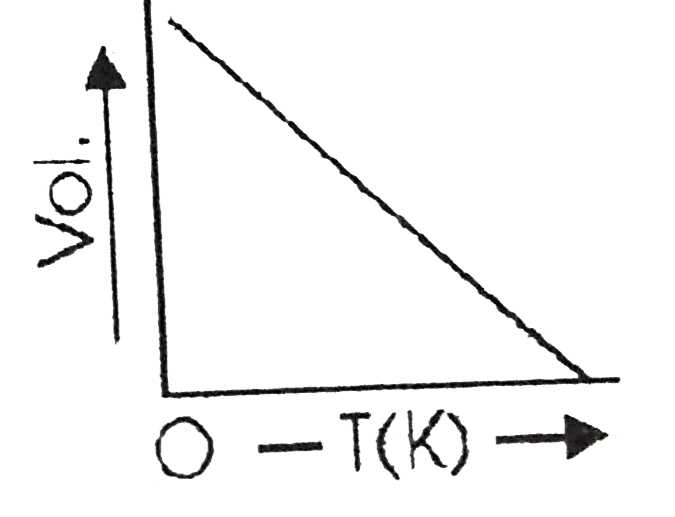
The correct representation of Charle's law is given in
A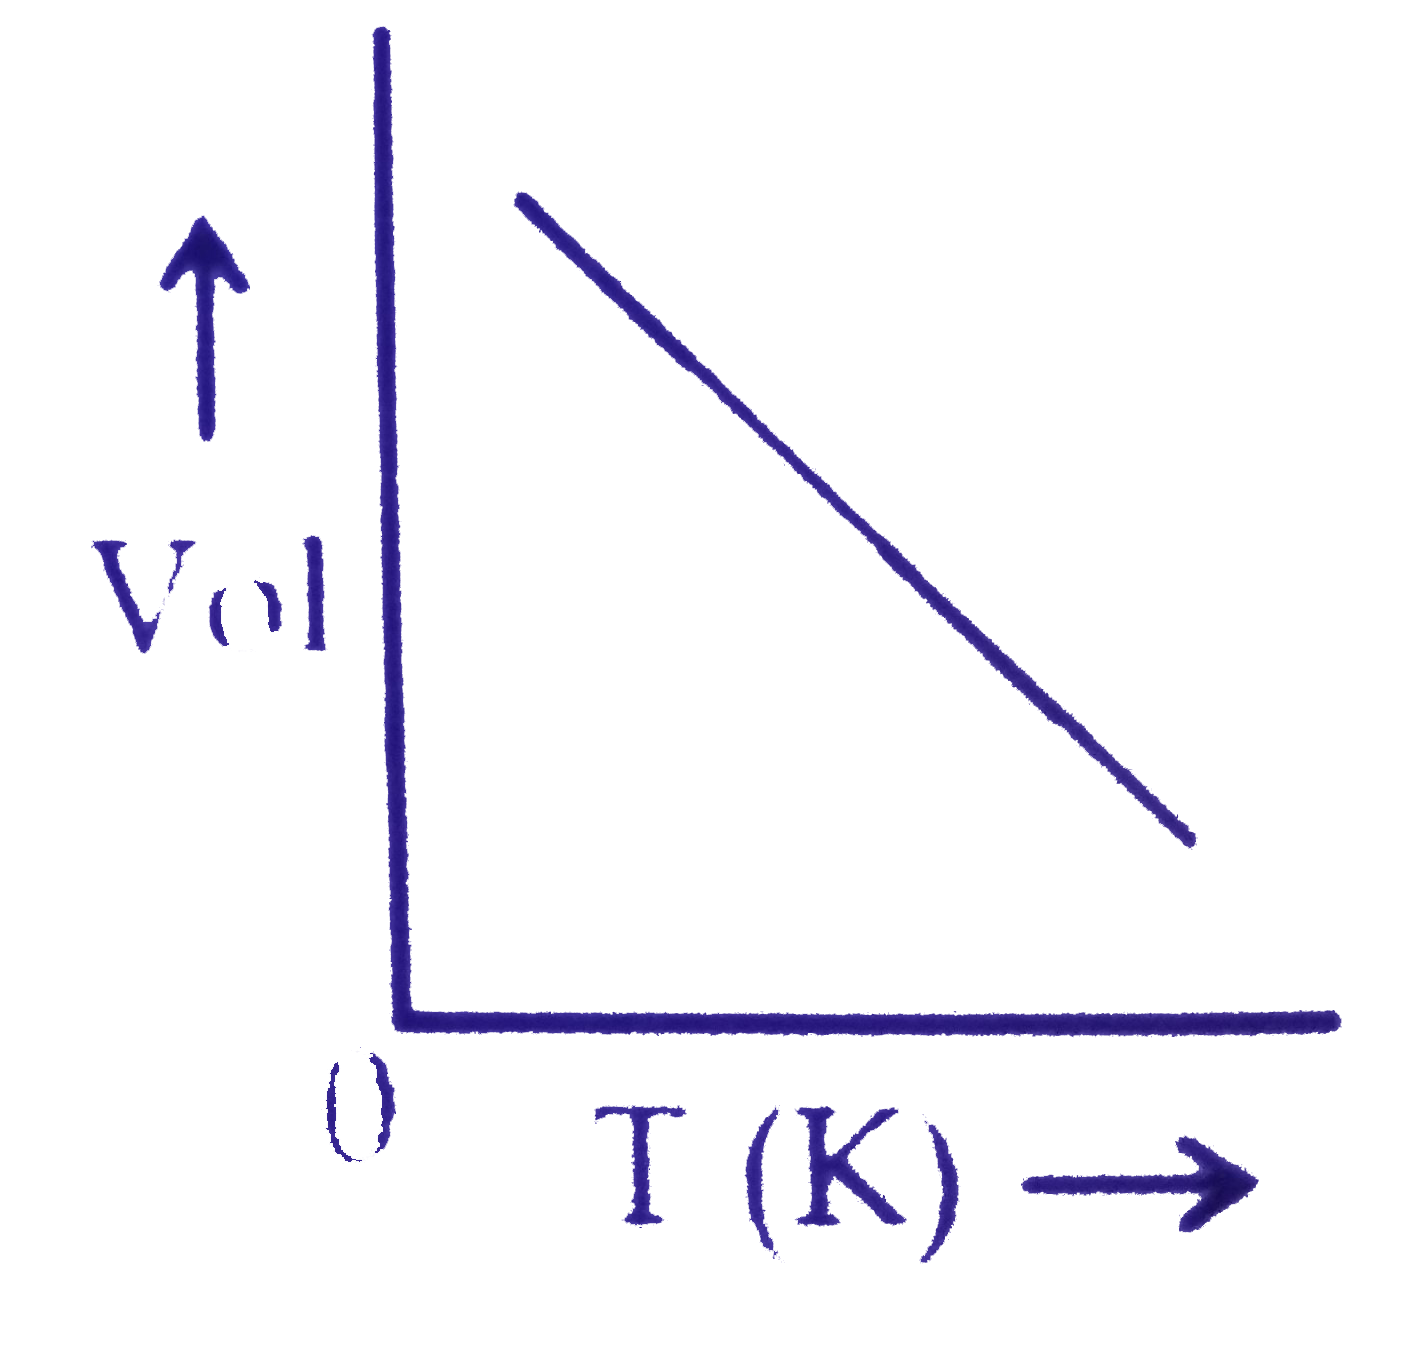 B
B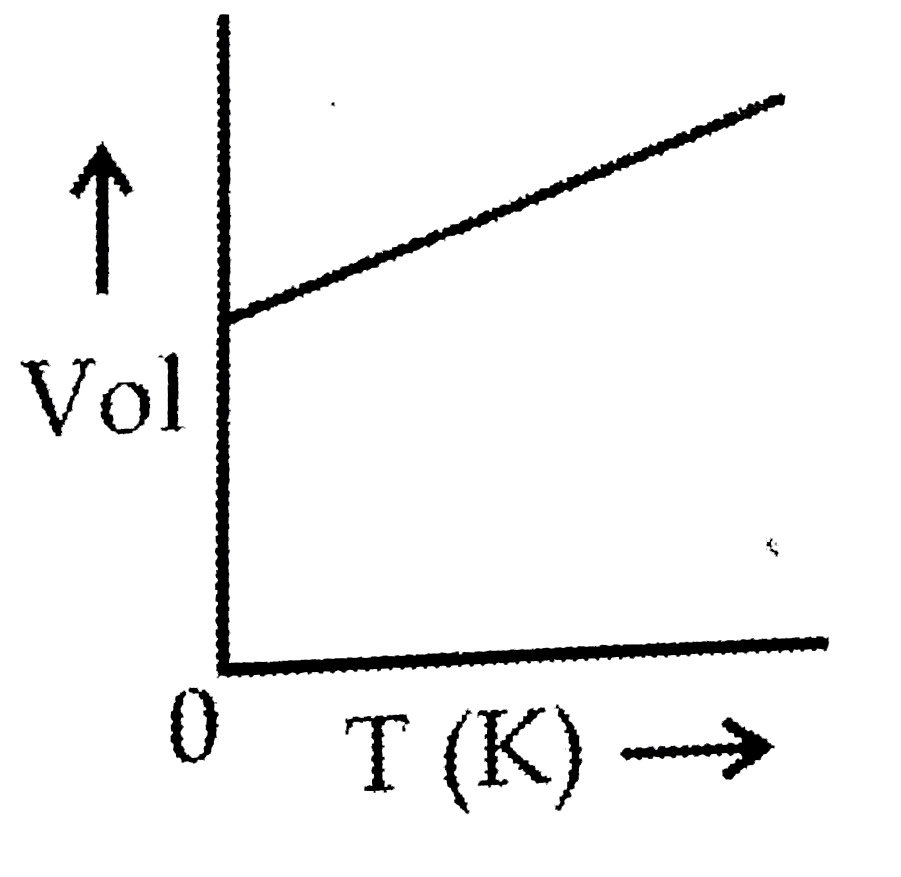 C
C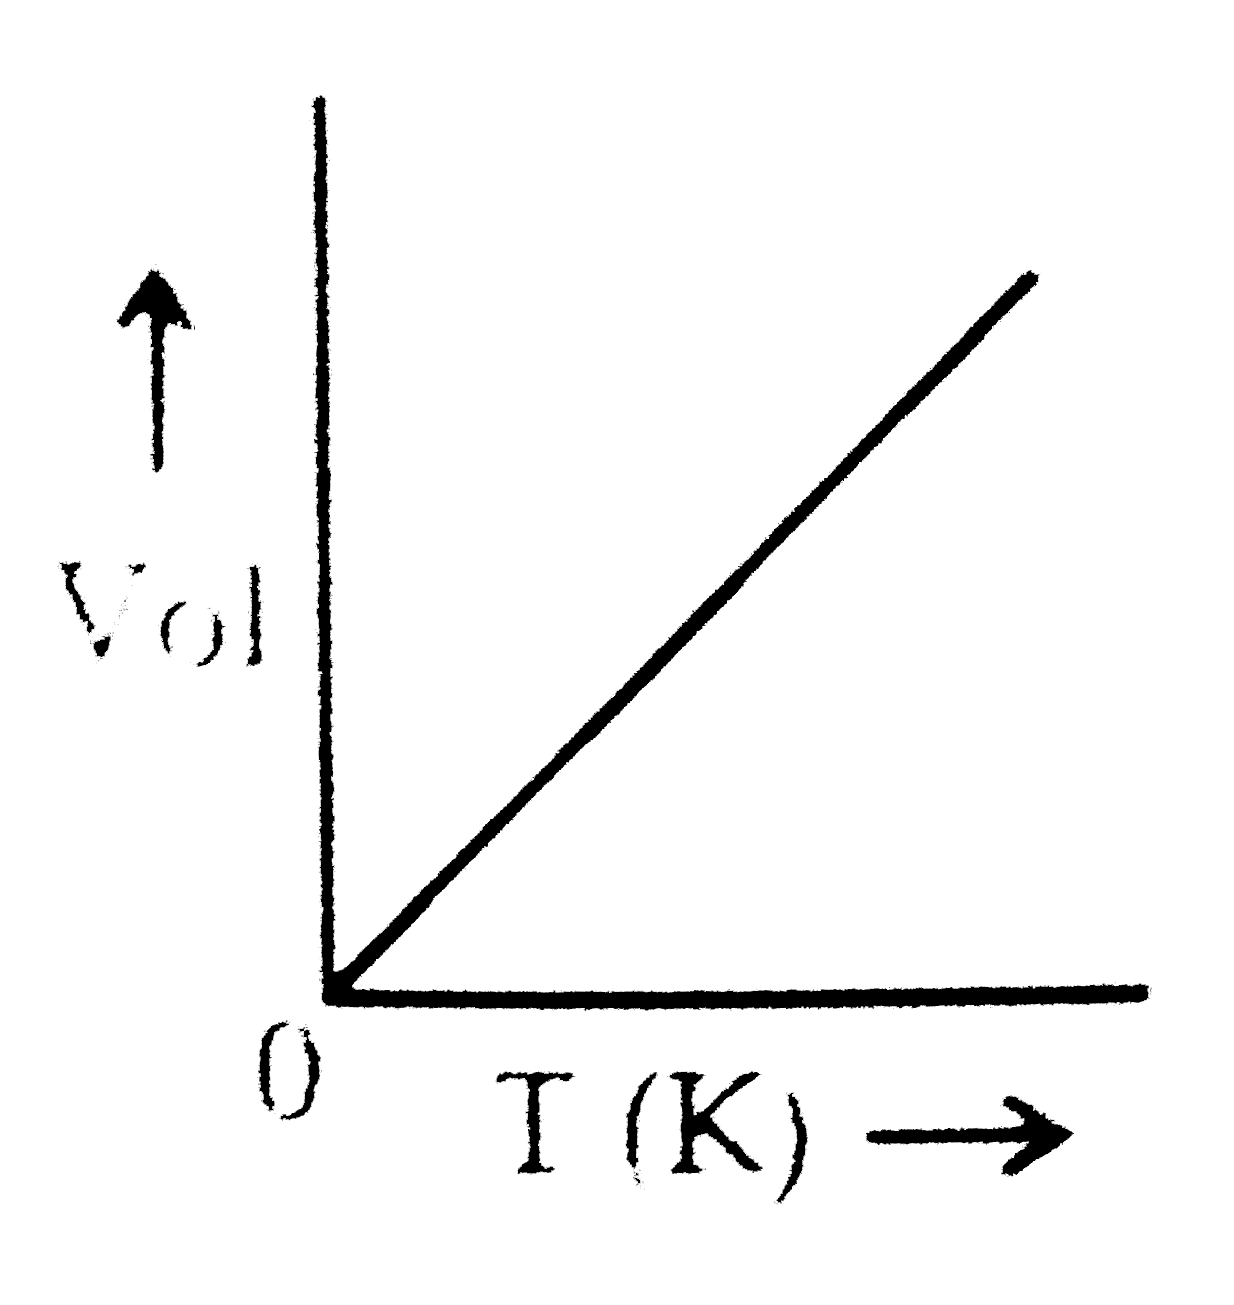 D
D
The correct representation of Charle's law is given in
A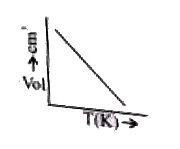 B
B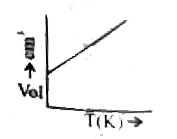 C
C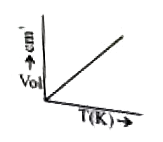 D
D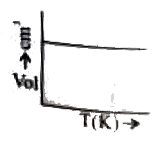
The correct representation of Charle's law is given in
View SolutionGive the graphical representation of Boyle.s law and Charles.s law .
View SolutionState Charles.s law
View SolutionChoose the correct option for graphical representation of Boyle's Law, which shows a graph of pressure vs volume of gas at different temperatures:
View SolutionThe correct representation of Charle's law is given in
View Solution
