Titration curve
Step by step video solution for Titration curve by Chemistry experts to help you in doubts & scoring excellent marks in Class 11 exams.
Updated on:21/07/2023Similar Questions
Knowledge Check
Which is/are correct statements ?
(P) In any strong acid's solution, the concentration of [OH−] will be zero.
(Q) If ΔG∘ of a reaction is positive, then the reaction will not proceed at all in the forward direction for any concentrations of reactants and products.
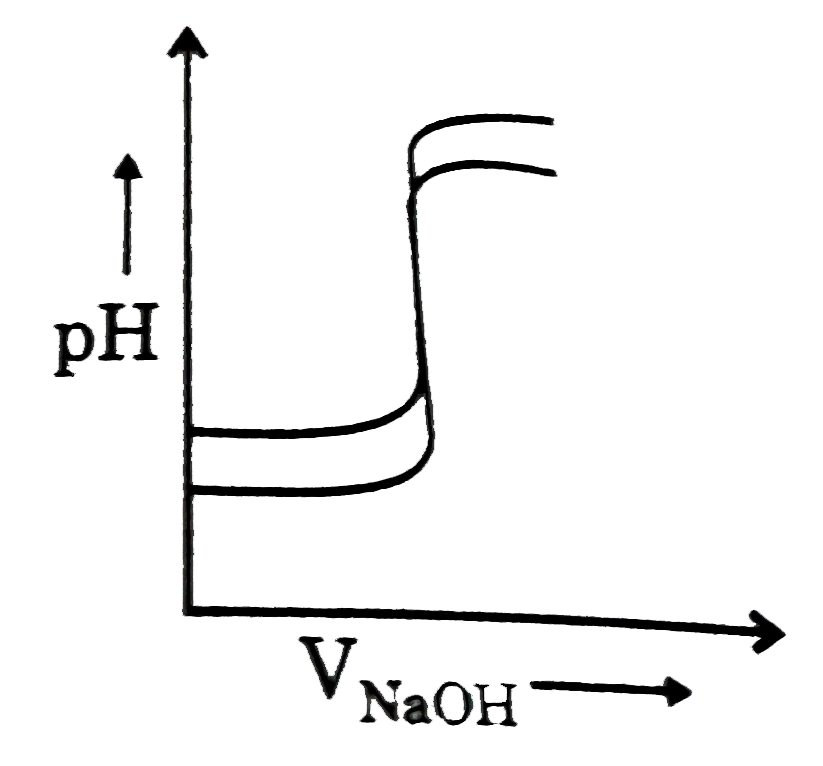
(R) Titration curves are drawn for (about the fig. shown)
(i) 1MHCI (50 mL) with 1MNaOH and
(ii) 0.01MHCI(50mL) with 0.01MNaOH on the same graph paper they look like:
 AP and QBR onlyCQ onlyDP and R
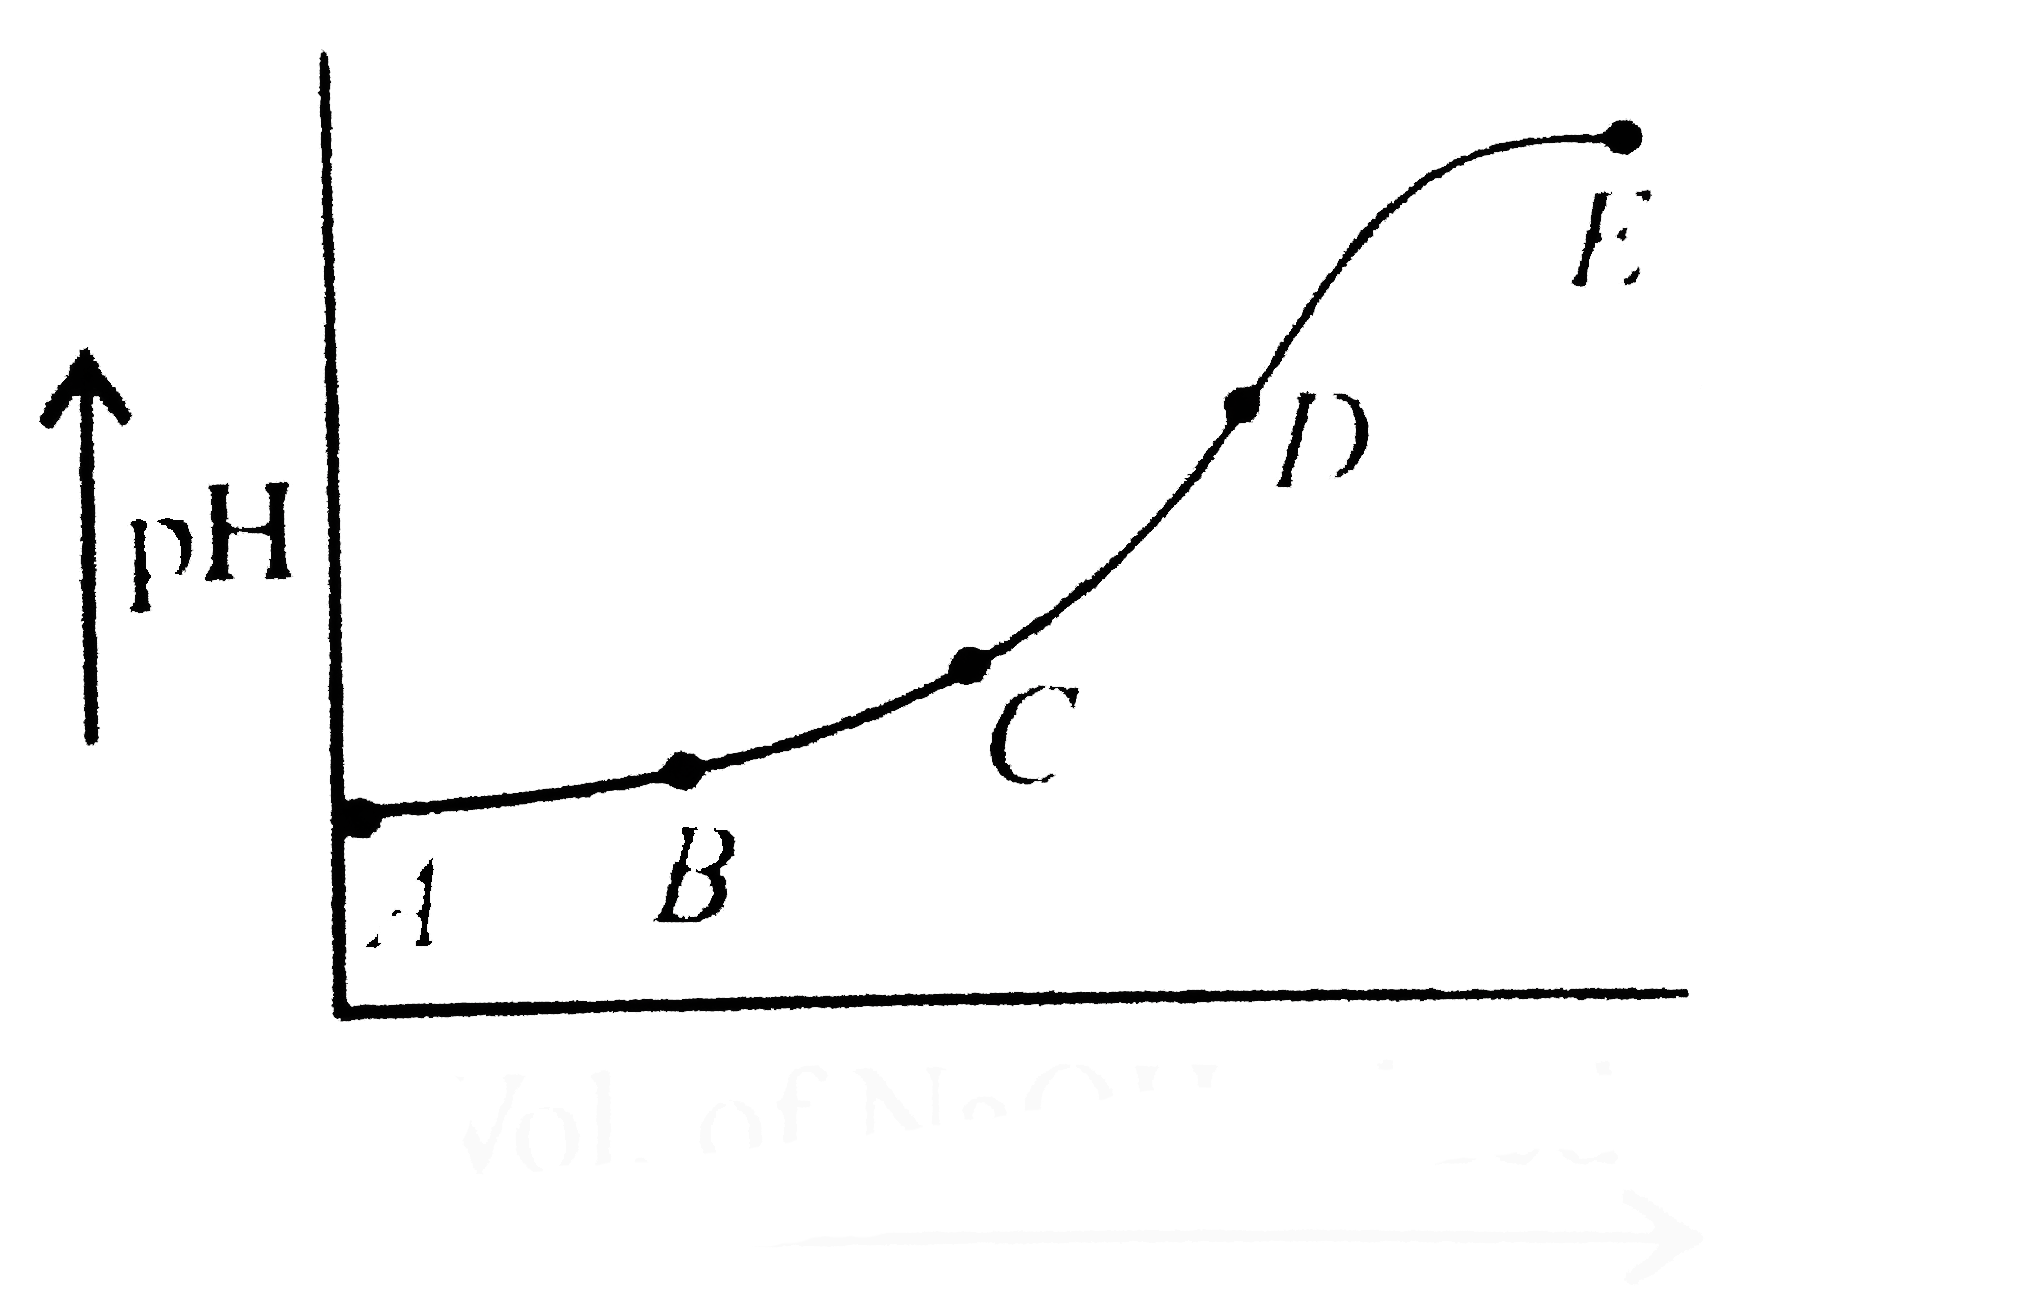
The following curve shows the change of pH during the course of titration of weak acid HA with a strong base. At which point in the titration curve is the concentration of acid equal to that of its conjugate base.
 APoint BBPoint CCPoint DDPoint E
Acidic solution is defined as a solution whose [H⊕]>[ΘOH]. Base solution has [ΘOH]>[H⊕]. During acid-base titrations, pH of the mixture will change depending on the amount base added. This variation is shown in the form of graph by making plot as titration curves 100mL of 1.0MH3A(Ka1=10−3,Ka2=10−5,Ka3=10−7) is titrated against 0.1MNaOh. The titration curve is as follows.
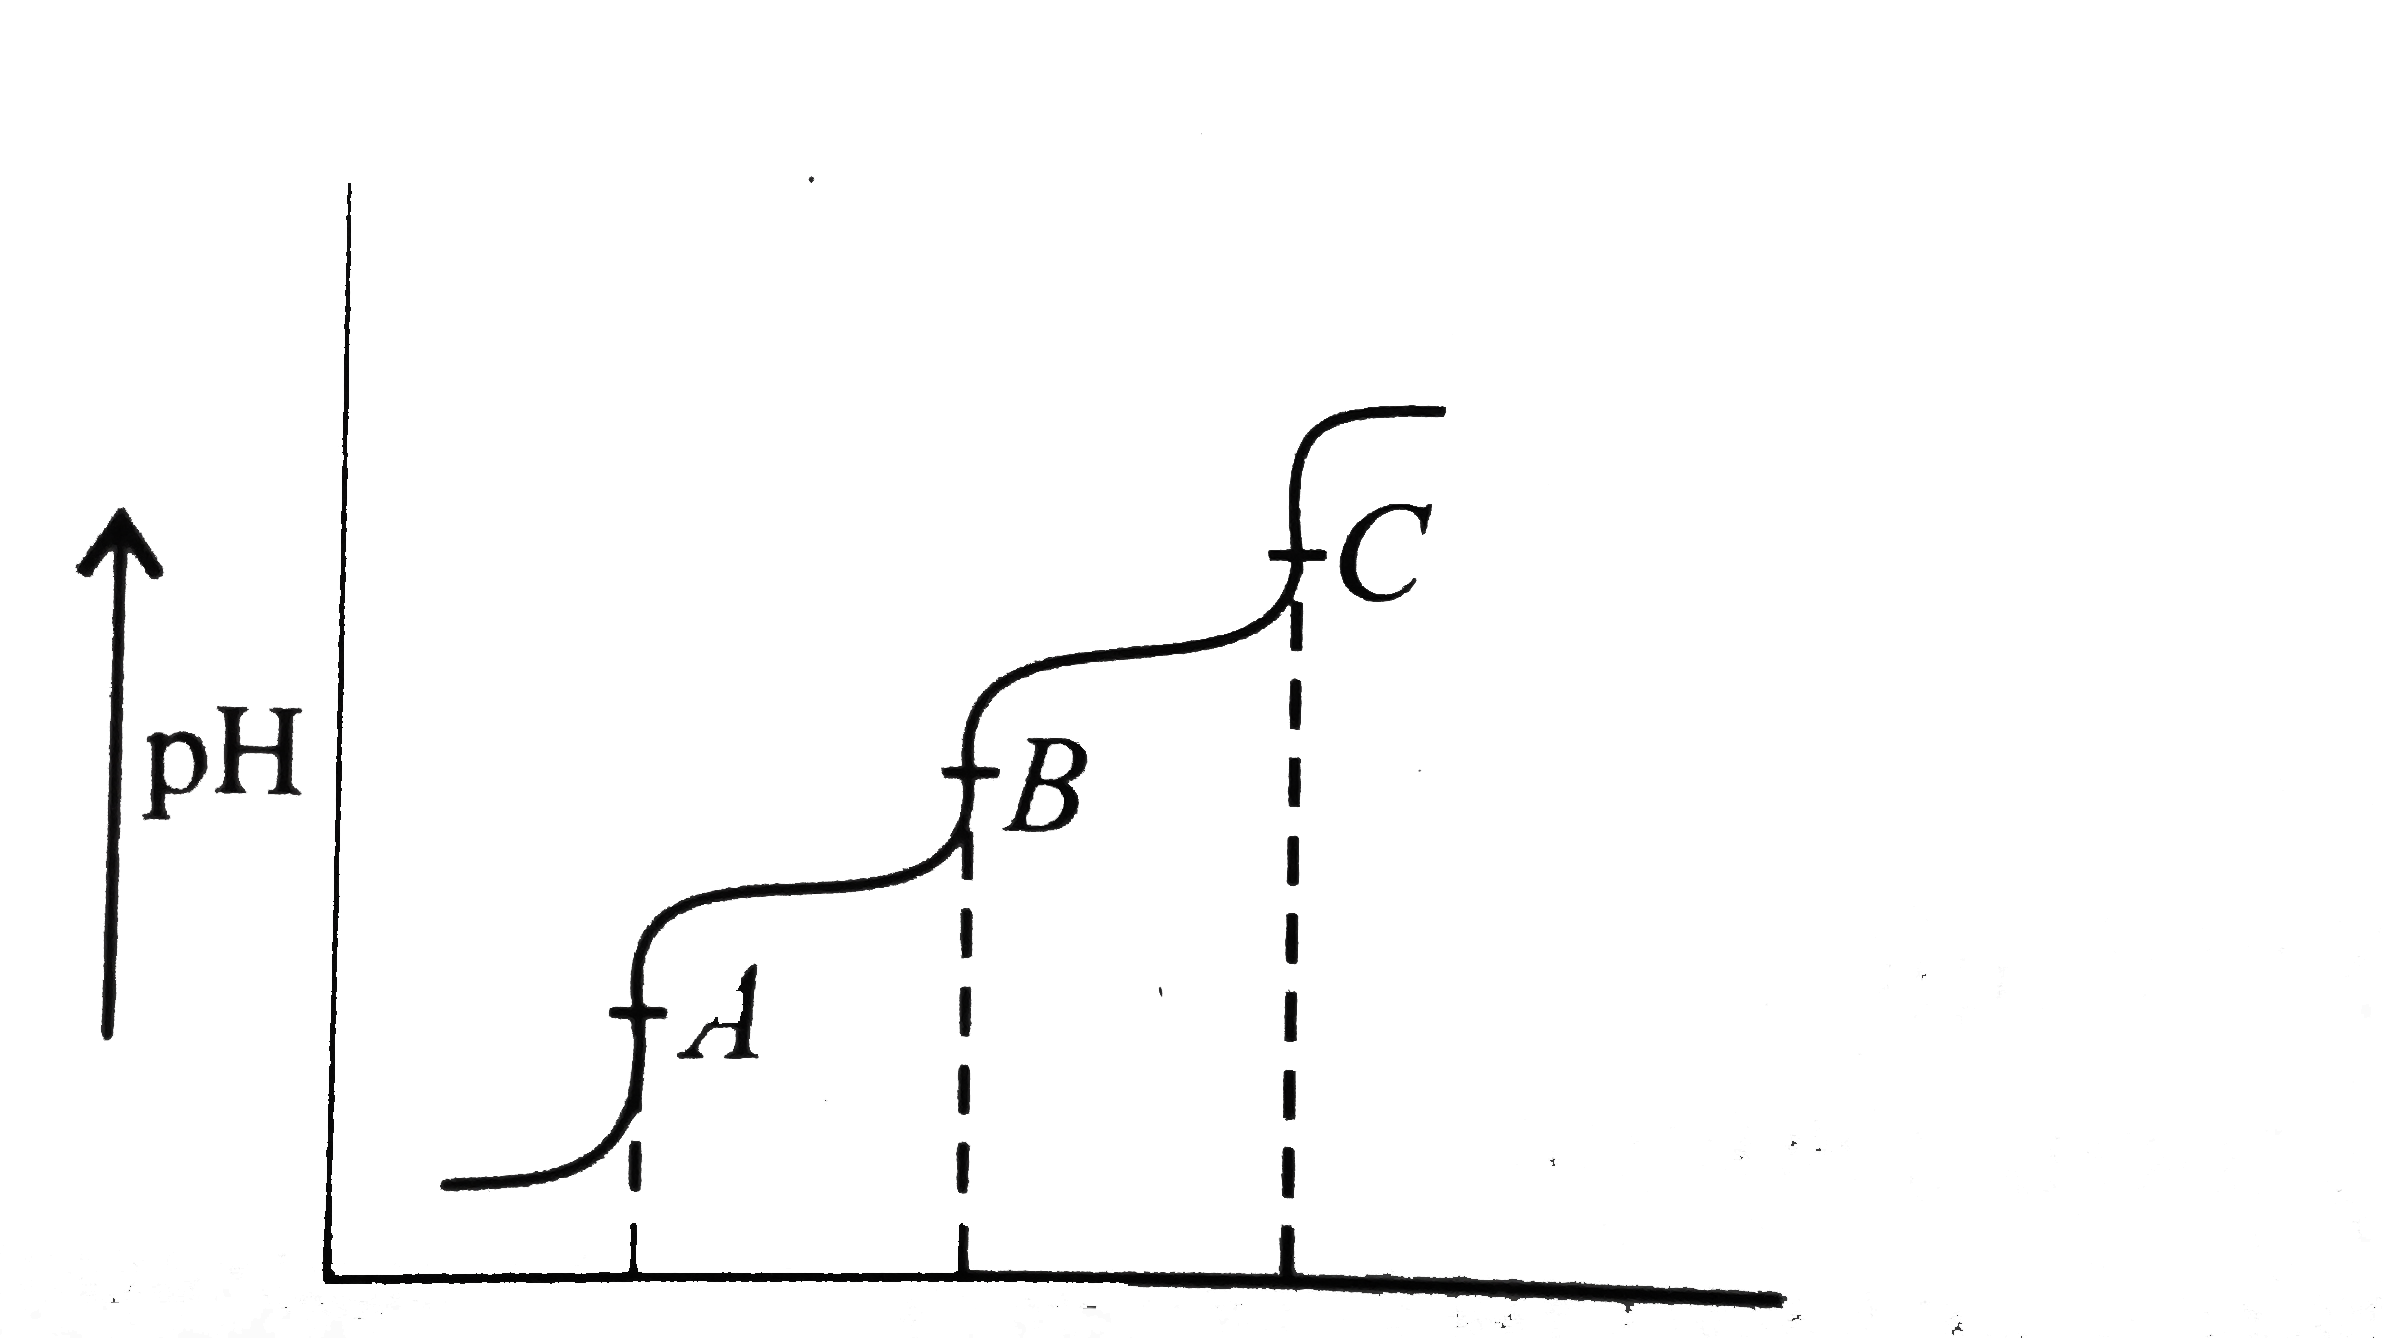
What would be the pH is more of NaH2A is added to the titration mixture at point C ?A11.0B10.2C9.7D7.7
Iodometric and Iodimetric Titration|| Back Titration
View SolutionTitration| Acid base titration| Concept of dilution| Concept of mixing
View SolutionAcidic solution is defined as a solution whose [H⊕]>[ΘOH]. Base solution has [ΘOH]>[H⊕]. During acid-base titrations, pH of the mixture will change depending on the amount base added. This variation is shown in the form of graph by making plot as titration curves 100mL of 1.0MH3A(Ka1=10−3,Ka2=10−5,Ka3=10−7) is titrated against 0.1MNaOh. The titration curve is as follows.
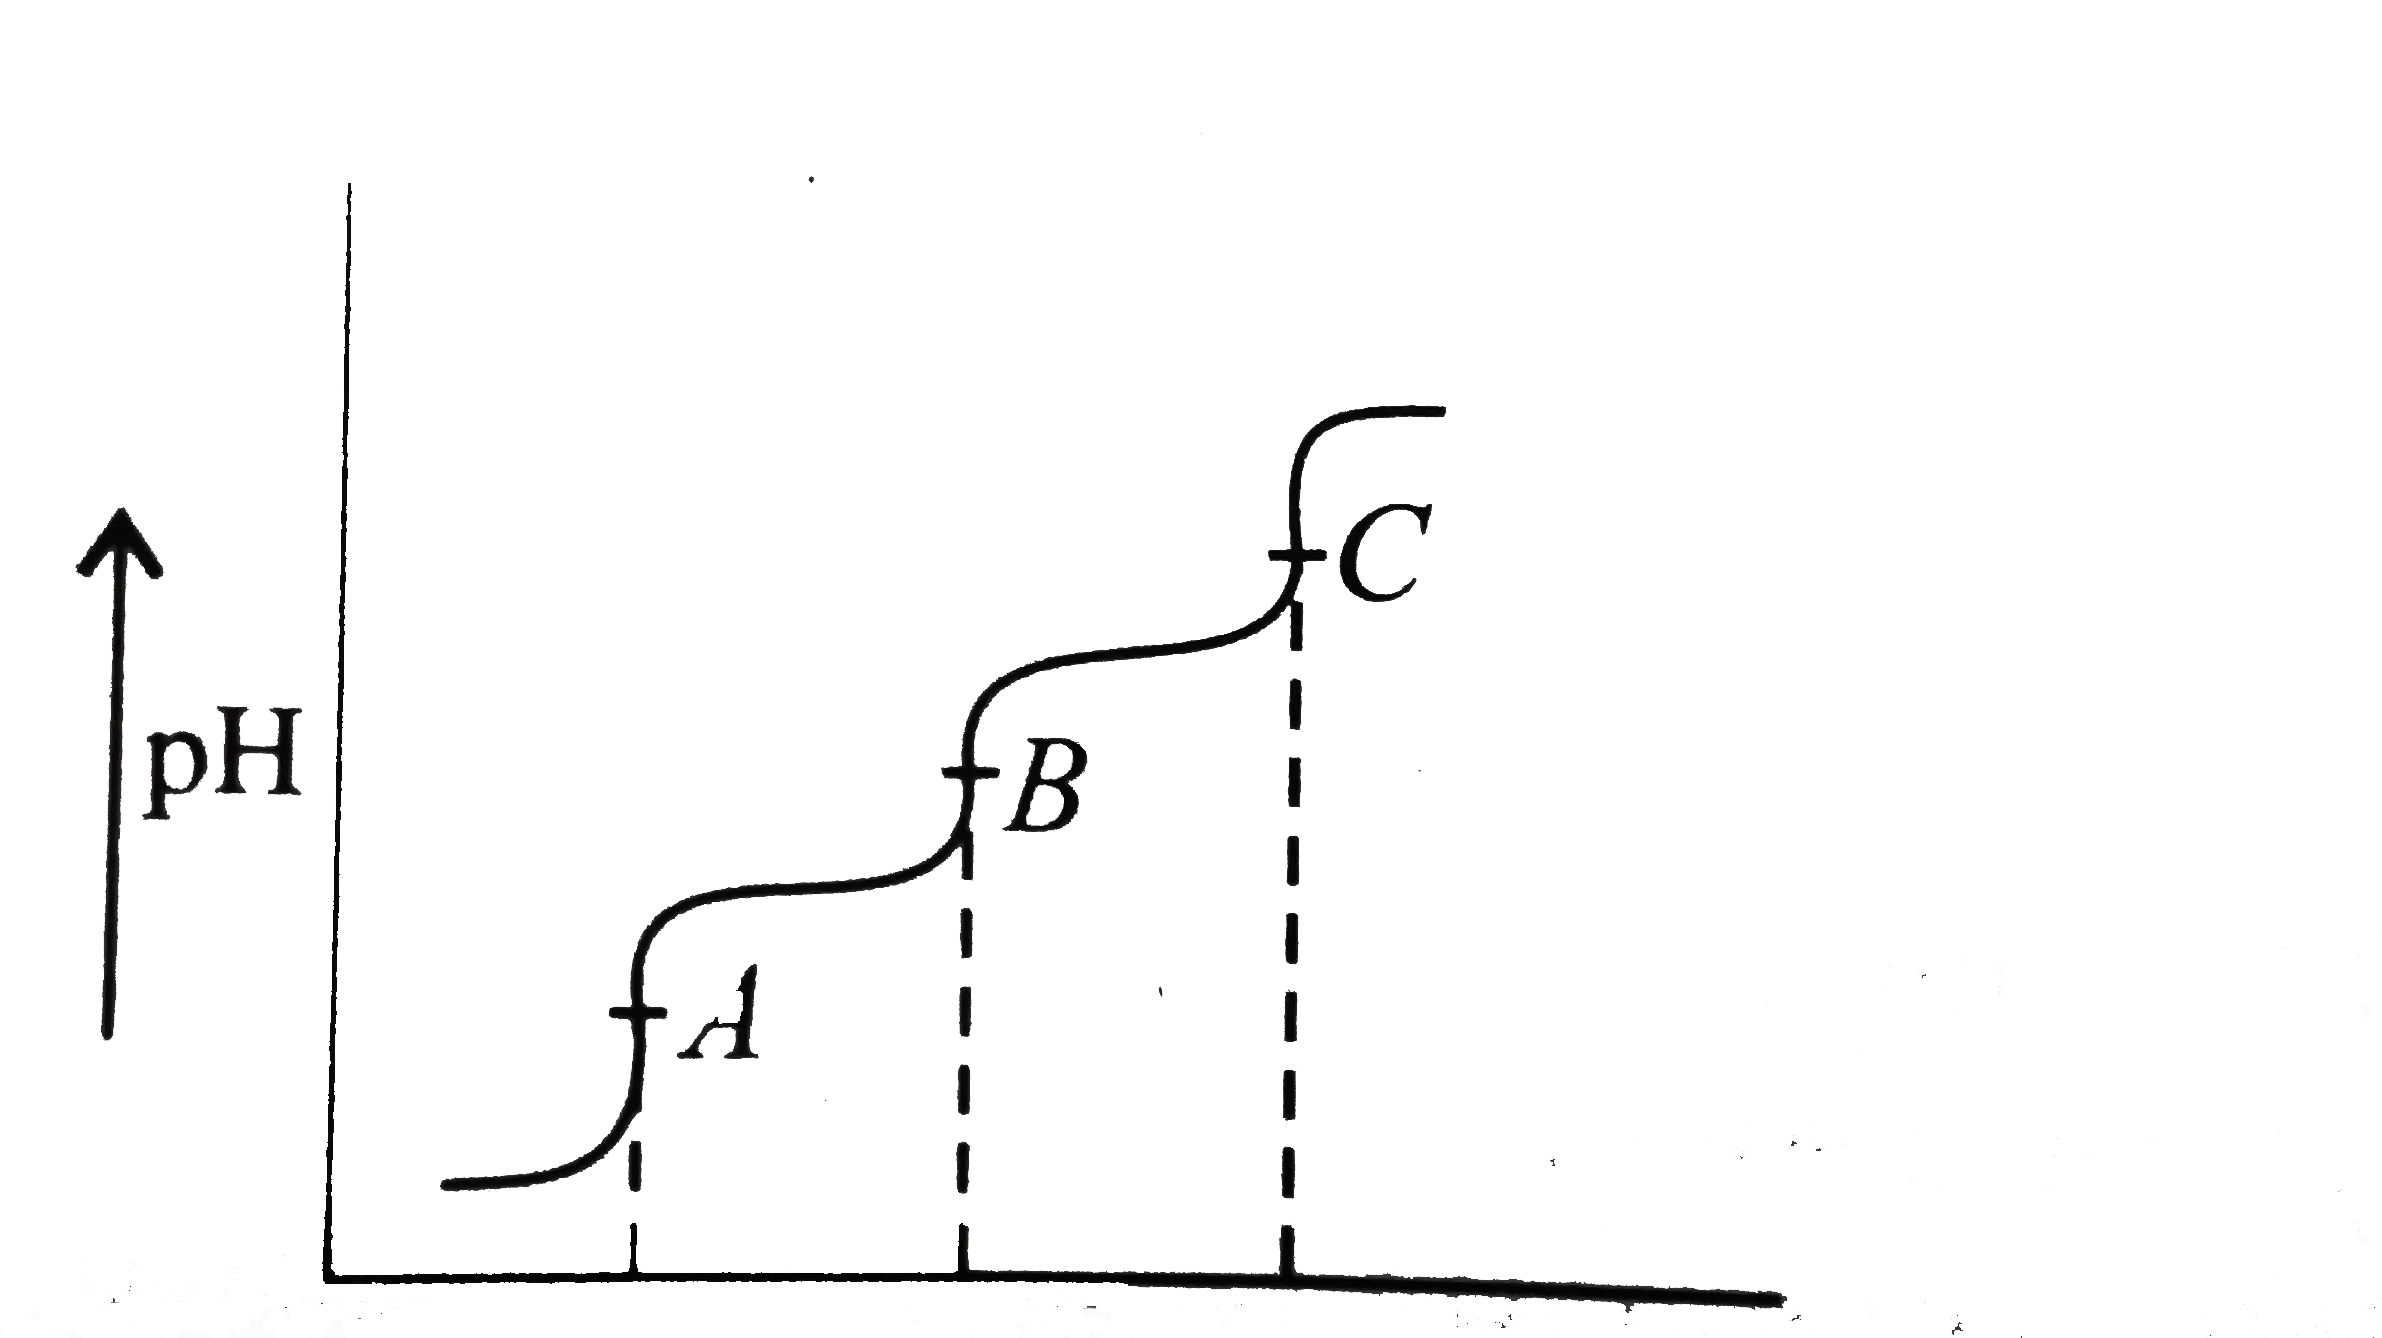
What will be the change in pH from point B to point C?
View SolutionAcidic solution is defined as a solution whose [H⊕]>[ΘOH]. Base solution has [ΘOH]>[H⊕]. During acid-base titrations, pH of the mixture will change depending on the amount base added. This variation is shown in the form of graph by making plot as titration curves 100mL of 1.0MH3A(Ka1=10−3,Ka2=10−5,Ka3=10−7) is titrated against 0.1MNaOh. The titration curve is as follows.
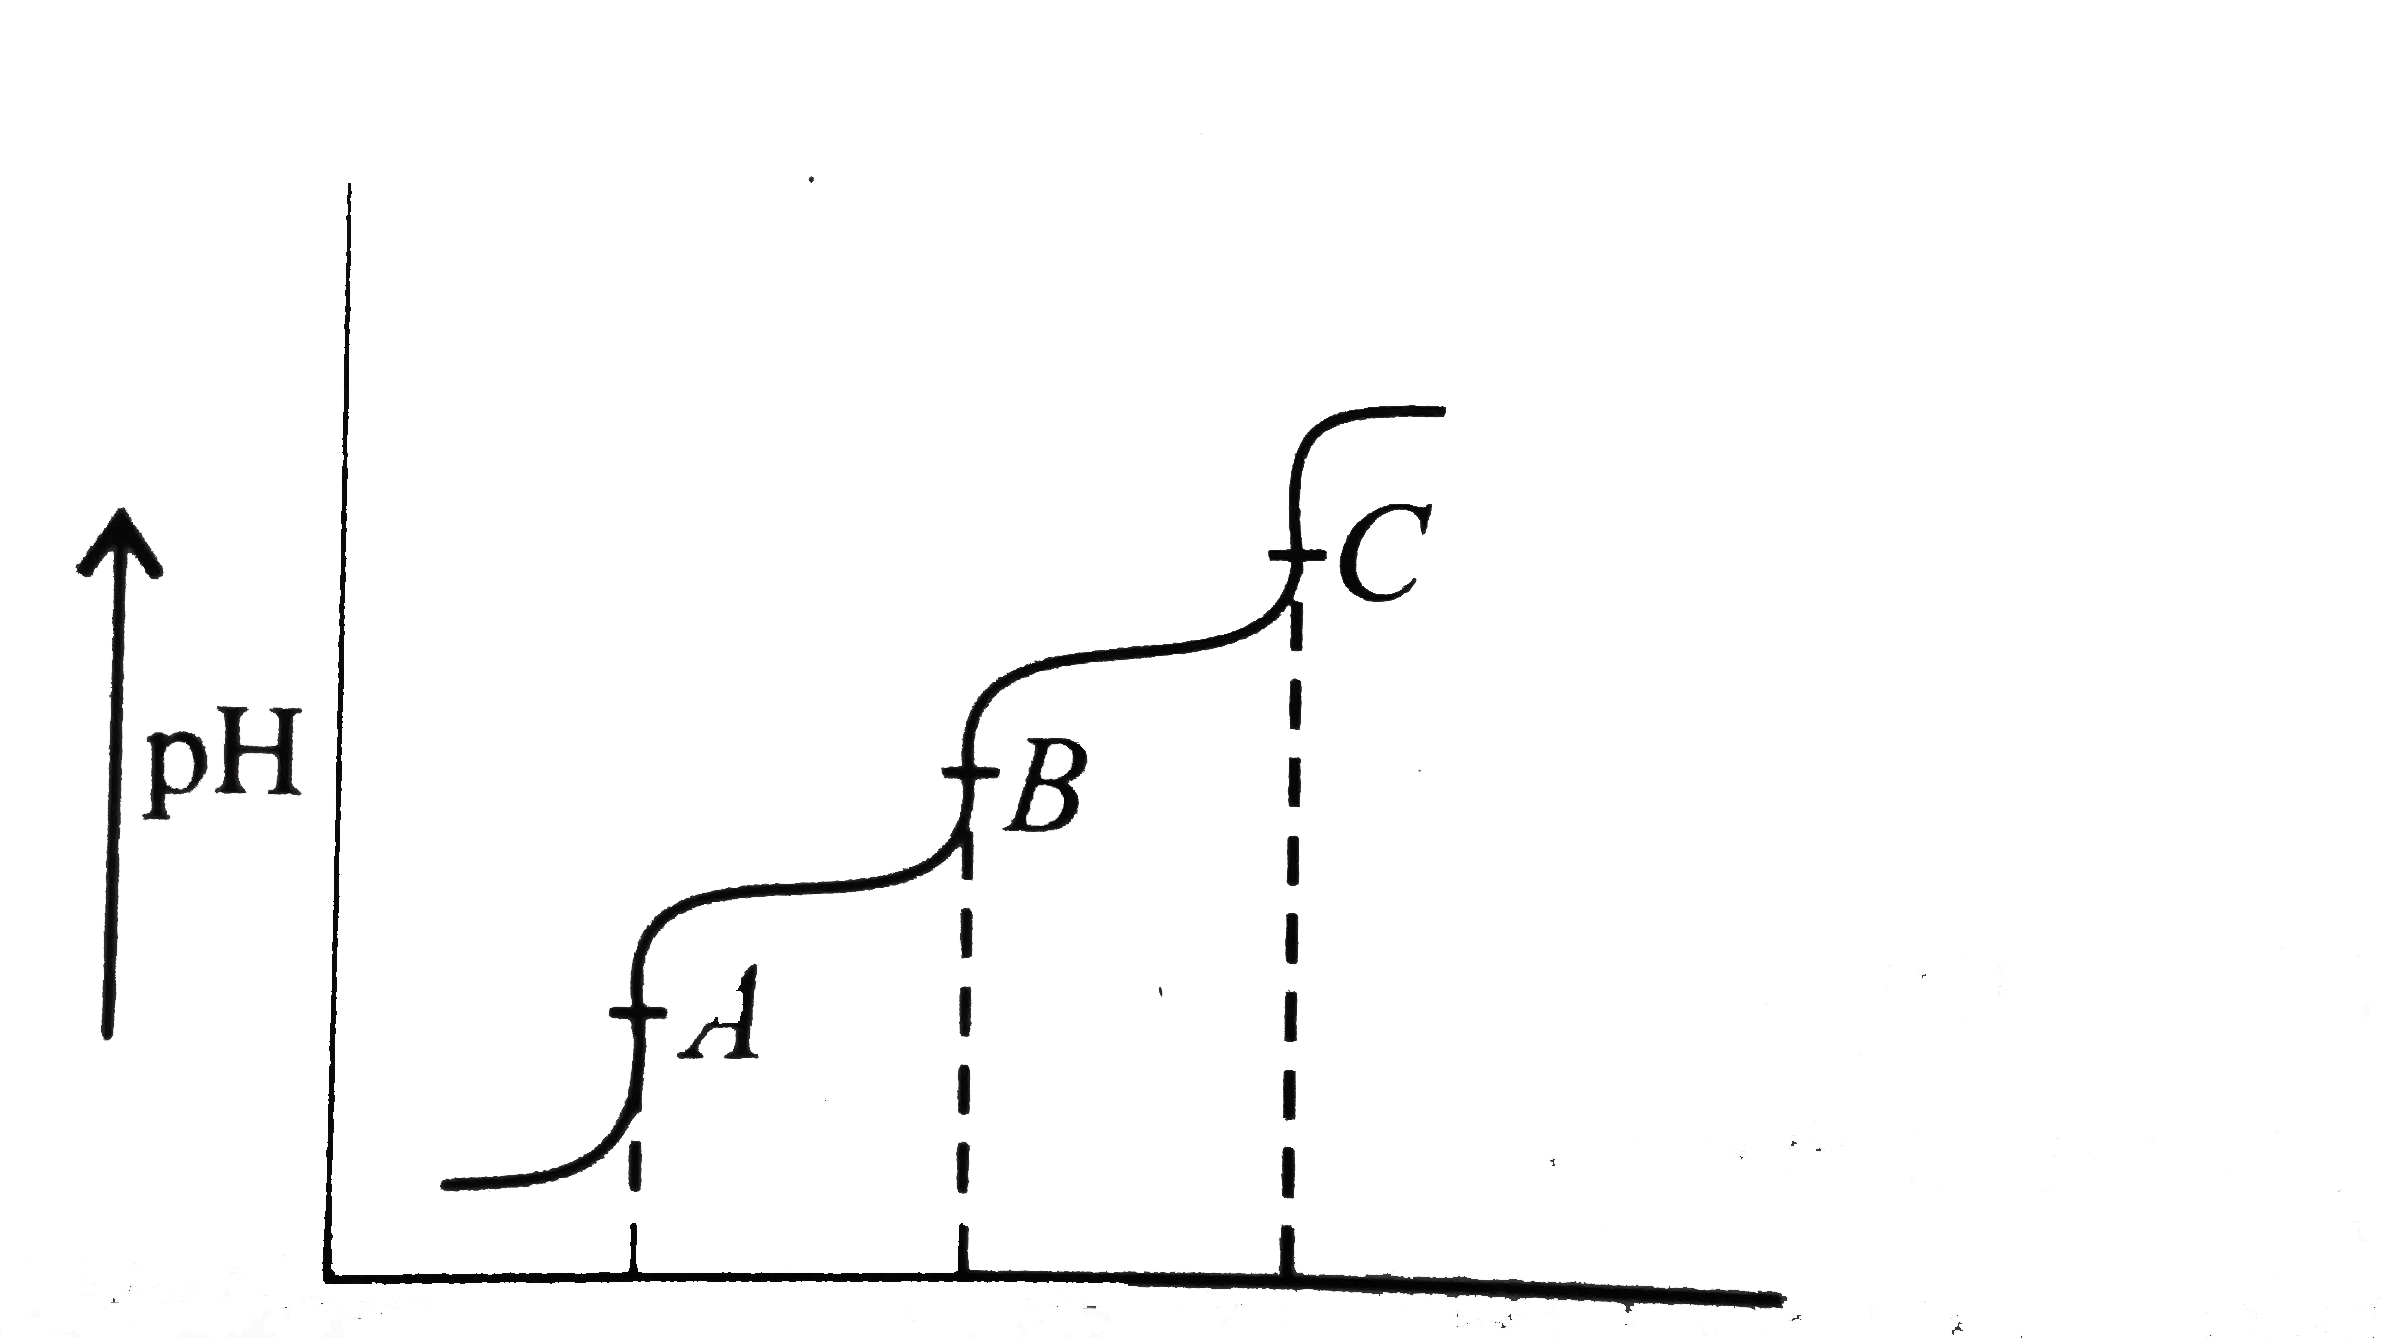
What is the pH at point A?
View SolutionIn iodometric titration which indicator is used to detect end point of titration reaction?
View Solution
