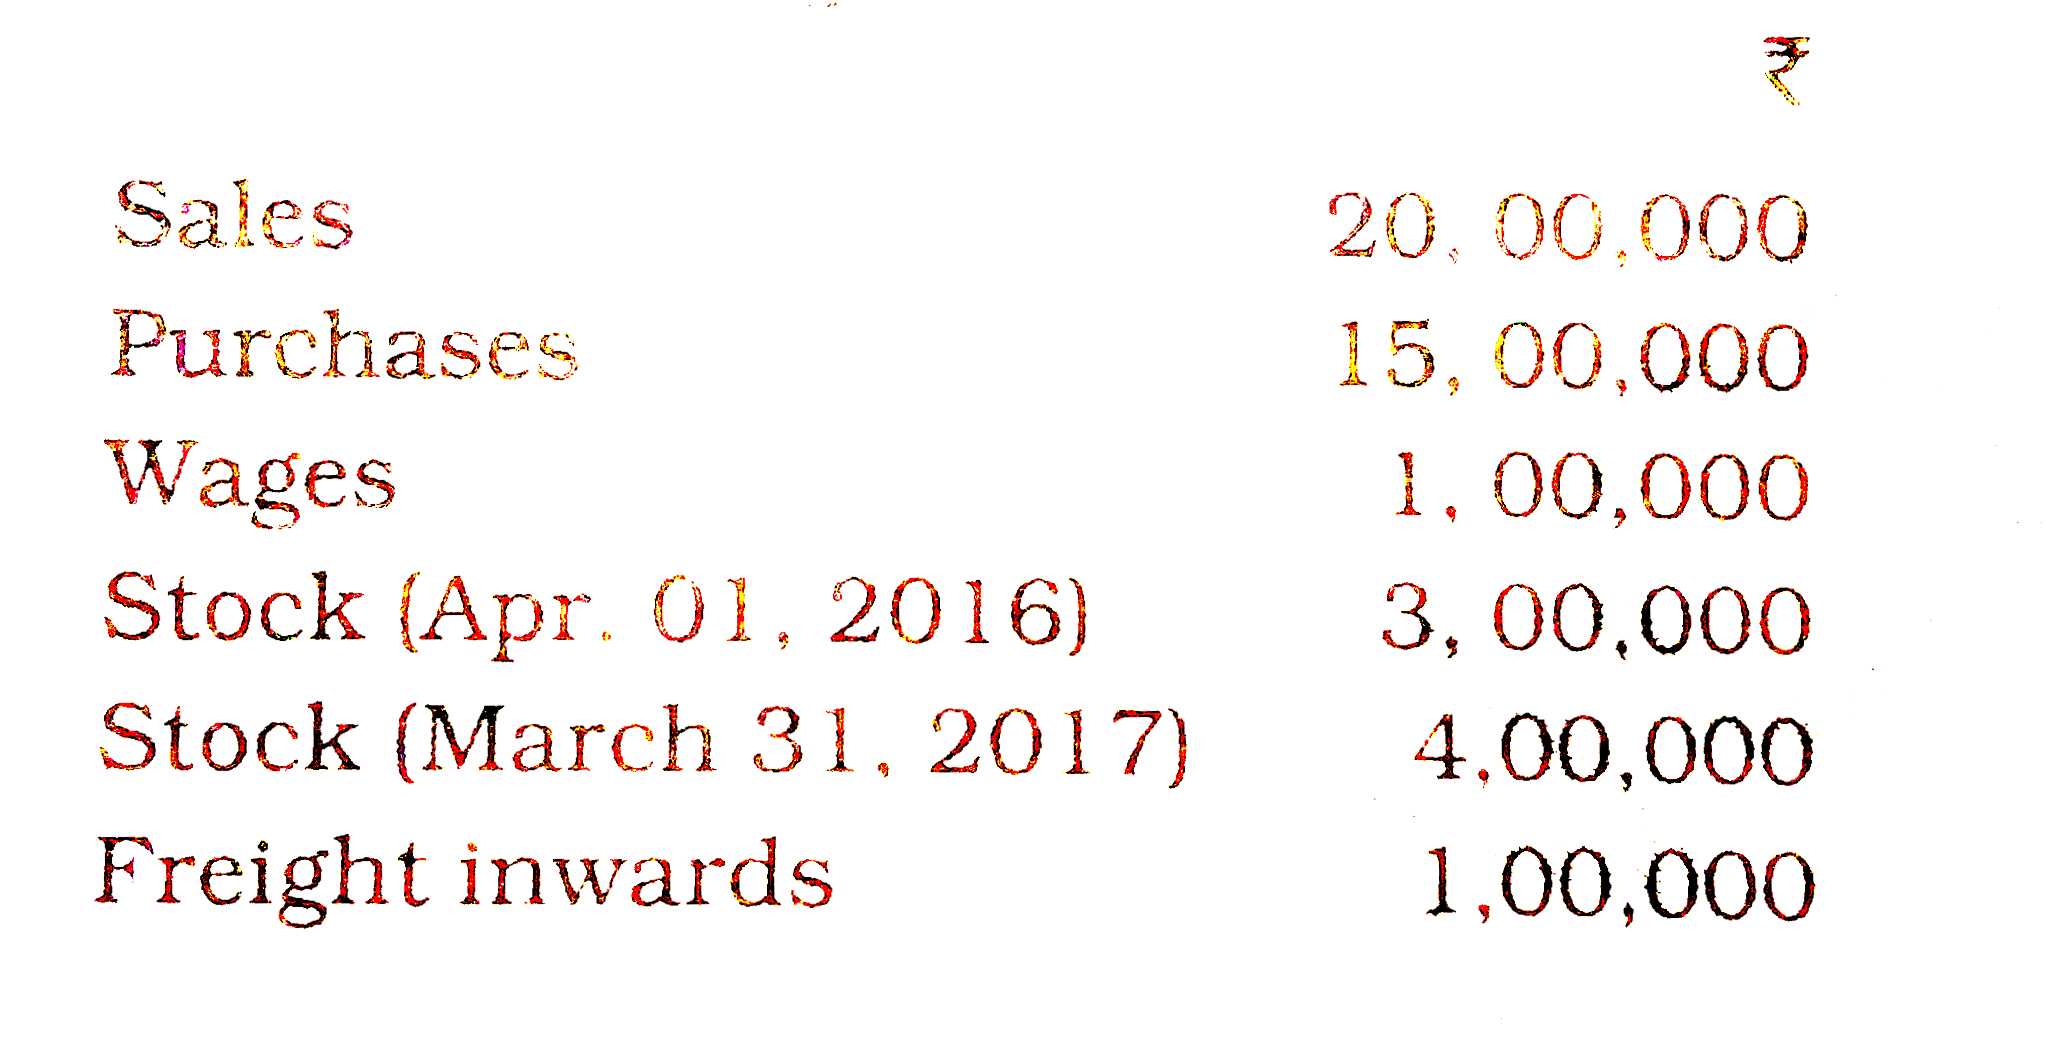
Suppose we have to prepare a price index number constituting three goods A, B and C. For the year 2008 and 2009. We are given the following information:


L=∑p1qopoqo×100=440380×100=116 approx.
P=∑p1q1poq1×100=490370×100=132 approx.
F=√L P=√116×132=124 approx.
Topper's Solved these Questions
- INDEX NUMBERSBook:SK AGGARWALAChapter:INDEX NUMBERSExercise:EXERCISES (MULTIPLE CHOICE QUESTIONS)
Explore 3 Videos
- INDEX NUMBERSBook:SK AGGARWALAChapter:INDEX NUMBERSExercise:EXERCISES (SHORT ANSWER QUESTIONS -I)
Explore 3 Videos
- FREQUENCY DISTRIBUTIONBook:SK AGGARWALAChapter:FREQUENCY DISTRIBUTIONExercise:Short answer II
Explore 3 Videos
- MEANING, SCOPE AND IMPORTANCE OF STATISTICS IN ECONOMICSBook:SK AGGARWALAChapter:MEANING, SCOPE AND IMPORTANCE OF STATISTICS IN ECONOMICSExercise:LONG ANSWER QUESTIONS
Explore 3 Videos
Similar Questions
Knowledge Check
We use price index numbers
ATo measure pricesBTo measure and compare prices,CTo measure quantityDNone of theseThe subjectwise number of applicants for the year 2008 and 2009 in a college is given in the following chart. Study the graph and answer the questions.
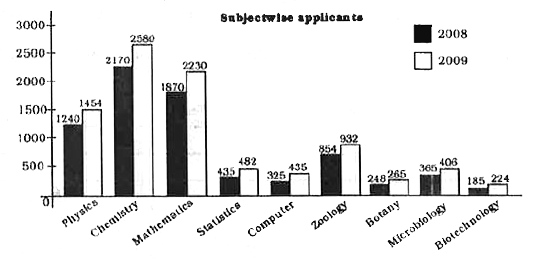
The number of Chemistry seeking applicants increased byA17.26%B18.89%C19.25%D21.08%The subjectwise number of applicants for the year 2008 and 2009 in a college is given in the following chart. Study the graph and answer the questions.
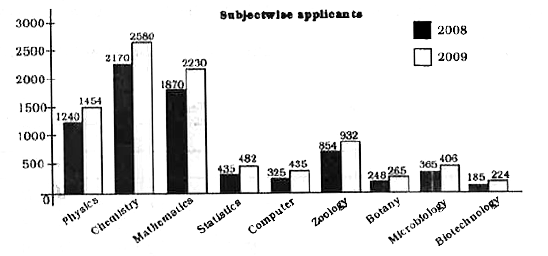
The number of Physics seeking applicants increased byA17.26%B18.89%C19.25%D21.08%
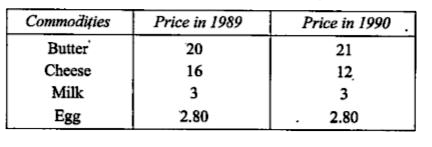
Construct the consumer price index number for 1990 taking 1989 as the base year and using simple average of price relative method for the following data:

View SolutionConstruct the consumer price index number for 1990, taking 1989 as the base year and using simple average of price relative method for the following data:
View SolutionThe subjectwise number of applicants for the year 2008 and 2009 in a college is given in the following chart. Study the graph and answer the questions.
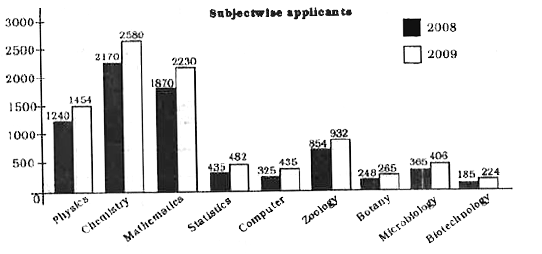
The number of Mathematics seeking applicants increased by
View SolutionThe subjectwise number of applicants for the year 2008 and 2009 in a college is given in the following chart. Study the graph and answer the questions.
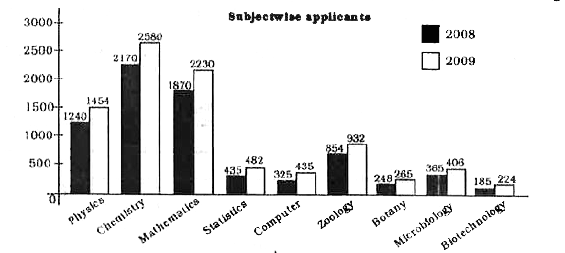
The subject for which growing of demand is maximum is
View SolutionThe subjectwise number of applicants for the year 2008 and 2009 in a college is given in the following chart. Study the graph and answer the questions.
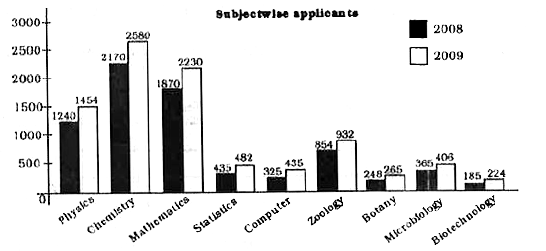
The subject for which growing of demand is minimum is
View Solution


