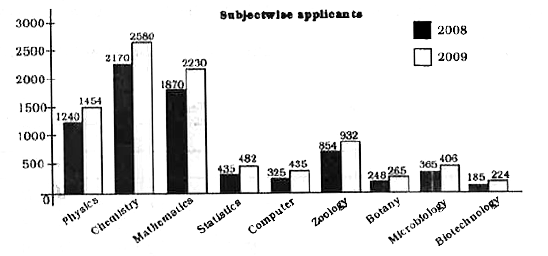
The subjectwise number of applicants for the year 2008 and 2009 in a college is given in the following chart. Study the graph and answer the questions.
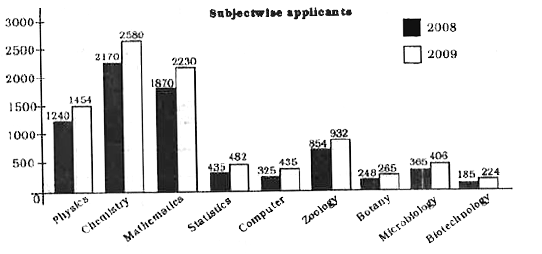
The number of Mathematics seeking applicants increased by
17.26%
18.89%
19.25%
21.08%
The correct Answer is:C
Step by step video, text & image solution for The subjectwise number of applicants for the year 2008 and 2009 in a college is given in the following chart. Study the graph and answer the questions. The number of Mathematics seeking applicants increased by by Maths experts to help you in doubts & scoring excellent marks in Class 14 exams.
Topper's Solved these Questions
- BOOK - KIRAN PUBLICATIONCHAPTER - STATISTICS AND DATA INTERPRETATIONEXERCISE - TYPE-V38videos
STATISTICS AND DATA INTERPRETATION
- BOOK - KIRAN PUBLICATIONCHAPTER - STATISTICS AND DATA INTERPRETATIONEXERCISE - TYPE-VI86videos
STATISTICS AND DATA INTERPRETATION
- BOOK - KIRAN PUBLICATIONCHAPTER - STATISTICS AND DATA INTERPRETATIONEXERCISE - TYPE-III39videos
STATISTICS AND DATA INTERPRETATION
- BOOK - KIRAN PUBLICATIONCHAPTER - SIMPLIFICATIONEXERCISE - TEST YOURSELF25videos
SIMPLIFICATION
- BOOK - KIRAN PUBLICATIONCHAPTER - TIME AND DISTANCEEXERCISE - Type -XI74videos
TIME AND DISTANCE
Similar Questions
The graph shows Income and Expenditure of a company. Study the graph and answer the questions.
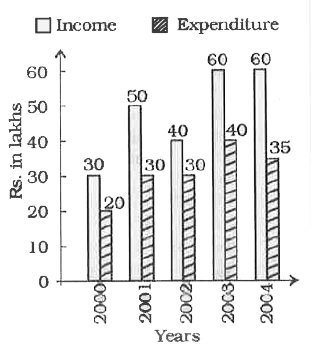
The number of years in which the income exceeds the average income isView SolutionThe sub-divided bar diagram given below depicts the result of B.Com. Students of a college for 3 years. Study the graph and answer the given questions.
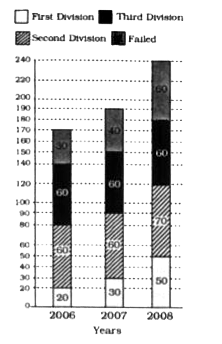
What was the number of third divisions in 2006 ?View Solution
Knowledge Check
- Question 1 - Select One
The subjectwise number of applicants for the year 2008 and 2009 in a college is given in the following chart. Study the graph and answer the questions.
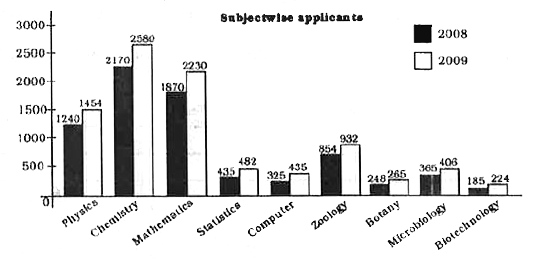
The number of Chemistry seeking applicants increased byA17.26%B18.89%C19.25%D21.08% - Question 2 - Select One
The subjectwise number of applicants for the year 2008 and 2009 in a college is given in the following chart. Study the graph and answer the questions.
The number of Physics seeking applicants increased byA17.26%B18.89%C19.25%D21.08% - Question 3 - Select One
The subjectwise number of applicants for the year 2008 and 2009 in a college is given in the following chart. Study the graph and answer the questions.
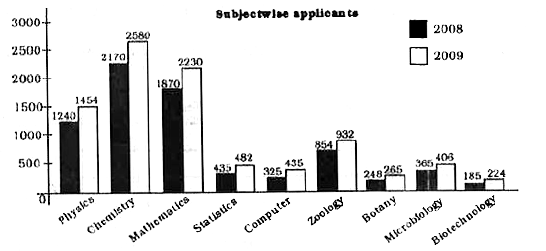
The subject for which growing of demand is minimum isAStatisticsBZoologyCBotanyDMicrobiology
The following graph below shows the number of students (in thousands) who were admitted to three different courses in 5 years in a university. Study the graph and answer the question.
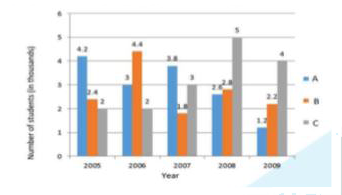
What is the ratio of the number of students who were admitted to course A in the year 2007 to that of students who were admitted to course C in the year 2009?View SolutionThe following bar graph shows the number of students (in hundreds) who have opted for different courses A, B, C and D in 3 years in a college. Study the graph and answer the question.
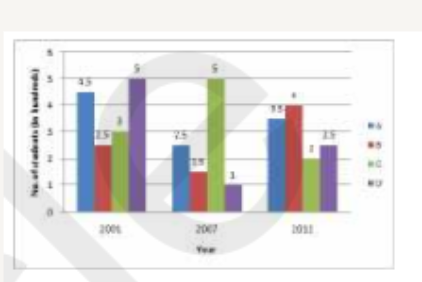 What is the ratio of the number of students who were admitted to course A in the year 2007 to that
of students who were admitted to course C in the year 2012? View Solution
What is the ratio of the number of students who were admitted to course A in the year 2007 to that
of students who were admitted to course C in the year 2012? View SolutionStudy the following bar graph and answer the questions given below.
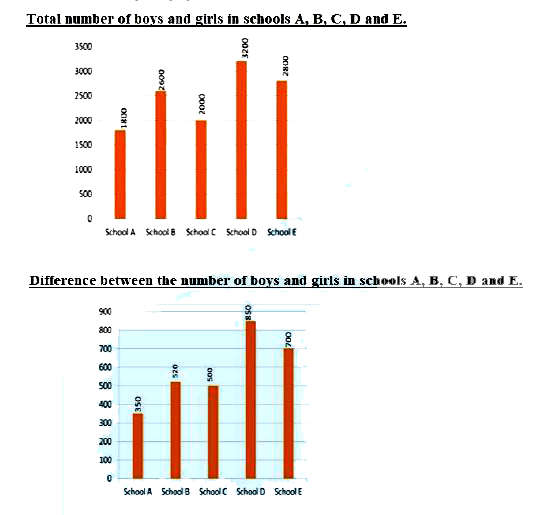
What is the ratio of numbers of boys to the number of girls in school E?View SolutionThe subjectwise number of applicants for the year 2008 and 2009 in a college is given in the following chart. Study the graph and answer the questions.
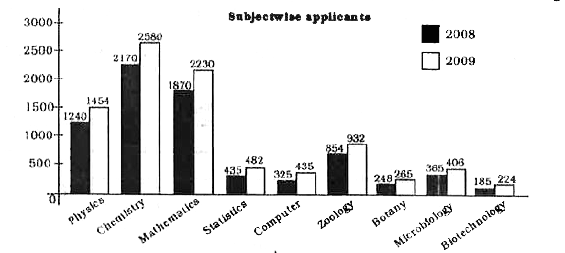
The subject for which growing of demand is maximum isView SolutionThe bar graph shows the number of students (in hundreds) admitted and passed out per year in a college during the years 2010 to 2014.
Study the bar graph and answer the question.
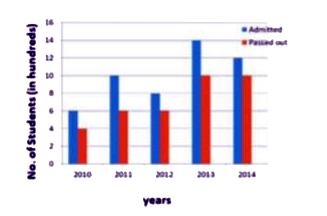
The ratio of the number of students admitted in the year 2012 to the average number of students passed out inthe years 2013 and 2014 isView Solution

