The subjectwise number of applicants for the year 2008 and 2009 in a college is given in the following chart. Study the graph and answer the questions.
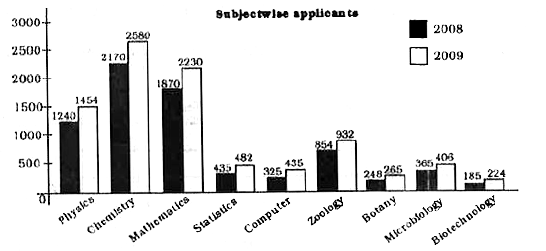
The subject for which growing of demand is minimum is
Statistics
Zoology
Botany
Microbiology
The correct Answer is:C
Step by step video, text & image solution for The subjectwise number of applicants for the year 2008 and 2009 in a college is given in the following chart. Study the graph and answer the questions. The subject for which growing of demand is minimum is by Maths experts to help you in doubts & scoring excellent marks in Class 14 exams.
Topper's Solved these Questions
- BOOK - KIRAN PUBLICATIONCHAPTER - STATISTICS AND DATA INTERPRETATIONEXERCISE - TYPE-V38videos
STATISTICS AND DATA INTERPRETATION
- BOOK - KIRAN PUBLICATIONCHAPTER - STATISTICS AND DATA INTERPRETATIONEXERCISE - TYPE-VI86videos
STATISTICS AND DATA INTERPRETATION
- BOOK - KIRAN PUBLICATIONCHAPTER - STATISTICS AND DATA INTERPRETATIONEXERCISE - TYPE-III39videos
STATISTICS AND DATA INTERPRETATION
- BOOK - KIRAN PUBLICATIONCHAPTER - SIMPLIFICATIONEXERCISE - TEST YOURSELF25videos
SIMPLIFICATION
- BOOK - KIRAN PUBLICATIONCHAPTER - TIME AND DISTANCEEXERCISE - Type -XI74videos
TIME AND DISTANCE
Similar Questions
Knowledge Check
- Question 1 - Select One
The subjectwise number of applicants for the year 2008 and 2009 in a college is given in the following chart. Study the graph and answer the questions.
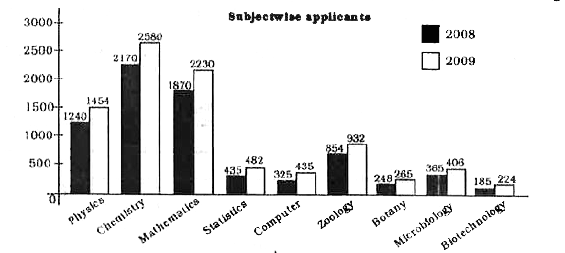
The subject for which growing of demand is maximum isAChemistryBMathematicsCComputerDBiotechnology - Question 2 - Select One
The subjectwise number of applicants for the year 2008 and 2009 in a college is given in the following chart. Study the graph and answer the questions.
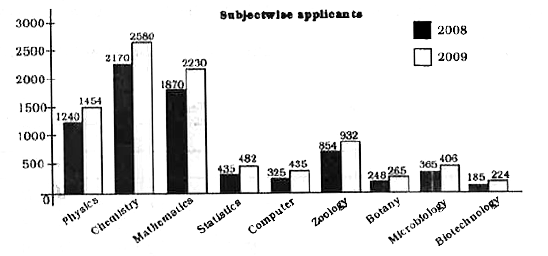
The number of Physics seeking applicants increased byA17.26%B18.89%C19.25%D21.08% - Question 3 - Select One
The subjectwise number of applicants for the year 2008 and 2009 in a college is given in the following chart. Study the graph and answer the questions.
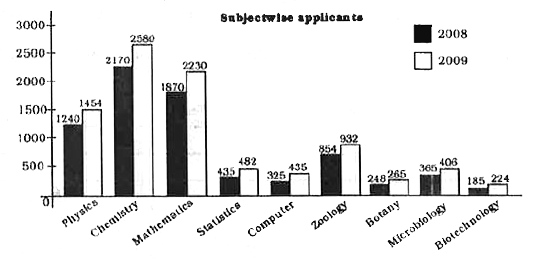
The number of Chemistry seeking applicants increased byA17.26%B18.89%C19.25%D21.08%
Study the given pedigree chart and answer the given questions :-
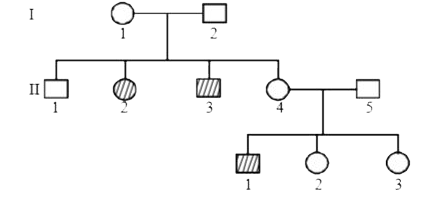 View Solution
Study the given pedigree chart and answer the given questions :-
 View Solution
The subjectwise number of applicants for the year 2008 and 2009 in a college is given in the following chart. Study the graph and answer the questions.
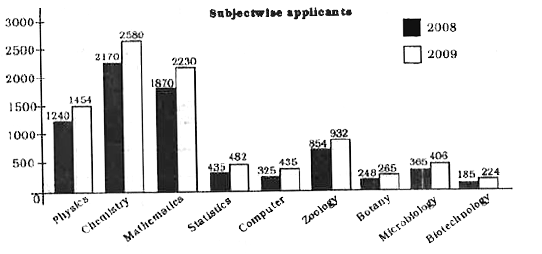
The number of Mathematics seeking applicants increased byView SolutionStudy the graph and answer the questions.
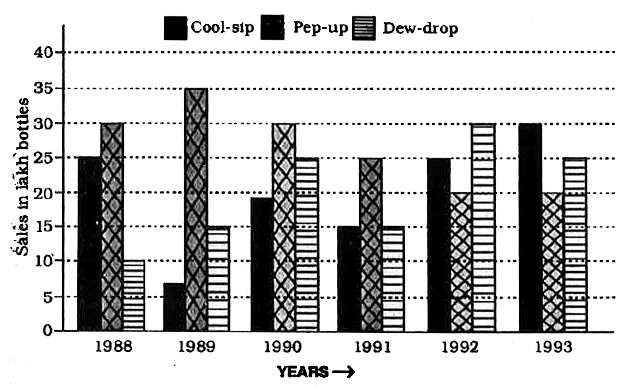
In which year the sale of cool-sip is minimum ?View SolutionThe data given in Bar diagram relate to the department wise admission of 320 students to B.Sc. (Honours) first year classes of a certain college in the given five subjetcs. Study the graph and answer the questions.
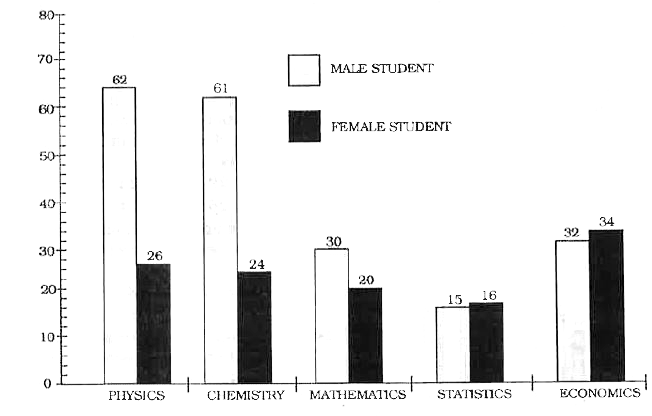
The subject in which the difference in the number of male and female students is minimum in :View Solution


