Three metals have work function in the ratio 2:3:4 Graphs are drawn for all between the stopping potential and the incident frequency The graphs have slopes in the ratio
2:3:4
4:3:2
6:4:3
1:1:1
The correct Answer is:D
Step by step video, text & image solution for Three metals have work function in the ratio 2:3:4 Graphs are drawn for all between the stopping potential and the incident frequency The graphs have slopes in the ratio by Physics experts to help you in doubts & scoring excellent marks in Class 12 exams.
Topper's Solved these Questions
- BOOK - NARAYNACHAPTER - DUAL NATURE OF RADIATION AND MATTEREXERCISE - EXERCISE - 1 (C.W)40videos
DUAL NATURE OF RADIATION AND MATTER
- BOOK - NARAYNACHAPTER - DUAL NATURE OF RADIATION AND MATTEREXERCISE - EXERCISE - 1 (H.W)24videos
DUAL NATURE OF RADIATION AND MATTER
- BOOK - NARAYNACHAPTER - DUAL NATURE OF RADIATION AND MATTEREXERCISE - EVALUTATE YOURSELF - 45videos
DUAL NATURE OF RADIATION AND MATTER
- BOOK - NARAYNACHAPTER - CURRENT ELECTRICITYEXERCISE - Level 643videos
CURRENT ELECTRICITY
- BOOK - NARAYNACHAPTER - DUAL NATUREEXERCISE - LEVEL-II (H.W)17videos
DUAL NATURE
Similar Questions
Knowledge Check
- Question 1 - Select One
In a photoelectric effect experiment, the slope of the graph between the stopping potential and the incident frequency will be :
A1B0.5C10−15D10−34 - Question 2 - Select One
In a photoelectric effect experiment, the slope of the graph between the stopping potential and the incident frequency will be :
A1B0.5C10−15D10−34 - Question 3 - Select One
In photoelectric effect the slope of stop of stopping potential versus frequency of incident light for a given surface will be
A10−14B5×10−14C4×10−15D4×10−34
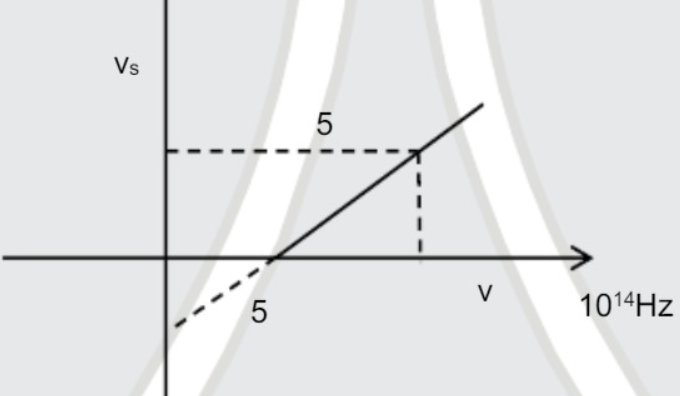
Graph between stopping potential and frequency of light as shown find the work function
 View Solution
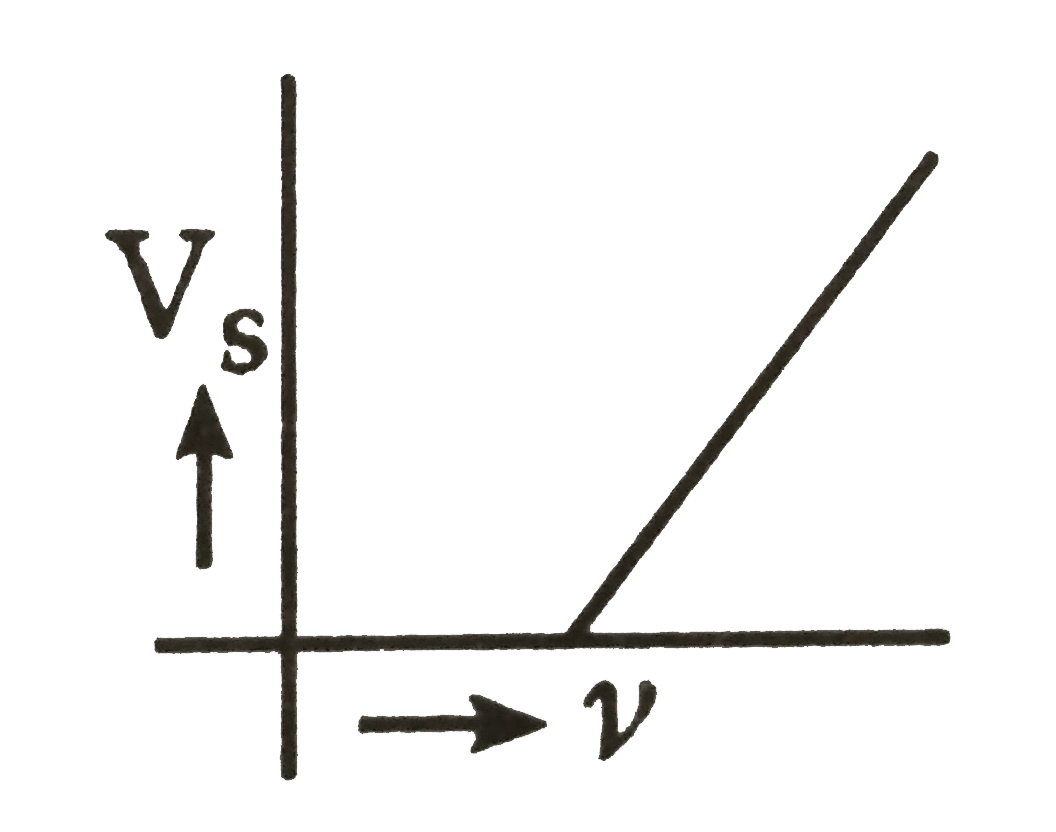
In photoelectric effect the slope of straight line graph between stopping potential (Vs) and frequency of incident light (v) gives
 View Solution
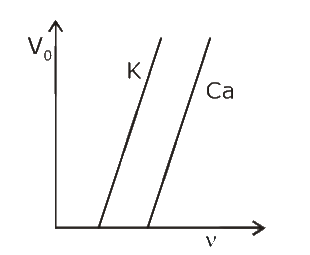
In the diagram, graph are drawn between stopping potential V0 and frequency v for the elements K and Ca. According this to diagram
 View Solution
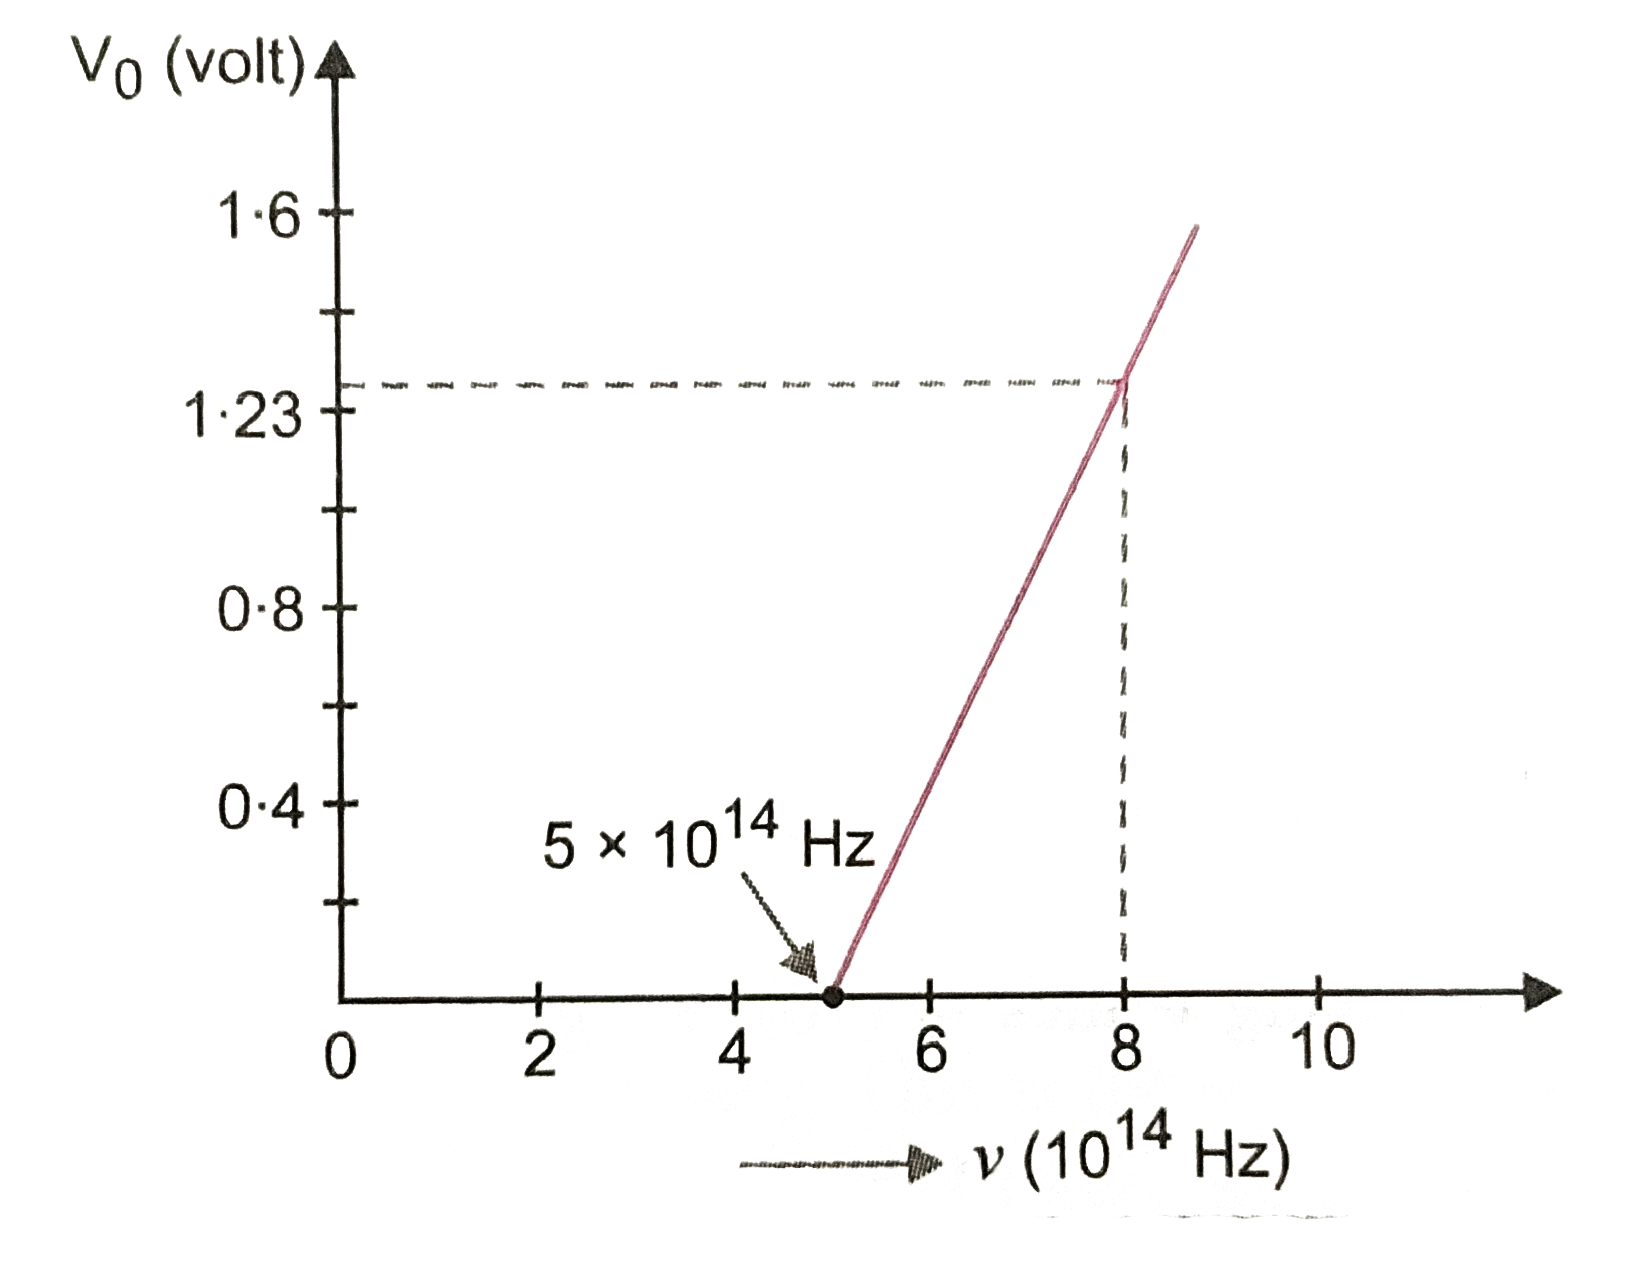
Graph between stopping potential and frequency of photon is given in figure
_2019_CBT7_E01_021_Q01.png)
Find out work function of metal:View SolutionIn a photoelectric experiment, the reciprocal of the slope of the straight line graph giving the relation between the stopping potential and the frequency of incident radiation gives
View Solution


