For a given mass of gas isobar is the graph drawn between
P and volume at constant T
T and P at constant V
T and V at constant P
P and 1V at constant T
The correct Answer is:C
To solve the question regarding the graph that represents an isobar for a given mass of gas, we will analyze each option step by step.
1. Understanding Isobar:
- An isobar is defined as a process or condition where the pressure remains constant. Therefore, we need to find a graph that depicts this condition.
2. Analyzing Option A (Pressure vs. Volume at Constant Temperature):
- This graph represents an isotherm because the temperature is kept constant. According to the ideal gas law (PV = nRT), if the temperature is constant, pressure and volume are inversely related. Therefore, this graph does not represent an isobar.
3. Analyzing Option B (Temperature vs. Pressure at Constant Volume):
- This graph represents an isochoric process since the volume is constant. According to the ideal gas law, at constant volume, pressure is directly proportional to temperature (P ∝ T). Hence, this graph does not depict constant pressure and is not an isobar.
4. Analyzing Option C (Temperature vs. Volume at Constant Pressure):
- This graph represents an isobar because the pressure is kept constant. According to the ideal gas law, at constant pressure, volume is directly proportional to temperature (V ∝ T). Thus, this graph correctly represents an isobar.
5. Analyzing Option D (Pressure vs. 1/V at Constant Temperature):
- This graph represents an isotherm since the temperature is constant. According to the ideal gas law, at constant temperature, pressure is inversely proportional to volume (P ∝ 1/V). Therefore, this graph does not represent an isobar.
Conclusion:
After analyzing all the options, we conclude that the correct answer is Option C: The graph between temperature and volume at constant pressure is an isobar.
- An isobar is defined as a process or condition where the pressure remains constant. Therefore, we need to find a graph that depicts this condition.
- This graph represents an isotherm because the temperature is kept constant. According to the ideal gas law (PV = nRT), if the temperature is constant, pressure and volume are inversely related. Therefore, this graph does not represent an isobar.
- This graph represents an isochoric process since the volume is constant. According to the ideal gas law, at constant volume, pressure is directly proportional to temperature (P ∝ T). Hence, this graph does not depict constant pressure and is not an isobar.
- This graph represents an isobar because the pressure is kept constant. According to the ideal gas law, at constant pressure, volume is directly proportional to temperature (V ∝ T). Thus, this graph correctly represents an isobar.
- This graph represents an isotherm since the temperature is constant. According to the ideal gas law, at constant temperature, pressure is inversely proportional to volume (P ∝ 1/V). Therefore, this graph does not represent an isobar.
After analyzing all the options, we conclude that the correct answer is Option C: The graph between temperature and volume at constant pressure is an isobar.
Topper's Solved these Questions
- BOOK - NARAYNACHAPTER - STATES OF MATTEREXERCISE - EXERCISE - 140videos
STATES OF MATTER
- BOOK - NARAYNACHAPTER - STATES OF MATTEREXERCISE - EXERCISE - 242videos
STATES OF MATTER
- BOOK - NARAYNACHAPTER - STATES OF MATTEREXERCISE - EVALUATE YOURSELF - 36videos
STATES OF MATTER
- BOOK - NARAYNACHAPTER - SOME BASIC PRINCIPLES AND TECHNIQUESEXERCISE - EXERCISE -IV (QUALITATIVE AND QUANTITATIVE ANALYSIS OF ORGANIC OF COMPOUNDS)8videos
SOME BASIC PRINCIPLES AND TECHNIQUES
- BOOK - NARAYNACHAPTER - STRUCTURE OF ATOMEXERCISE - EXERCISE - IV EXEMPLAR PROBLEMS24videos
STRUCTURE OF ATOM
Similar Questions
Knowledge Check
- Question 1 - Select One
In Boyles experiment for a given gas at different temperature the graph drawn between pressure and density are straight lines as shown then
_E01_060_Q01.png) AT1>T2BT2>T1CT1=T2DT31=T2
AT1>T2BT2>T1CT1=T2DT31=T2 - Question 2 - Select One
In an experiment to find focal length of a concave mirror, a graph is drawn between the magnitudes of (u) and (v). The graph looks like.
A B
B C
C D
D
- Question 3 - Select One or More
For an ideal gas, under isobaric condition, a graph between log V vs log T :
Ais linear with unit slopeBrepresents Boyle’s LawCrepresents Charle’s LawDrepresents Gay-Lussac’s Law
For a given mass of a gas, what is the shape of (pV) versus (T) graph on isothermal process ?
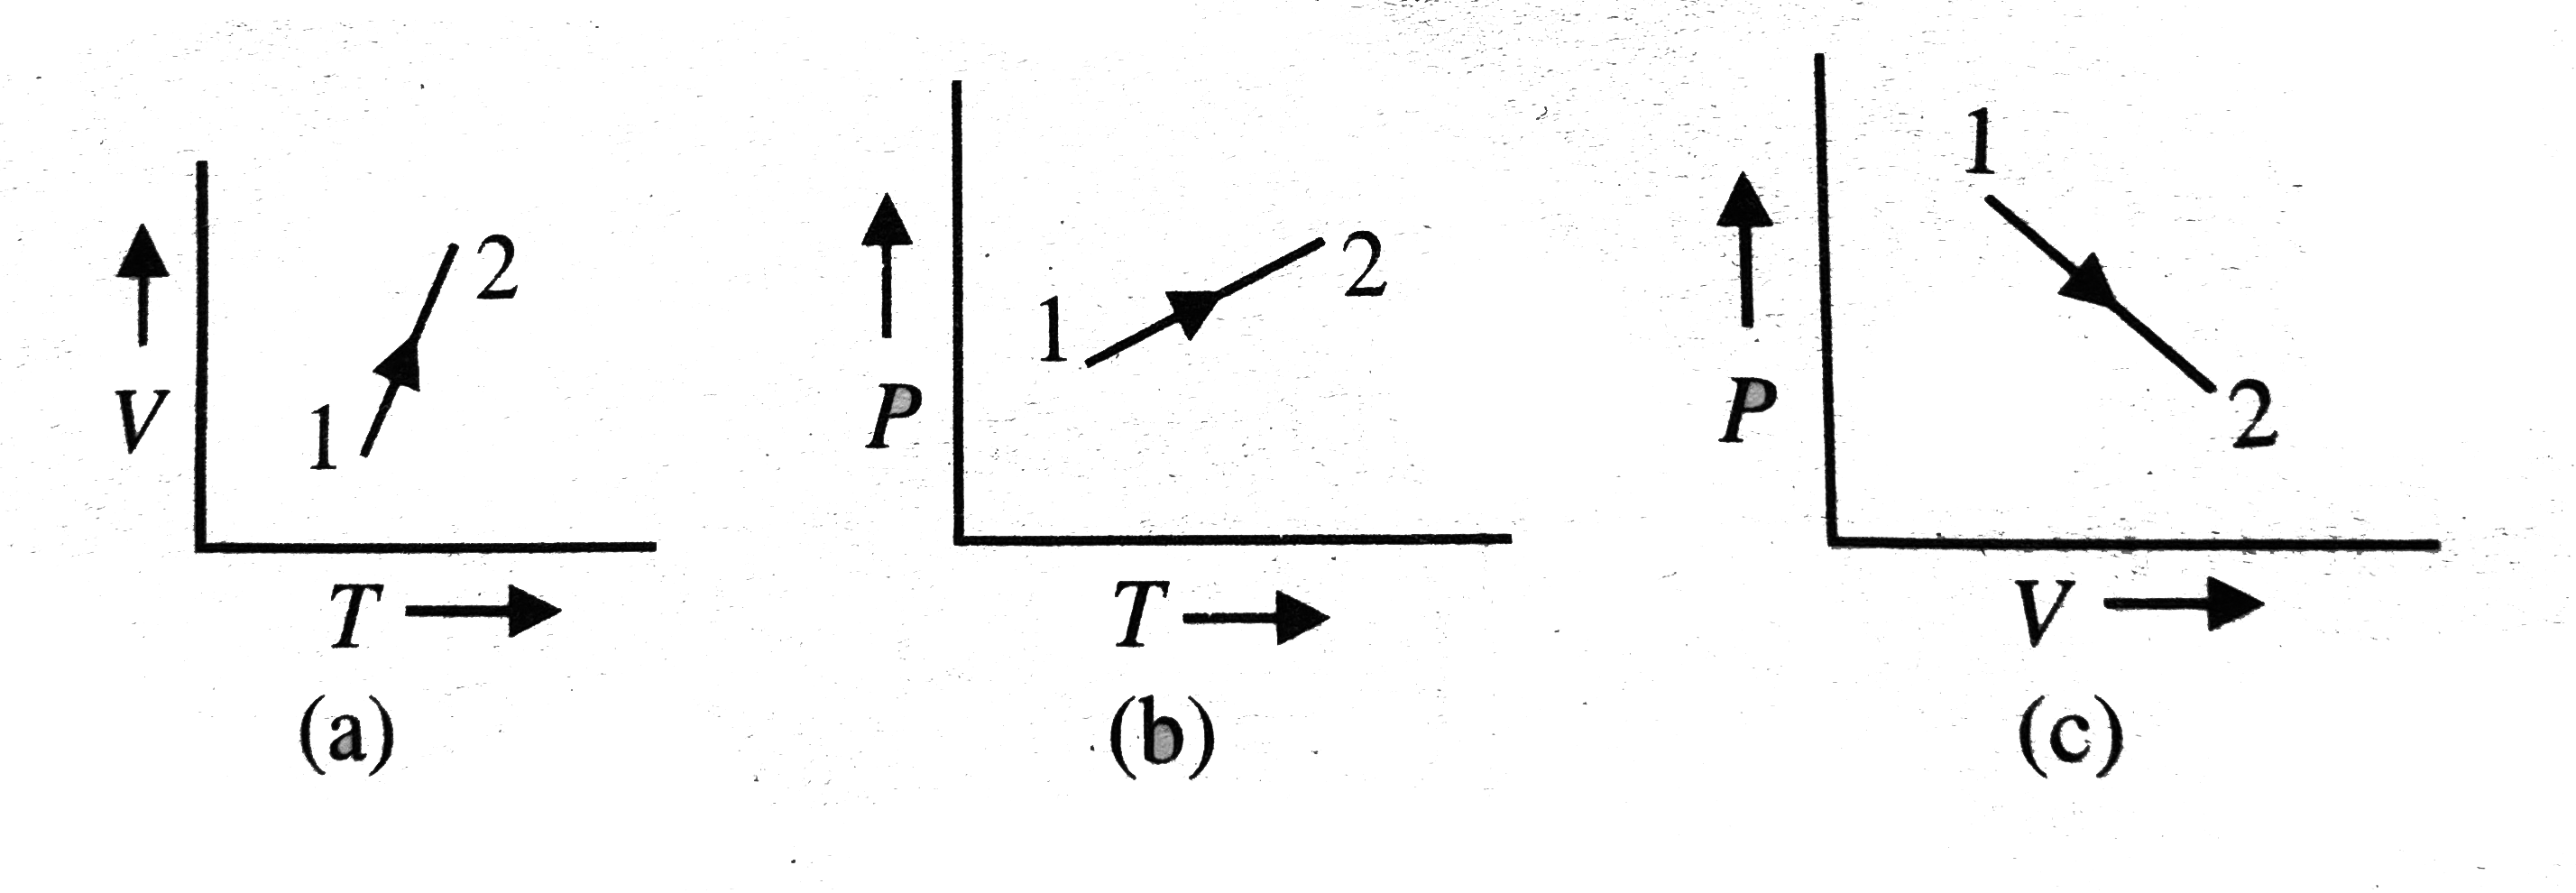
View SolutionThe three diagrams below depict three different processes for a given mass of an ideal gas. What information can be drawn regarding the change of (a) pressure, (b) volume and (c ) temperature of the gas from the plots as shown in Fig., respectively.
 View Solution
For a given mass of a gas at a fixed temperature, what is the nature of graph between pressure P and volume V?
View SolutionThe slope of T−P graph for a given mass of a gas increases, the volumn of the gas
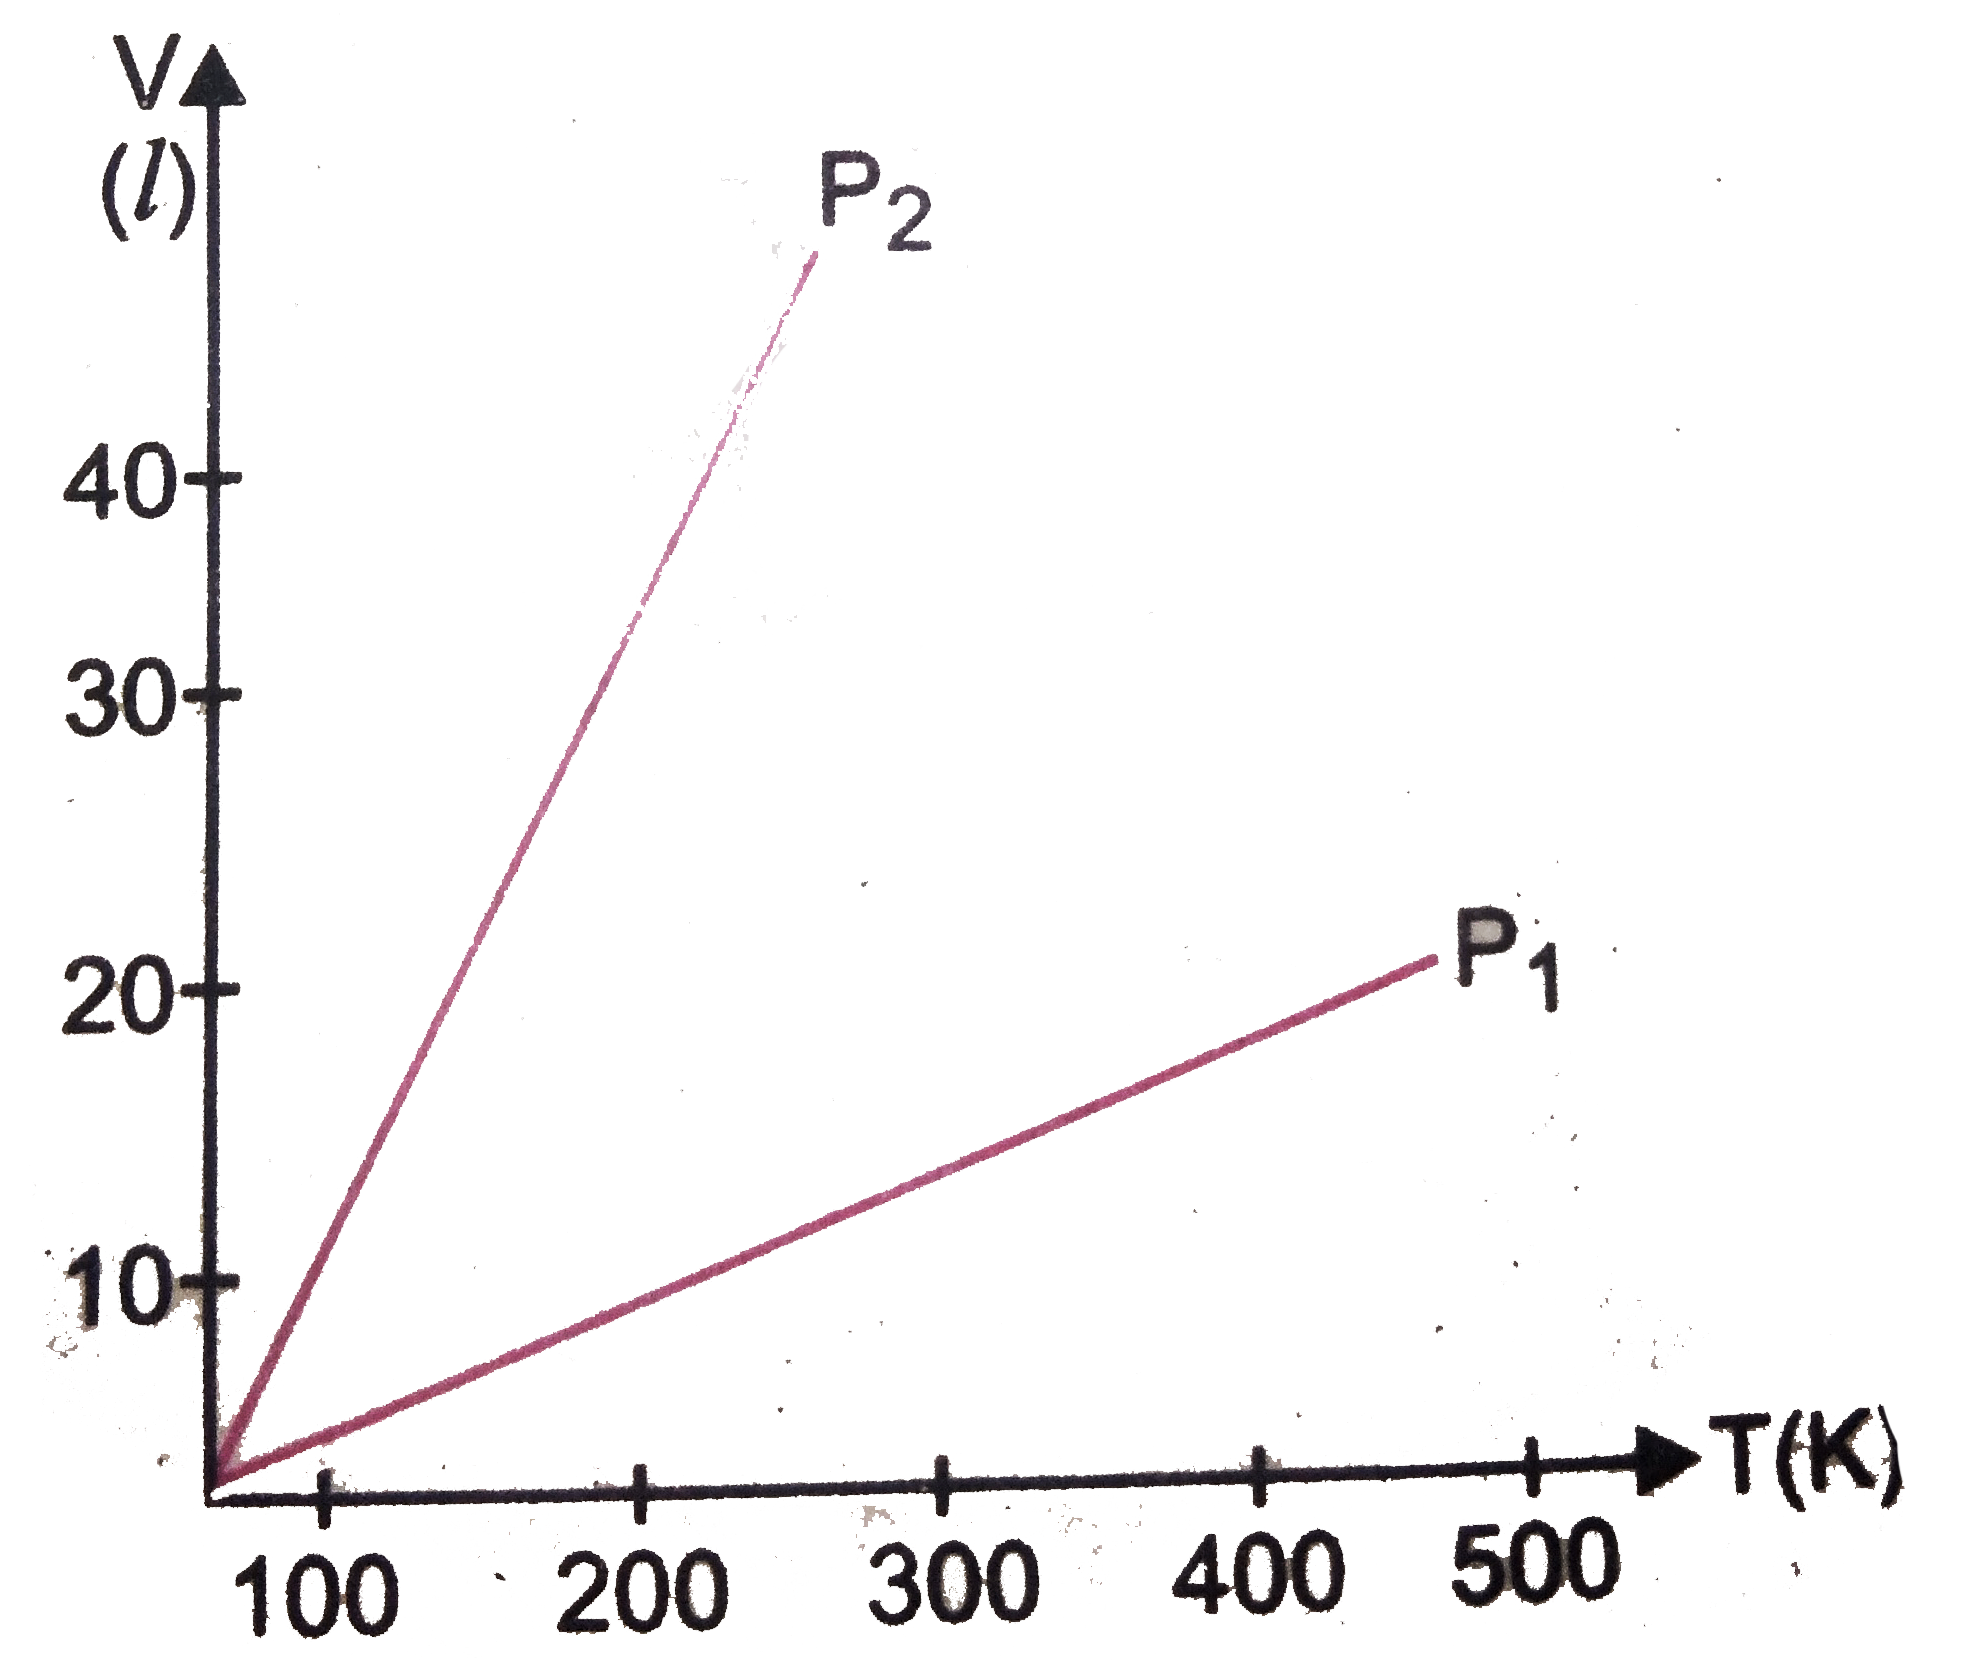
View SolutionVolume versus temperature graphs for a given mass of an ideal gas are shown in Fig. at two different values of constant pressure. What can be inferred about relation between P1andP2?
 View Solution

