At constant temperature for given amount of an ideal gas the correct graph between PV vs P is
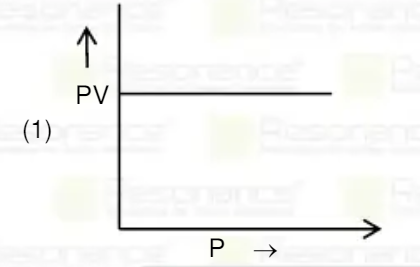
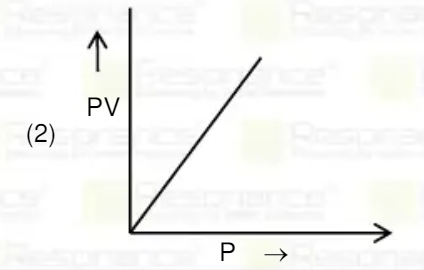
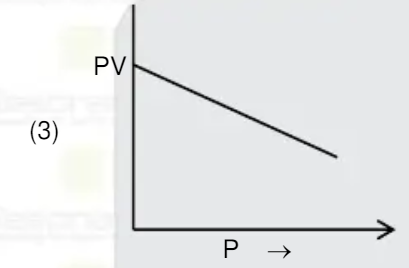
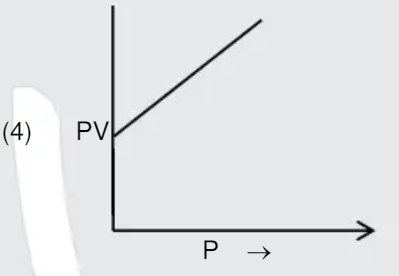
To solve the problem of finding the correct graph between PV and P for an ideal gas at constant temperature, we can follow these steps:
Step 1: Understand the Ideal Gas Law
The ideal gas law is given by the equation:
PV=nRT
where:
- P = pressure
- V = volume
- n = number of moles (constant)
- R = universal gas constant (constant)
- T = temperature (constant)
Step 2: Identify Constants
Since we are dealing with a constant temperature and a given amount of gas, both n and R are constants. Therefore, the product nRT is also constant.
Step 3: Analyze the Relationship
From the ideal gas law, we can express PV as:
PV=constant
This means that for any change in P or V, the product PV will always equal the same constant value.
Step 4: Graph PV vs P
If we want to graph PV against P, we can rearrange the equation:
PV=constant
This implies that as P changes, V must change in such a way that the product PV remains constant.
Step 5: Determine the Type of Graph
Since PV is constant, the graph of PV versus P will be a horizontal line. This indicates that no matter what the value of P is, PV remains the same.
Conclusion
Thus, the correct graph between PV and P at constant temperature for a given amount of an ideal gas is a horizontal line, indicating that PV remains constant regardless of changes in P.
---
The ideal gas law is given by the equation:
PV=nRT
where:
- P = pressure
- V = volume
- n = number of moles (constant)
- R = universal gas constant (constant)
- T = temperature (constant)
Since we are dealing with a constant temperature and a given amount of gas, both n and R are constants. Therefore, the product nRT is also constant.
From the ideal gas law, we can express PV as:
PV=constant
This means that for any change in P or V, the product PV will always equal the same constant value.
If we want to graph PV against P, we can rearrange the equation:
PV=constant
This implies that as P changes, V must change in such a way that the product PV remains constant.
Since PV is constant, the graph of PV versus P will be a horizontal line. This indicates that no matter what the value of P is, PV remains the same.
Thus, the correct graph between PV and P at constant temperature for a given amount of an ideal gas is a horizontal line, indicating that PV remains constant regardless of changes in P.
Similar Questions
Knowledge Check
At constant temperature, in a given mass of an ideal gas -
AThe ratio of pressure and volume always remains constantBVolume always remains constantCpressure always remains constantDThe product of pressure and volume always rmains constantAt constant temperature, in a given mass of an ideal gas -
AThe ratio of pressure and volume always remains constantBVolume always remains constantCPressure always remains constantDThe product of pressure and volume always remains constantAt constant temperature, in a given mass of an ideal gas -
AThe ratio of pressure and volume always remains constantBVolume always remains constantCPressure always remains constantDThe product of pressure and volume always remains constant
For fixed amount of an ideal gas identify the incorrect graph :
View SolutionFor given mass of an ideal gas at constant temperature
View SolutionFor fixed amount of an ideal gas taken at constnat temperature V vs 1p2 is :
View SolutionWhich of the following curve is correct for a given amount of an ideal gas at constant pressure?
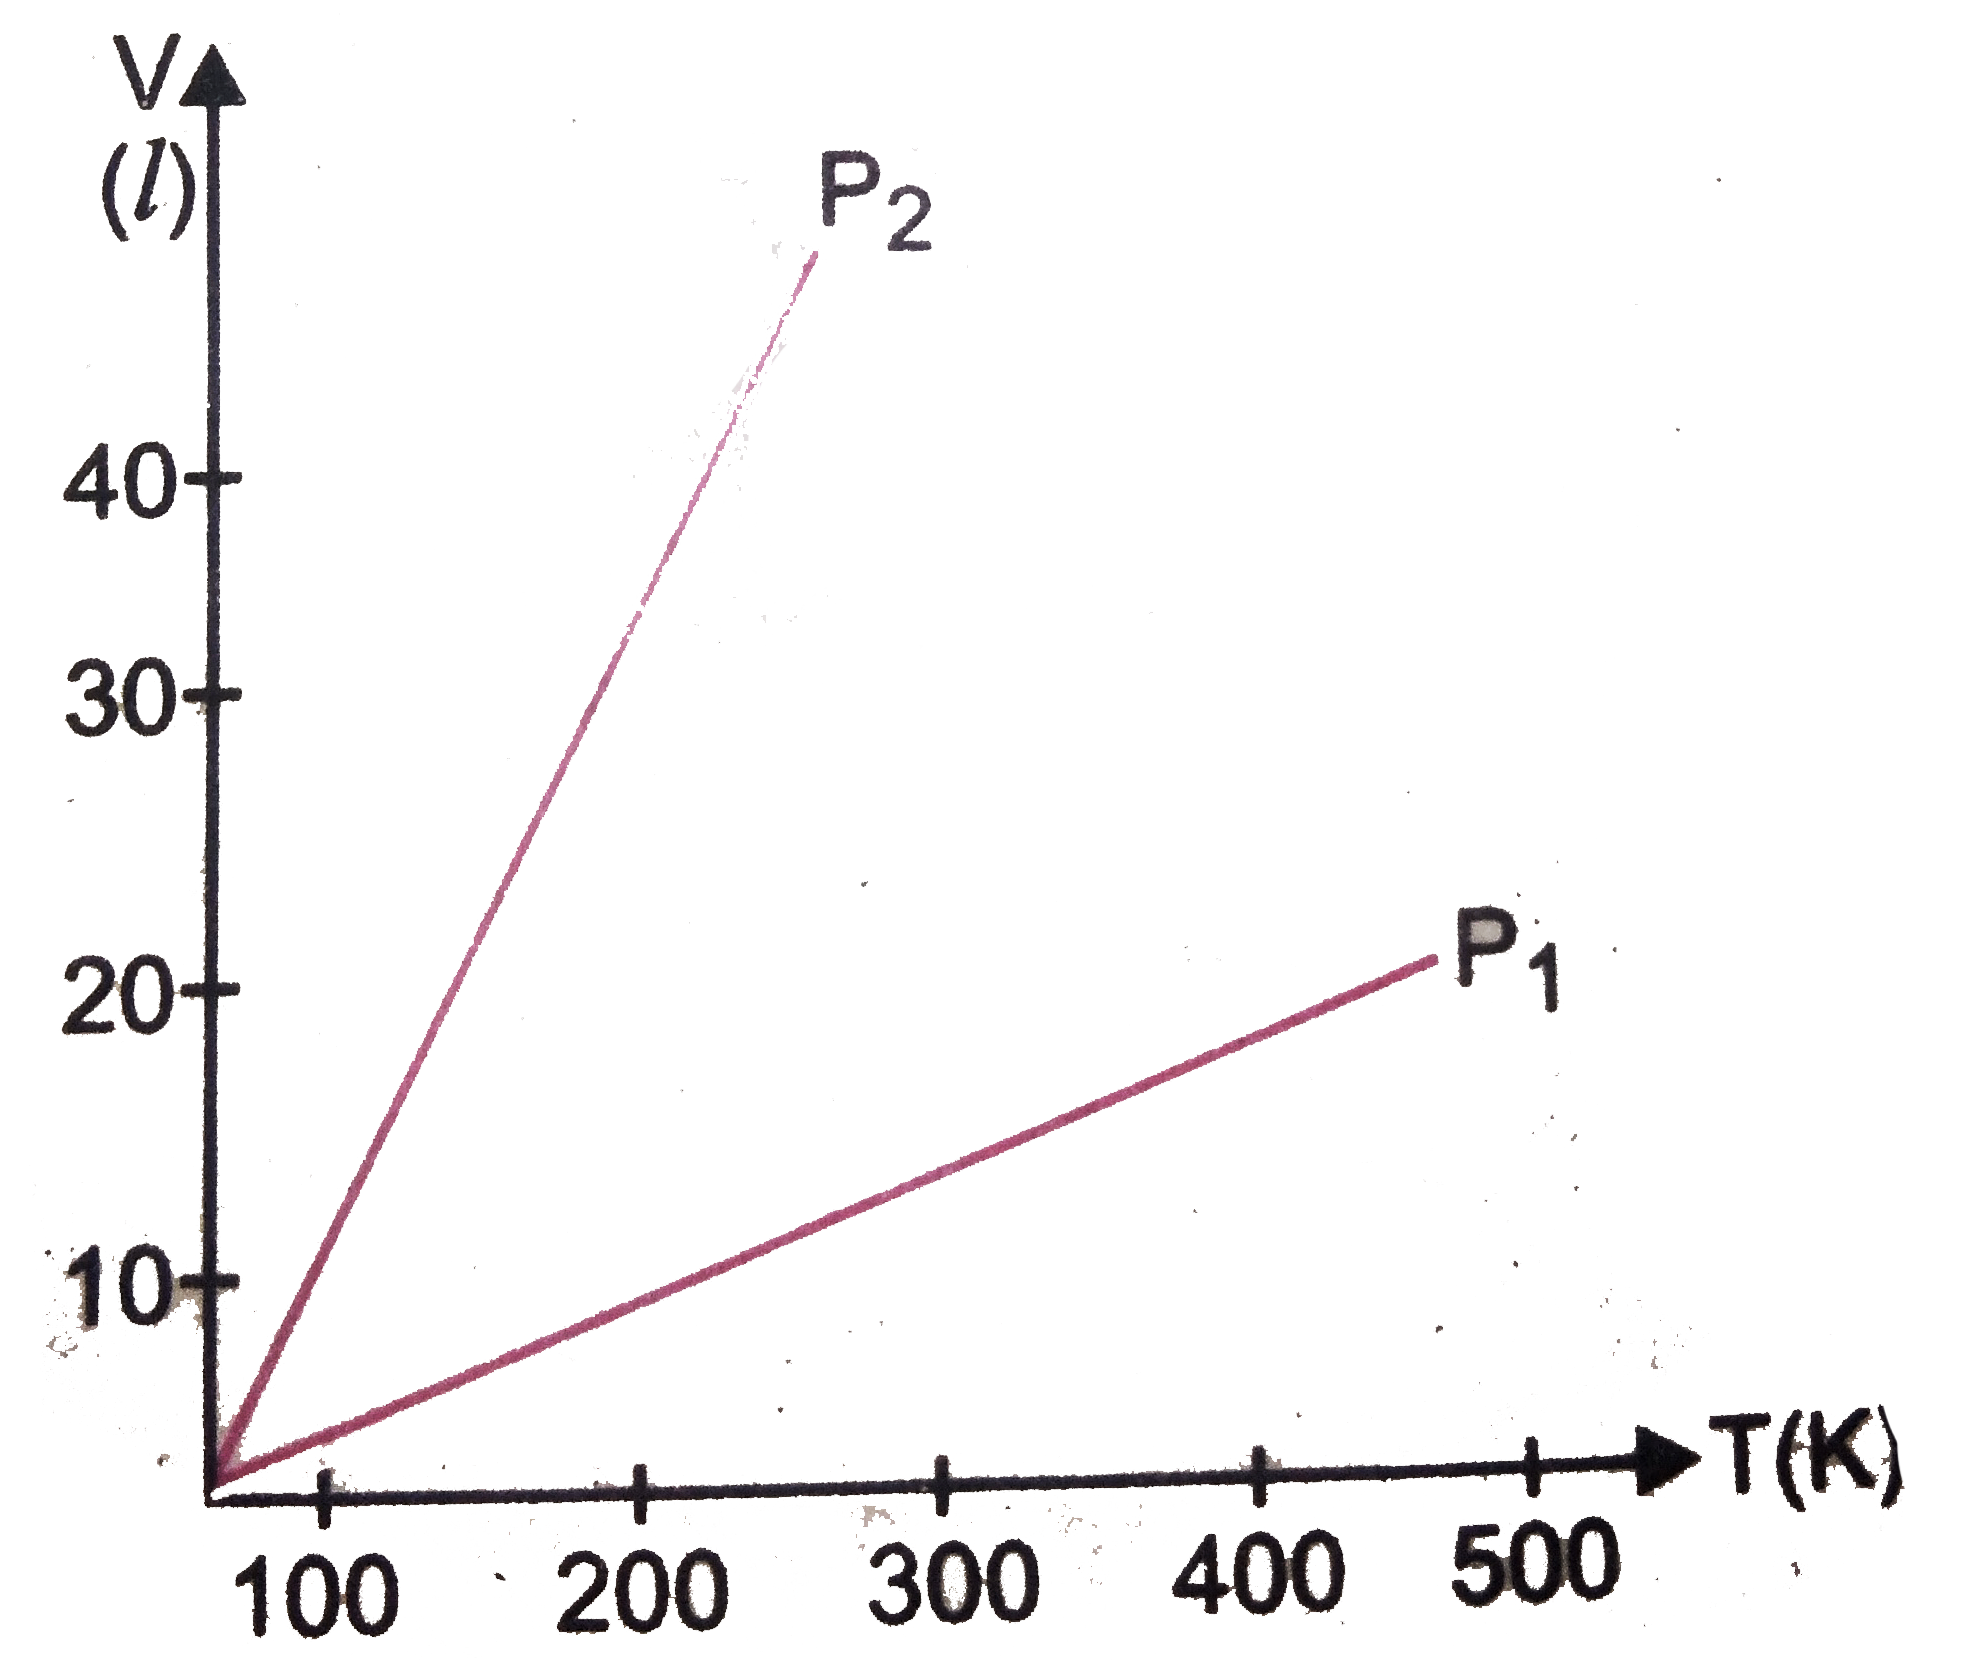
View SolutionVolume versus temperature graphs for a given mass of an ideal gas are shown in Fig. at two different values of constant pressure. What can be inferred about relation between P1andP2?
View Solution
