Which of the following graph represent Boyle's law ?
A
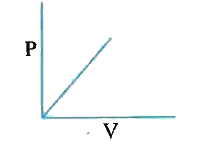
B
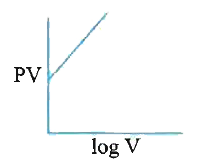
C
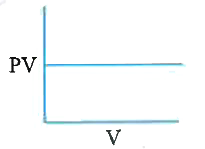
D
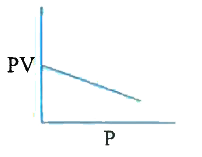
Video Solution
Text Solution
The correct Answer is:C
According to Boyle.s Law PV = constant , at constant temperature either P increases or V increases both (2) & (3) may be correct .
|
Updated on:21/07/2023
Topper's Solved these Questions
- BOOK - NARAYNACHAPTER - STATES OF MATTEREXERCISE - EXERCISE - 242videos
STATES OF MATTER
- BOOK - NARAYNACHAPTER - STATES OF MATTEREXERCISE - EXERCISE - 332videos
STATES OF MATTER
- BOOK - NARAYNACHAPTER - STATES OF MATTEREXERCISE - CUQ35videos
STATES OF MATTER
- BOOK - NARAYNACHAPTER - SOME BASIC PRINCIPLES AND TECHNIQUESEXERCISE - EXERCISE -IV (QUALITATIVE AND QUANTITATIVE ANALYSIS OF ORGANIC OF COMPOUNDS)8videos
SOME BASIC PRINCIPLES AND TECHNIQUES
- BOOK - NARAYNACHAPTER - STRUCTURE OF ATOMEXERCISE - EXERCISE - IV EXEMPLAR PROBLEMS24videos
STRUCTURE OF ATOM
Similar Questions
Graph between pressure and volume are plotted at different temperature. Which of the following isotherms represent Boyle's law as PV = constant?
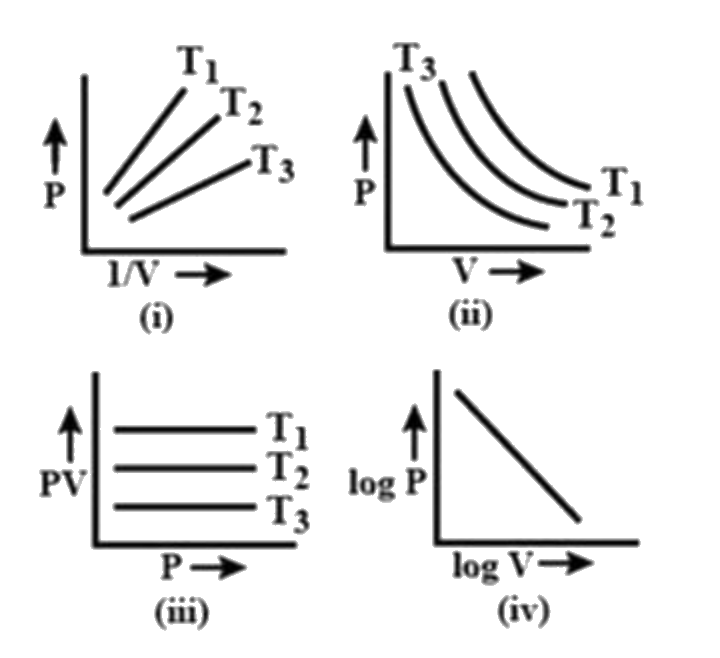 View Solution
Graphs between pressure and volume are plotted at different temperatures . Which of the following isotherms represent Boyle's law as PV = constant ? (T1>T2>T3)
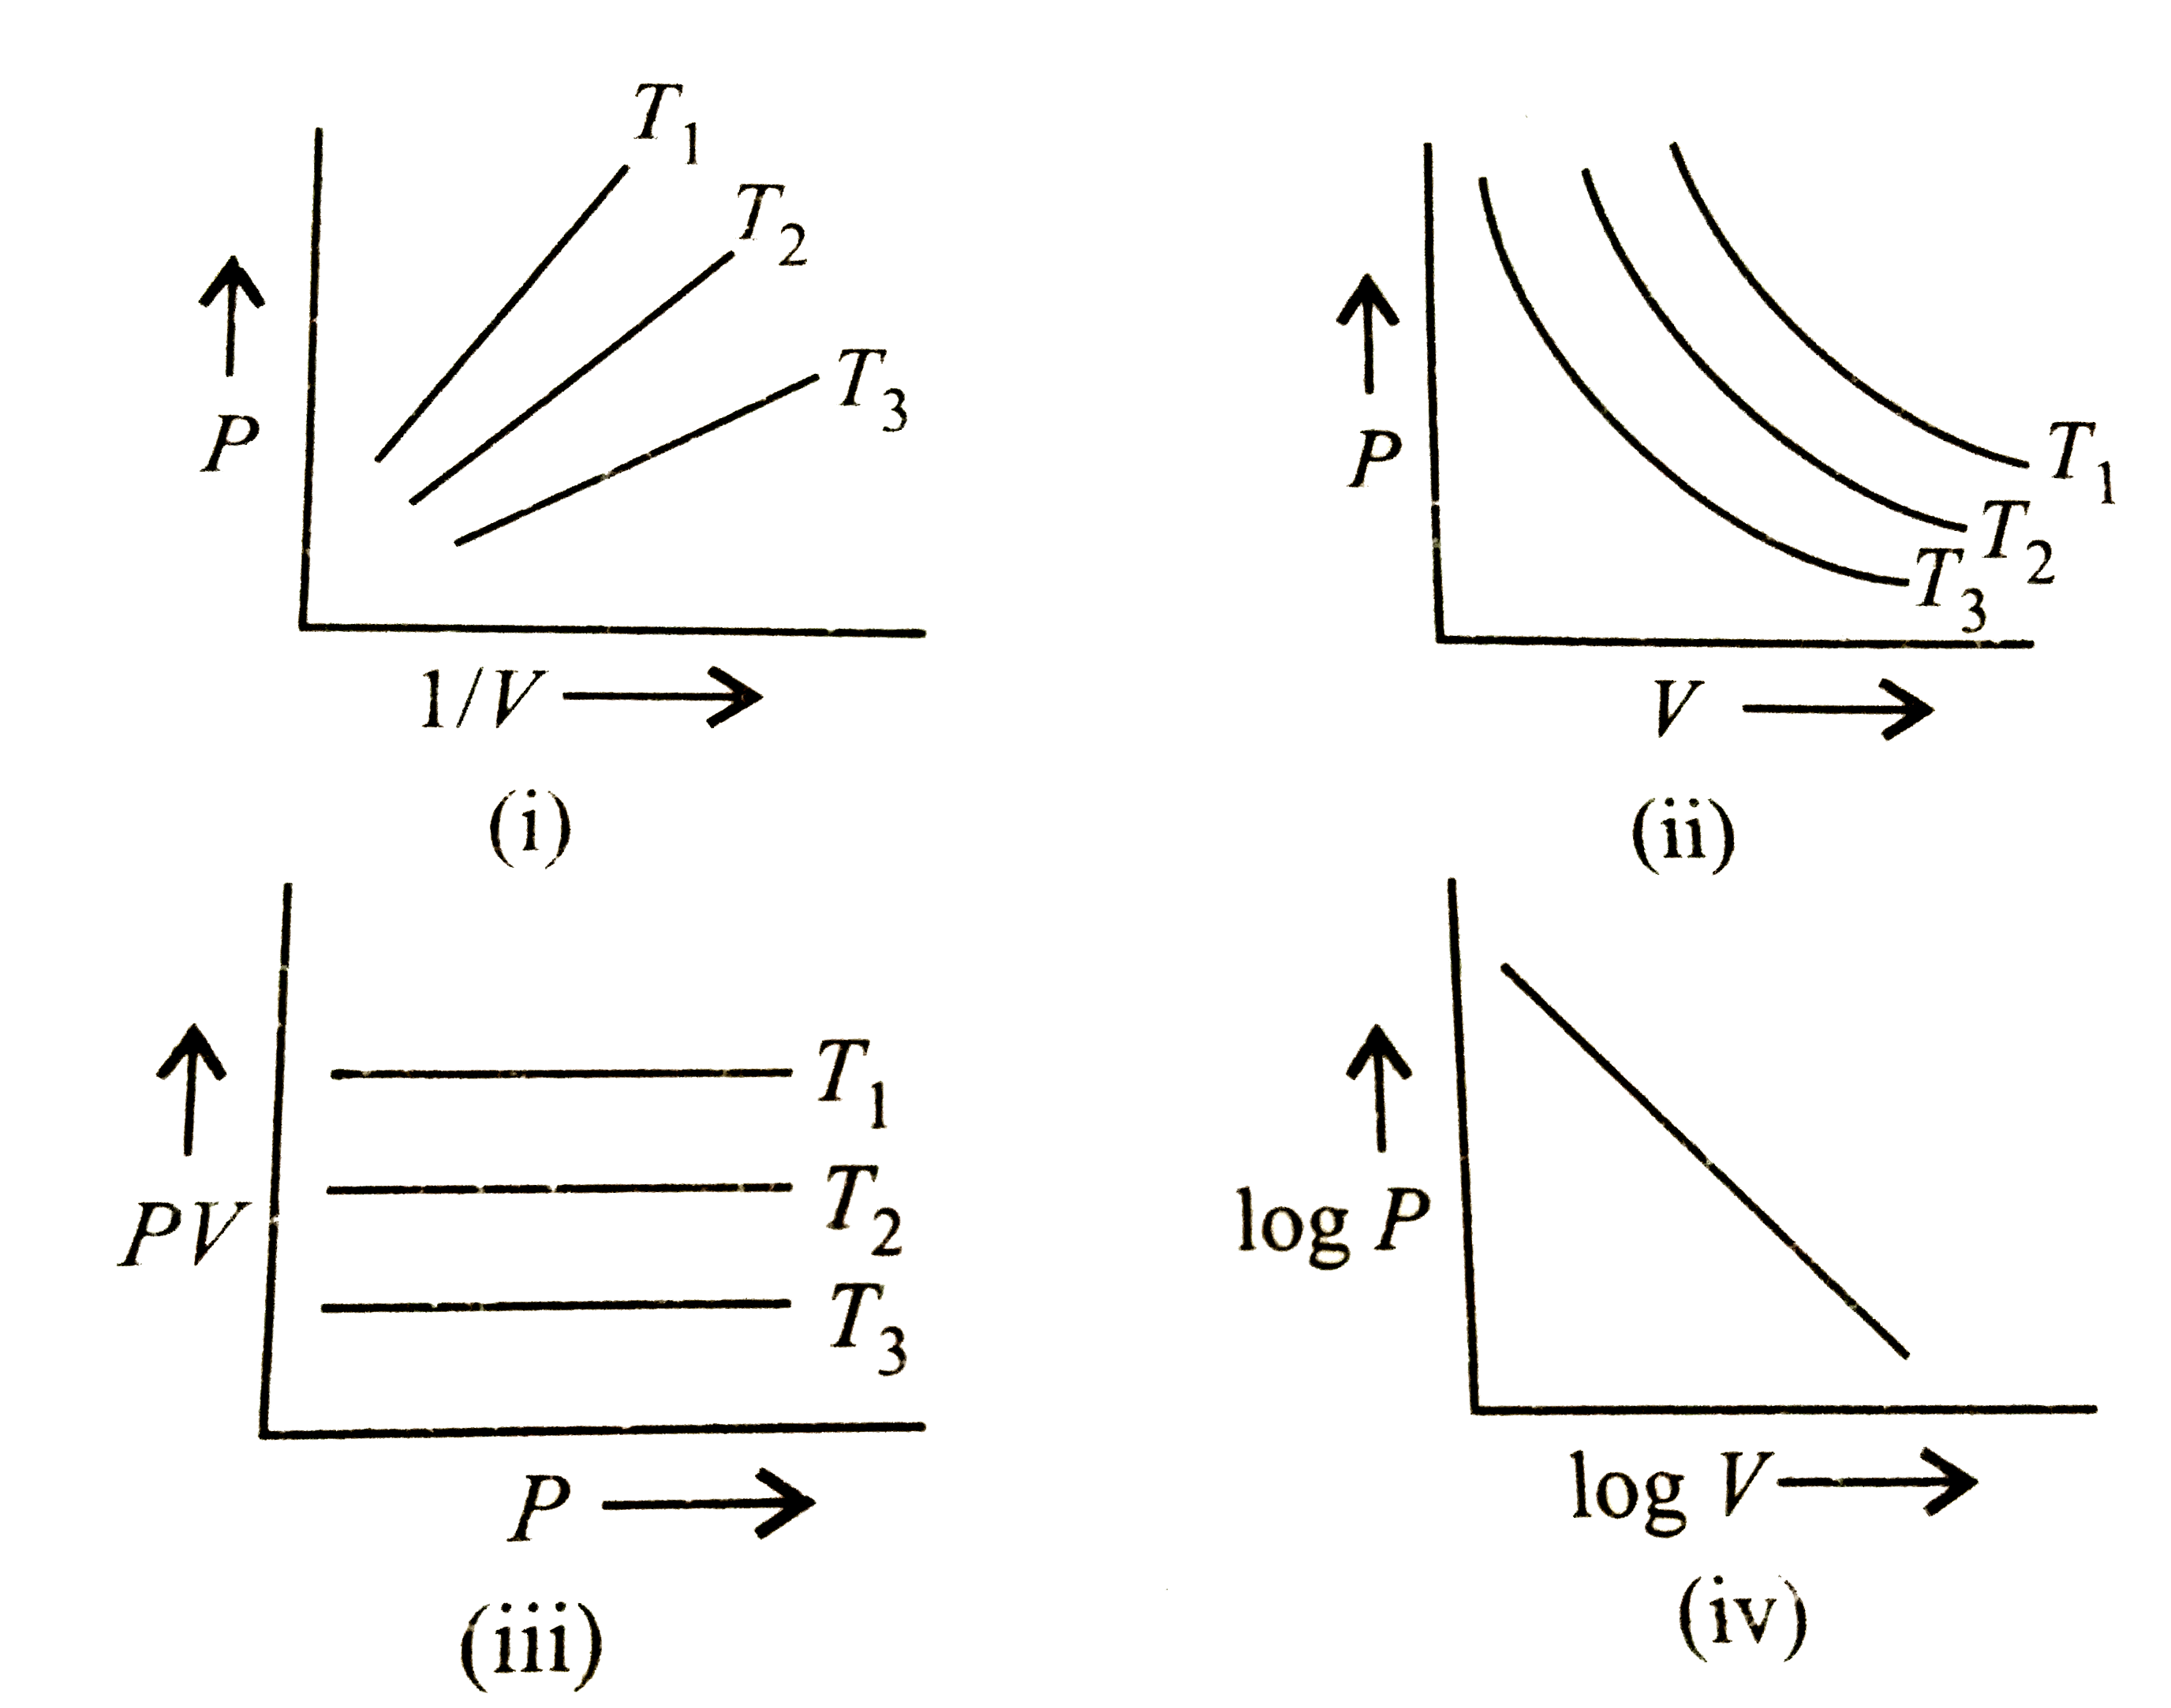 View Solution
Knowledge Check
- Question 1 - Select One
Which of the following graph represents Boyle's law ?
A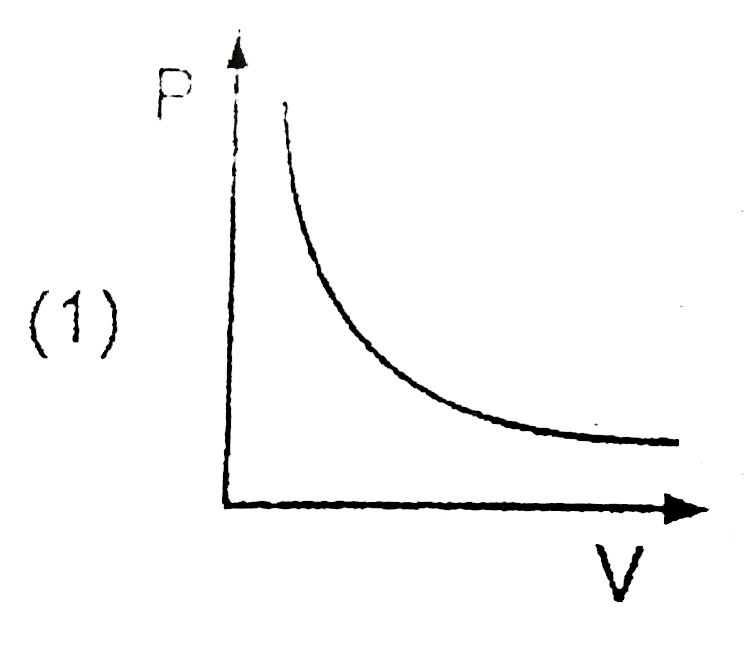 B
B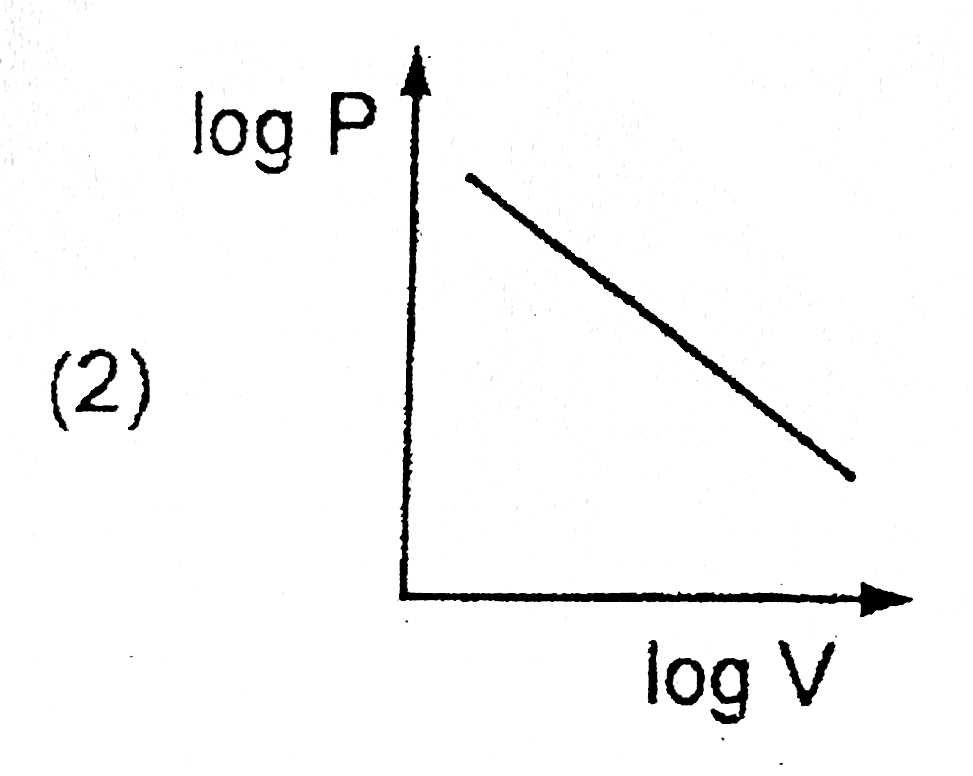 C
C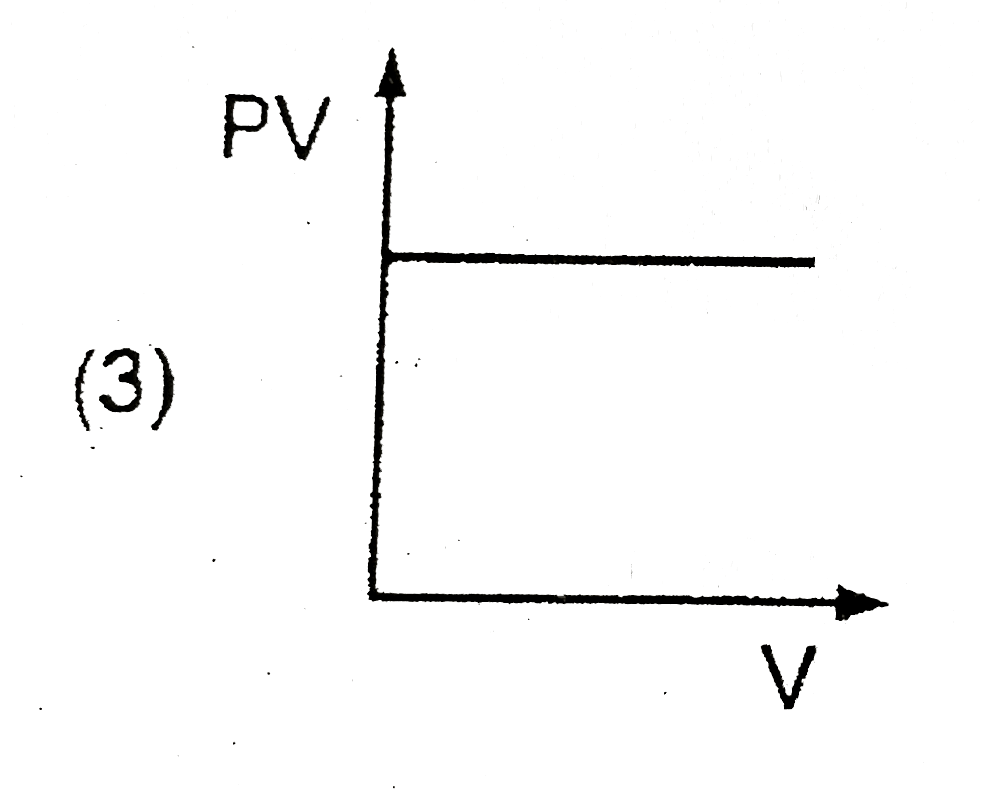 DAll of these
 - Question 2 - Select One
Which of the following graph represents Boyle's law ?
A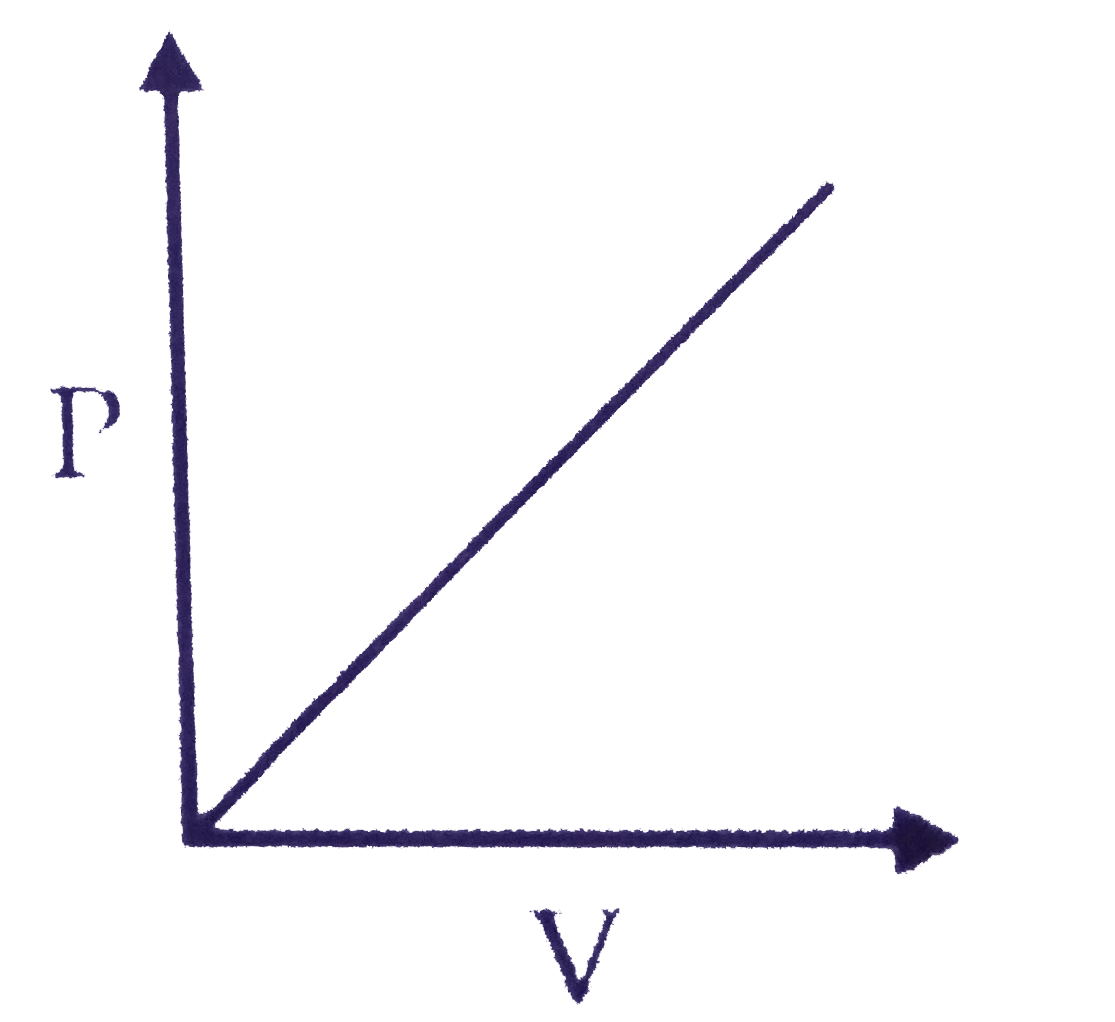 B
B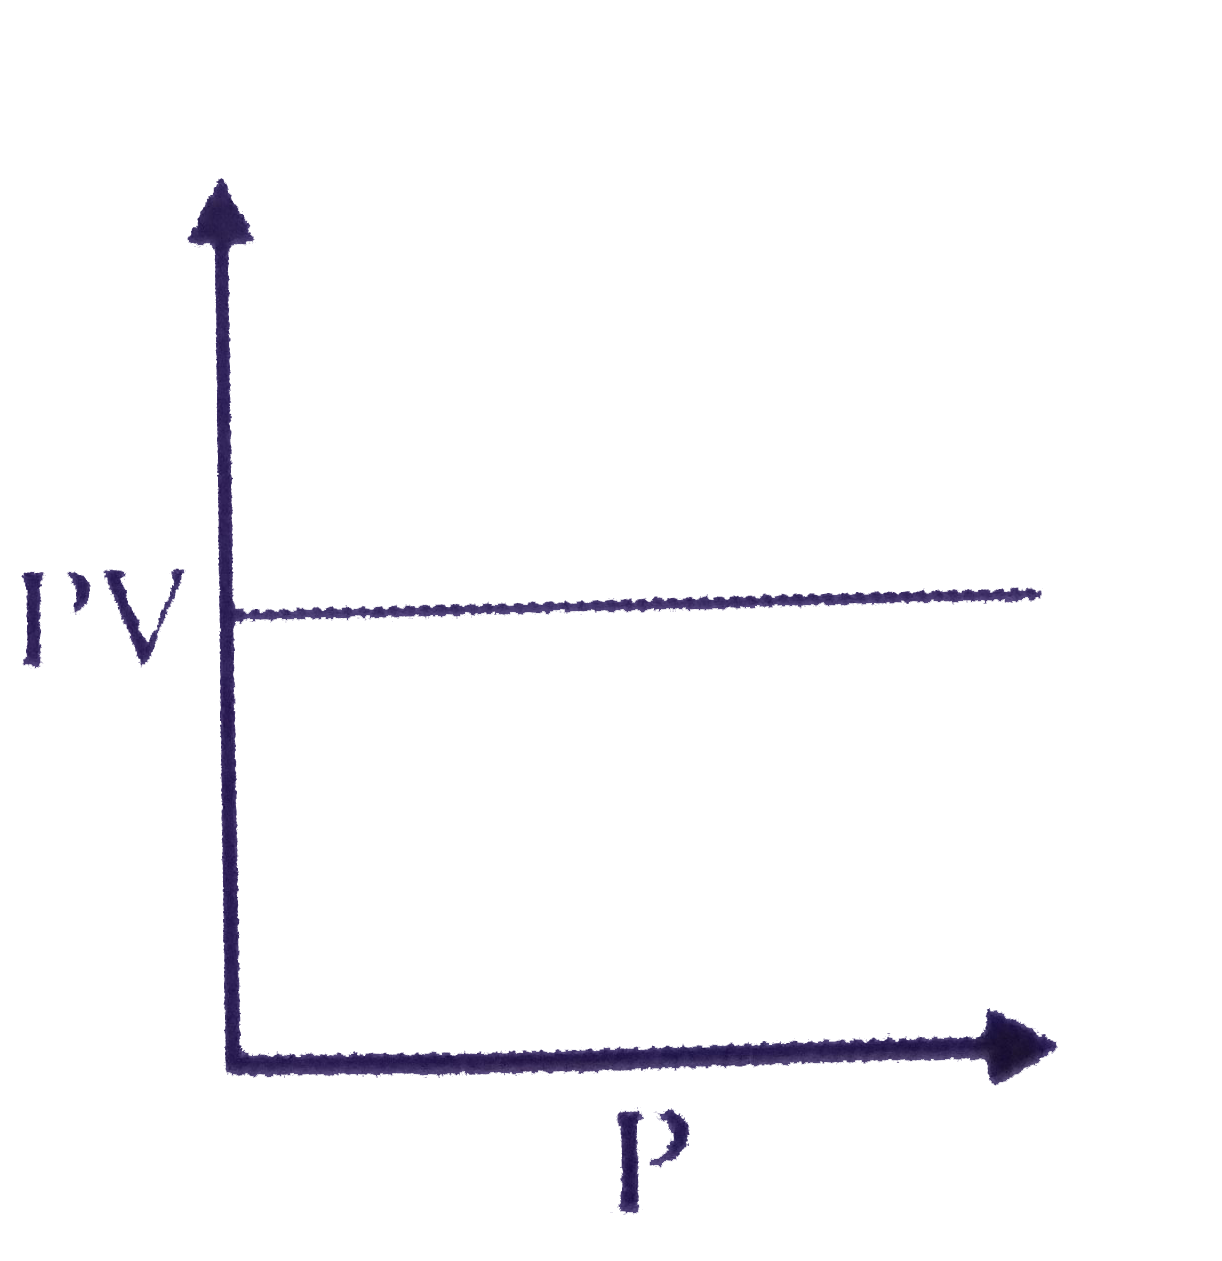 C
C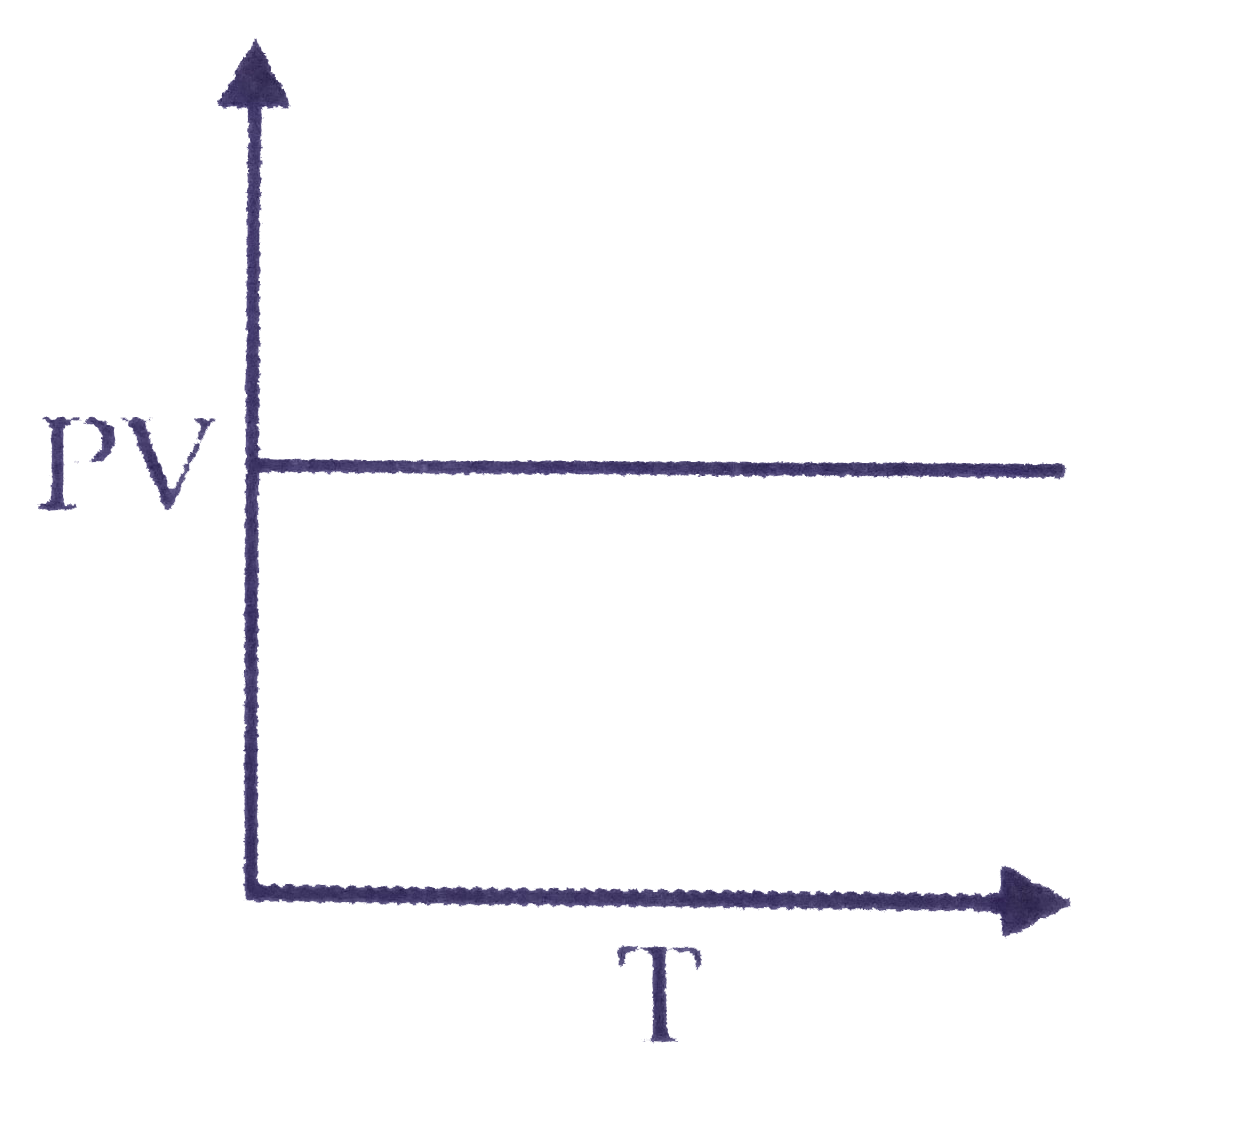 D
D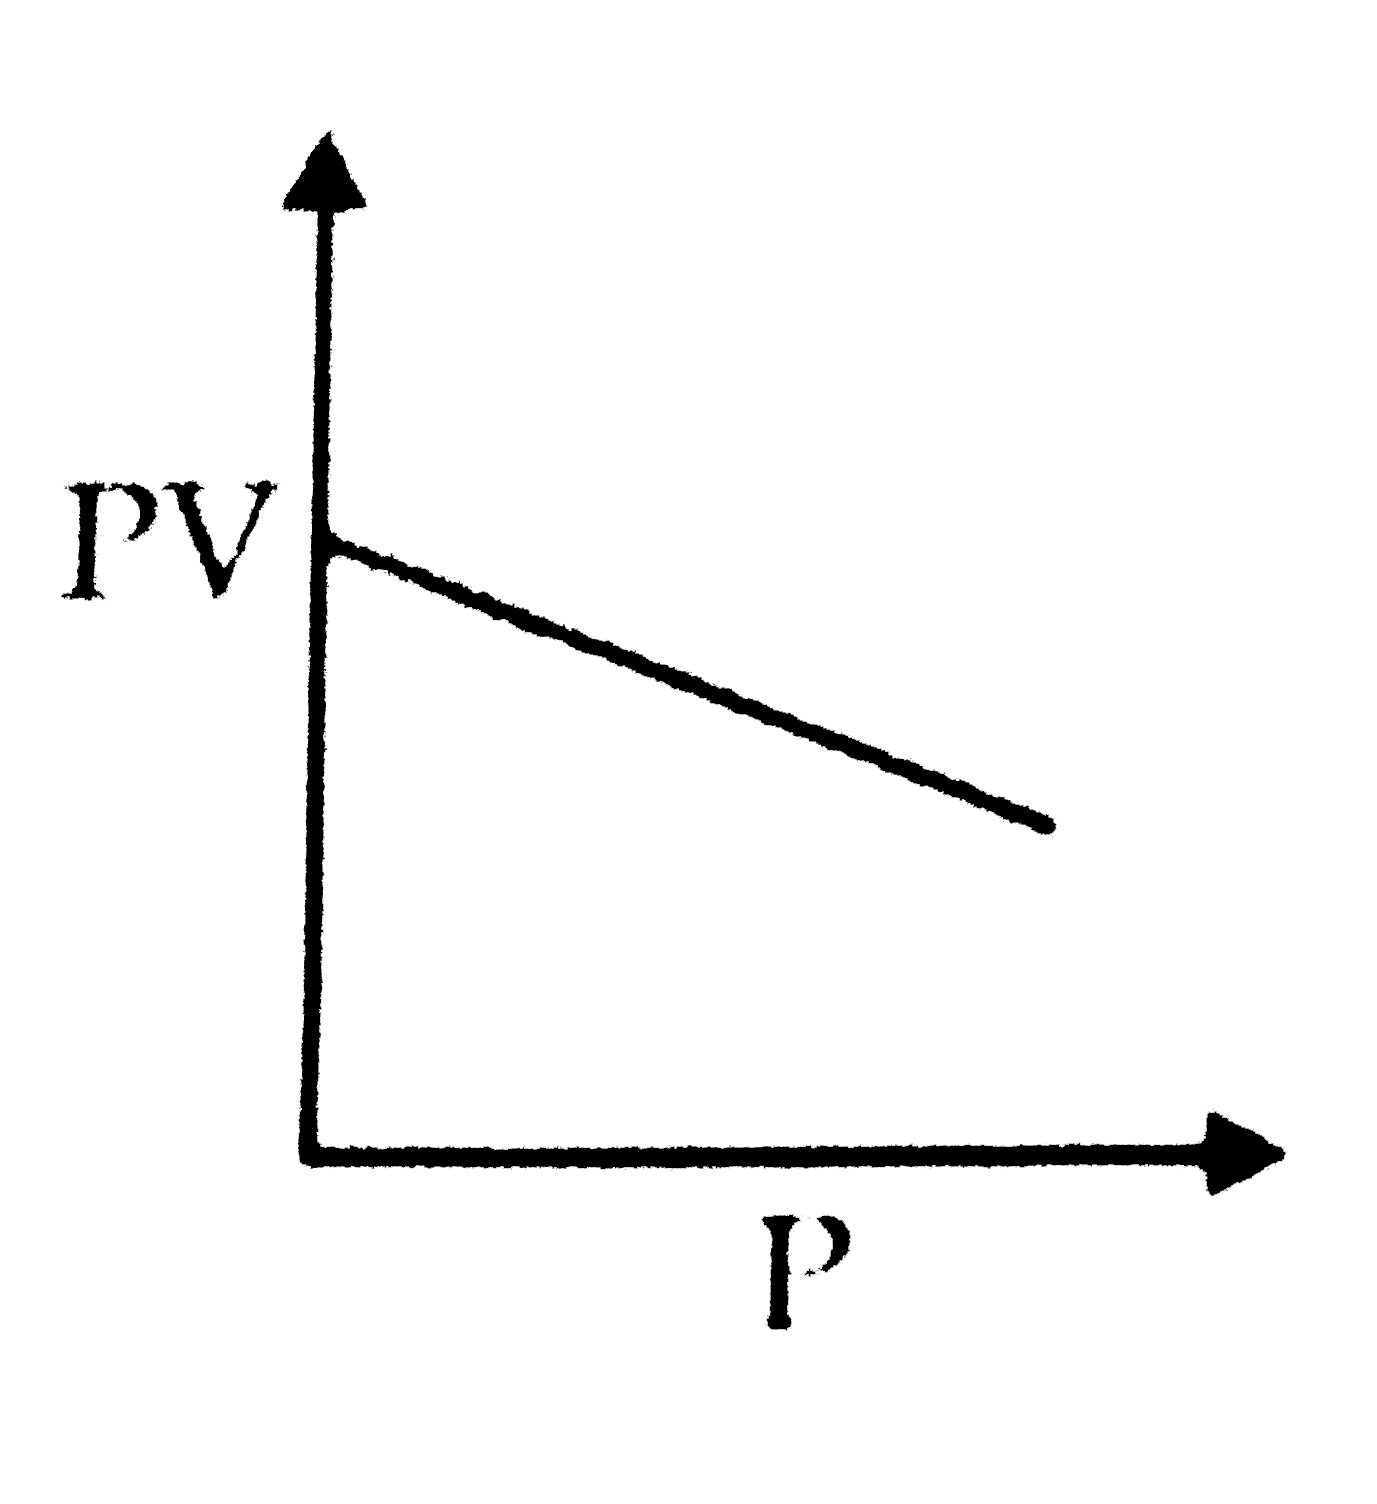
- Question 3 - Select One
Which of the following graphs represents Boyle's law correctly?
(i)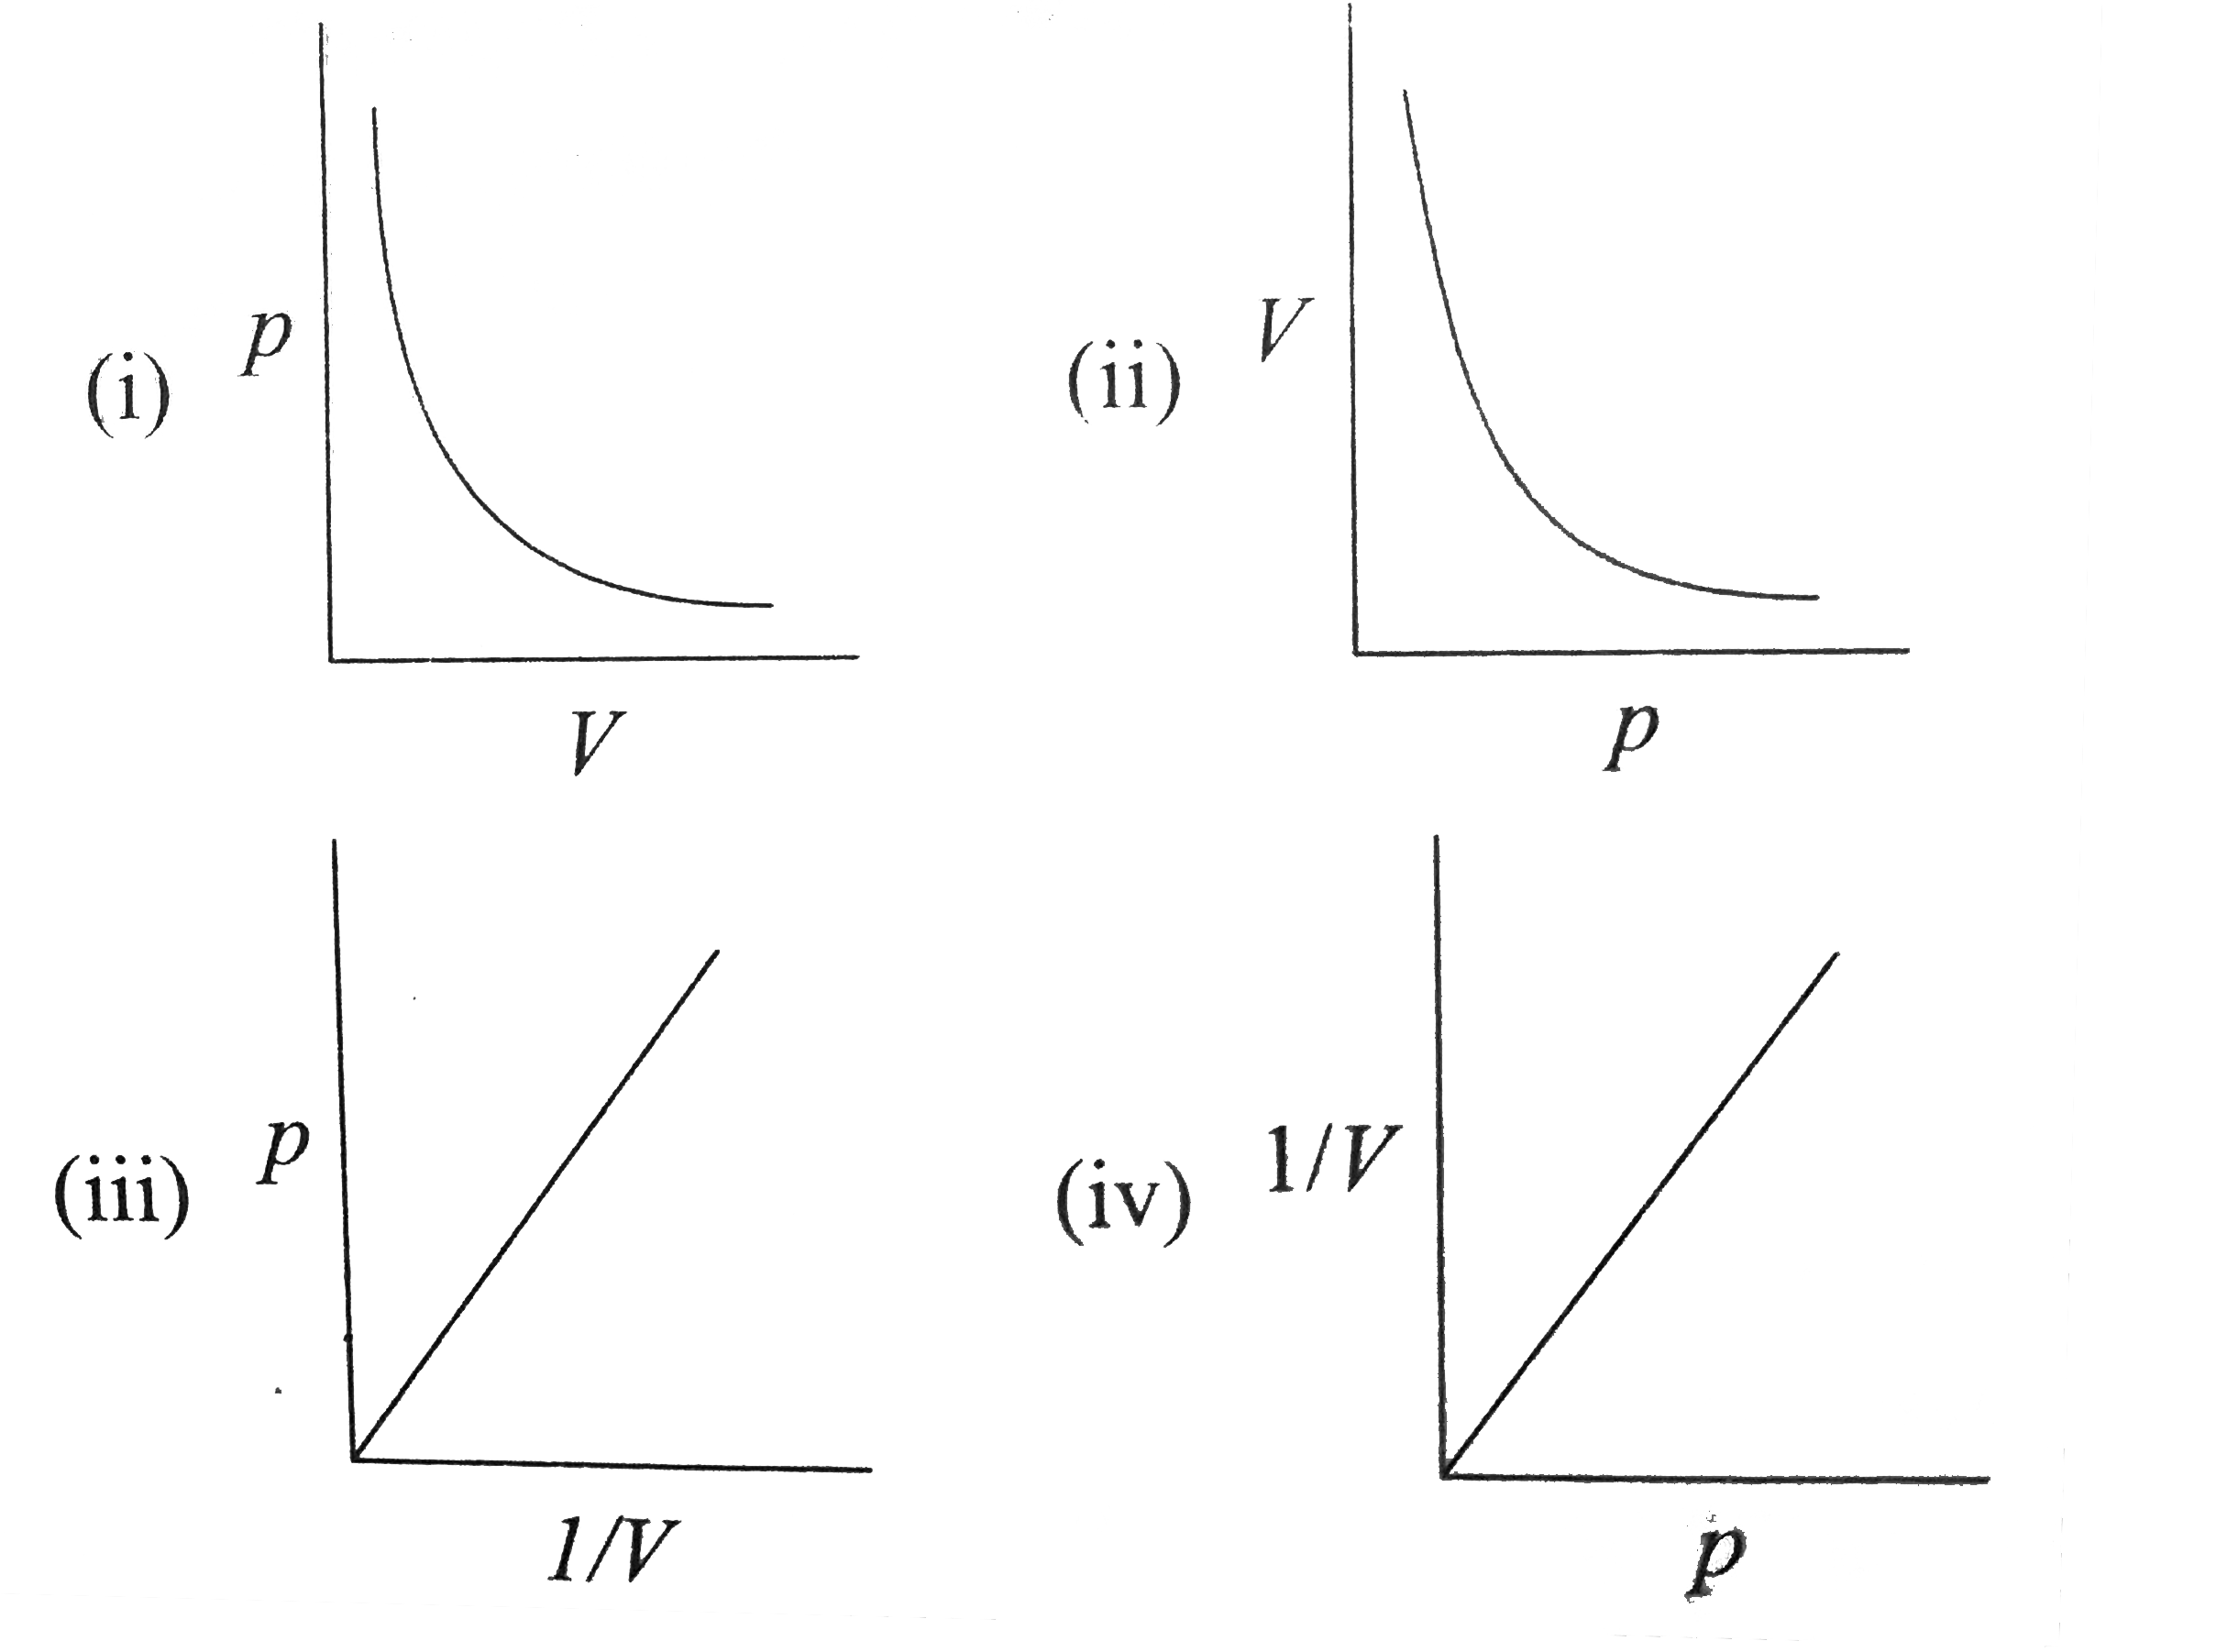 A(i),(ii),(iii),(iv)B(i),(iii)C(ii),(iv)D(ii),(iii)
Which of the following graphs represents the correct Boyle's law ?
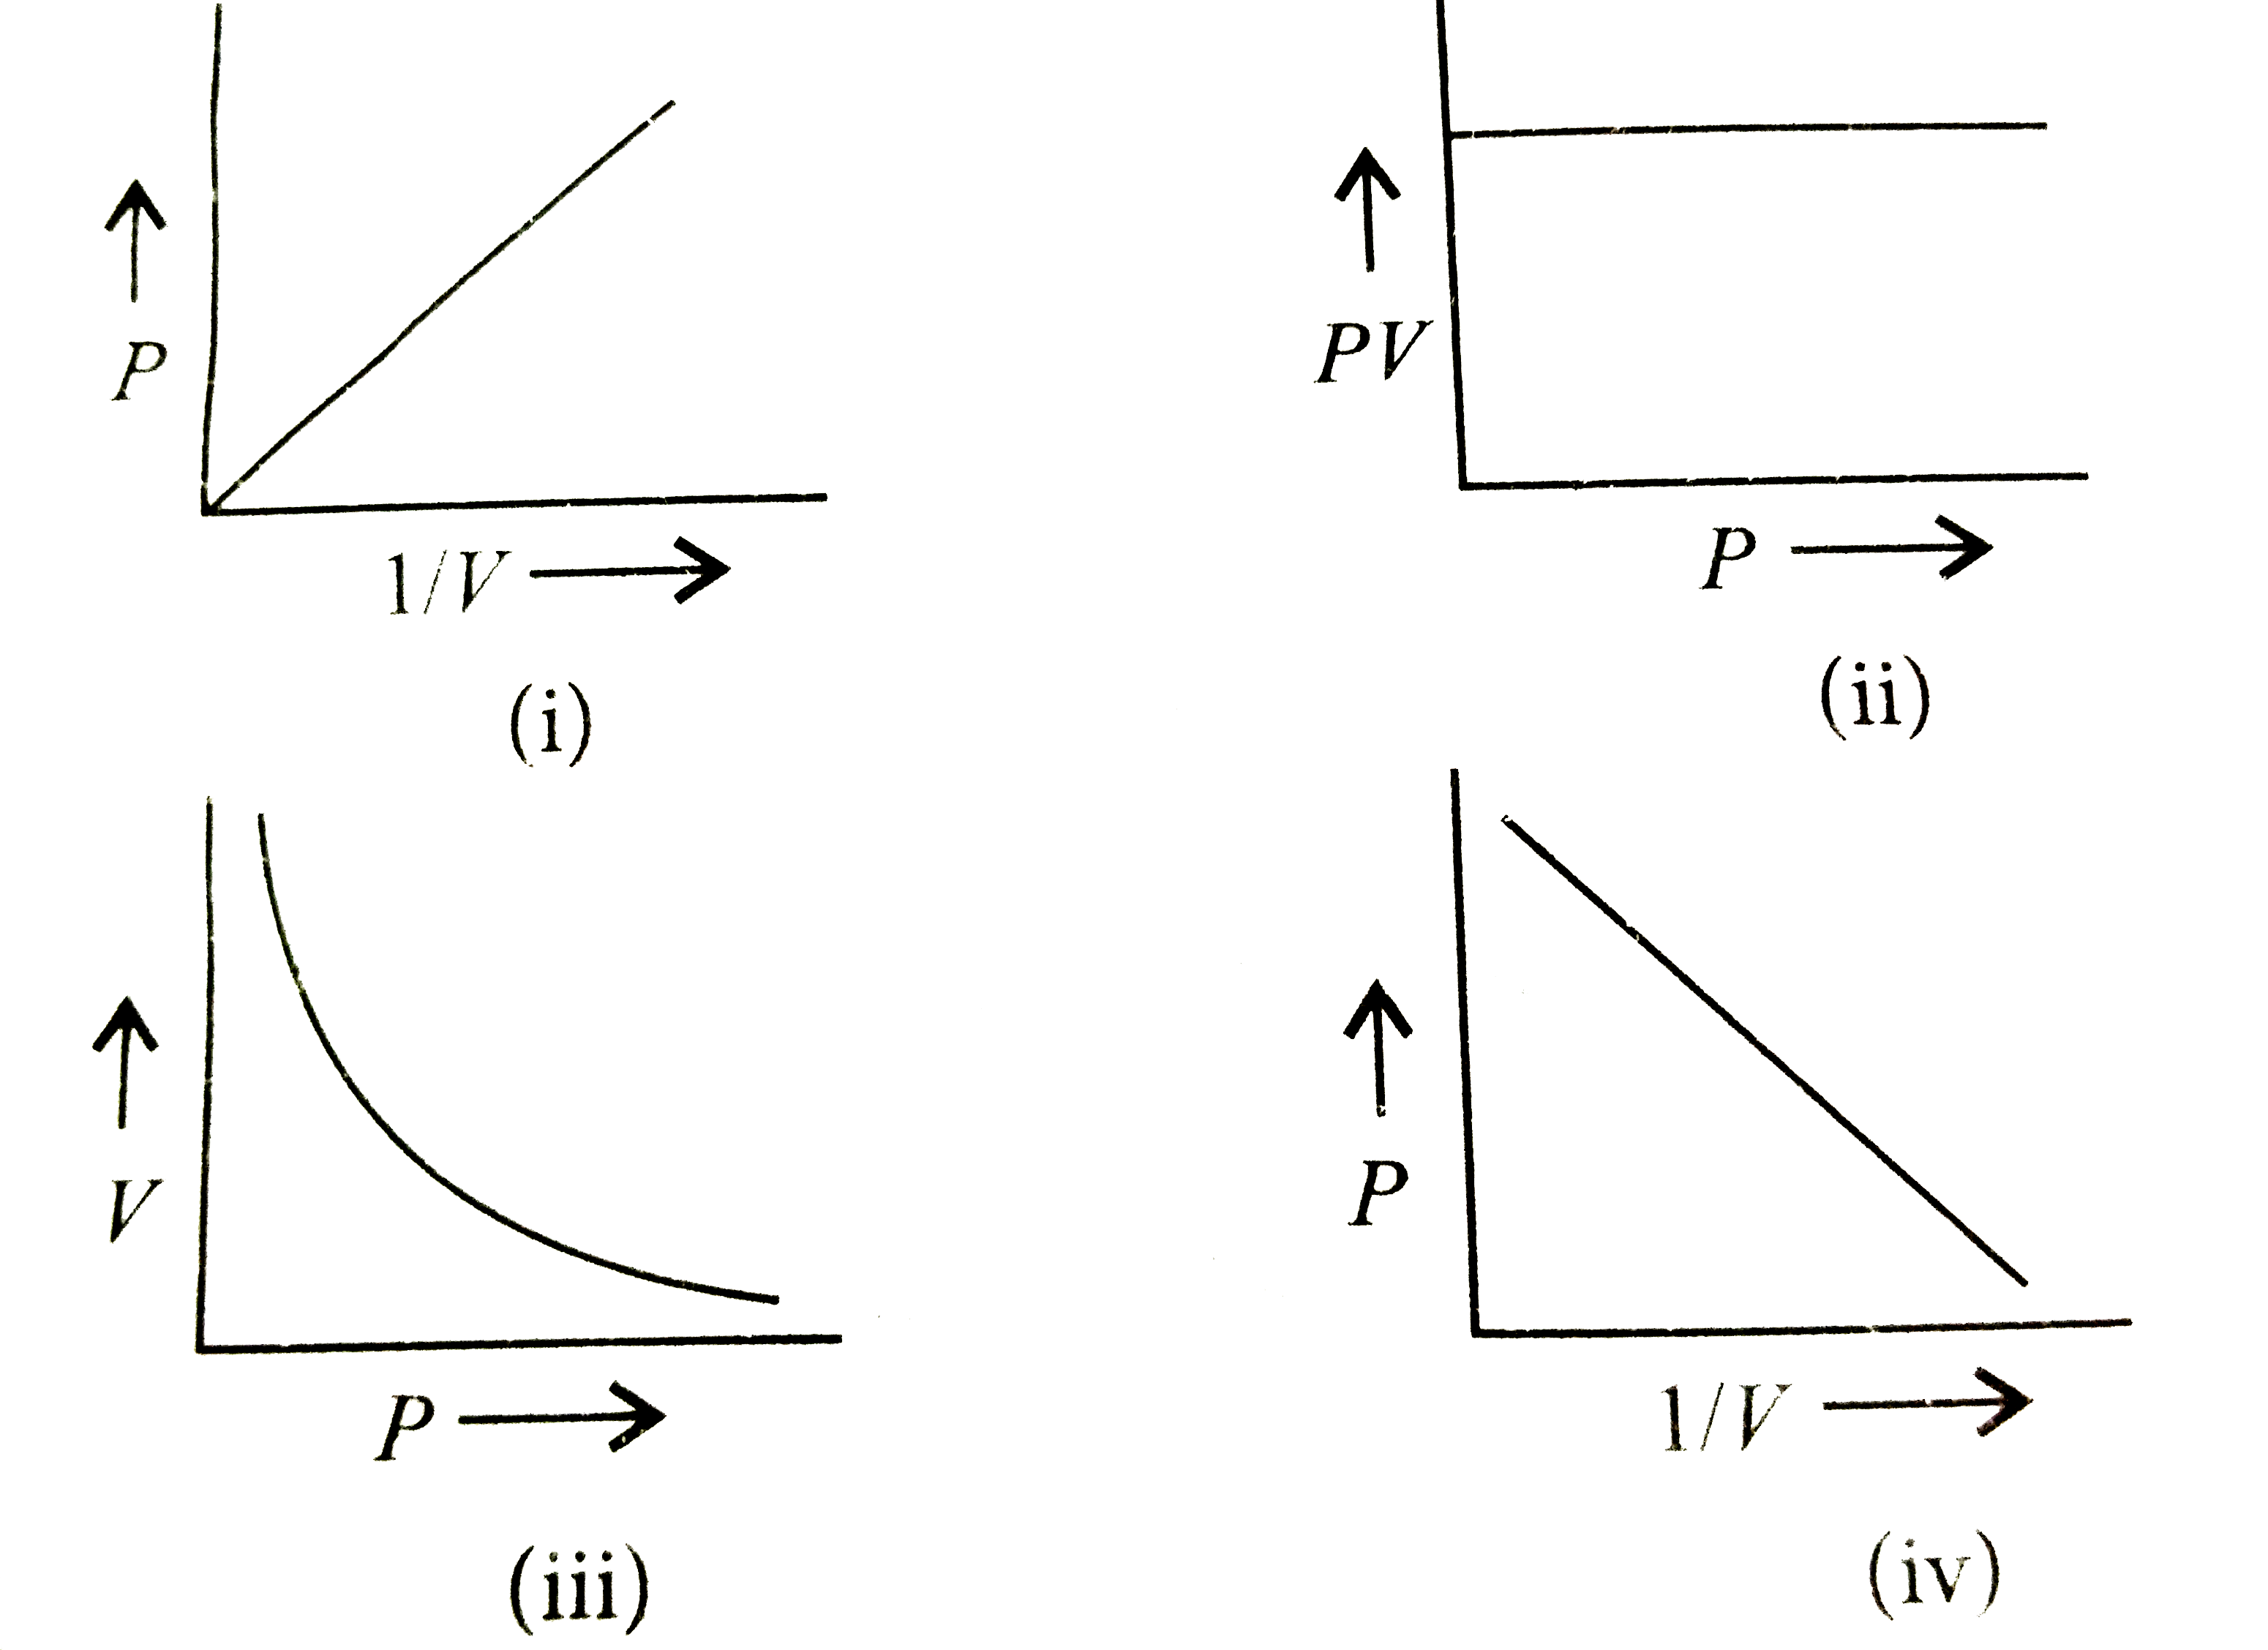 View Solution
which of the following graphs represents Charles' law correctly ?
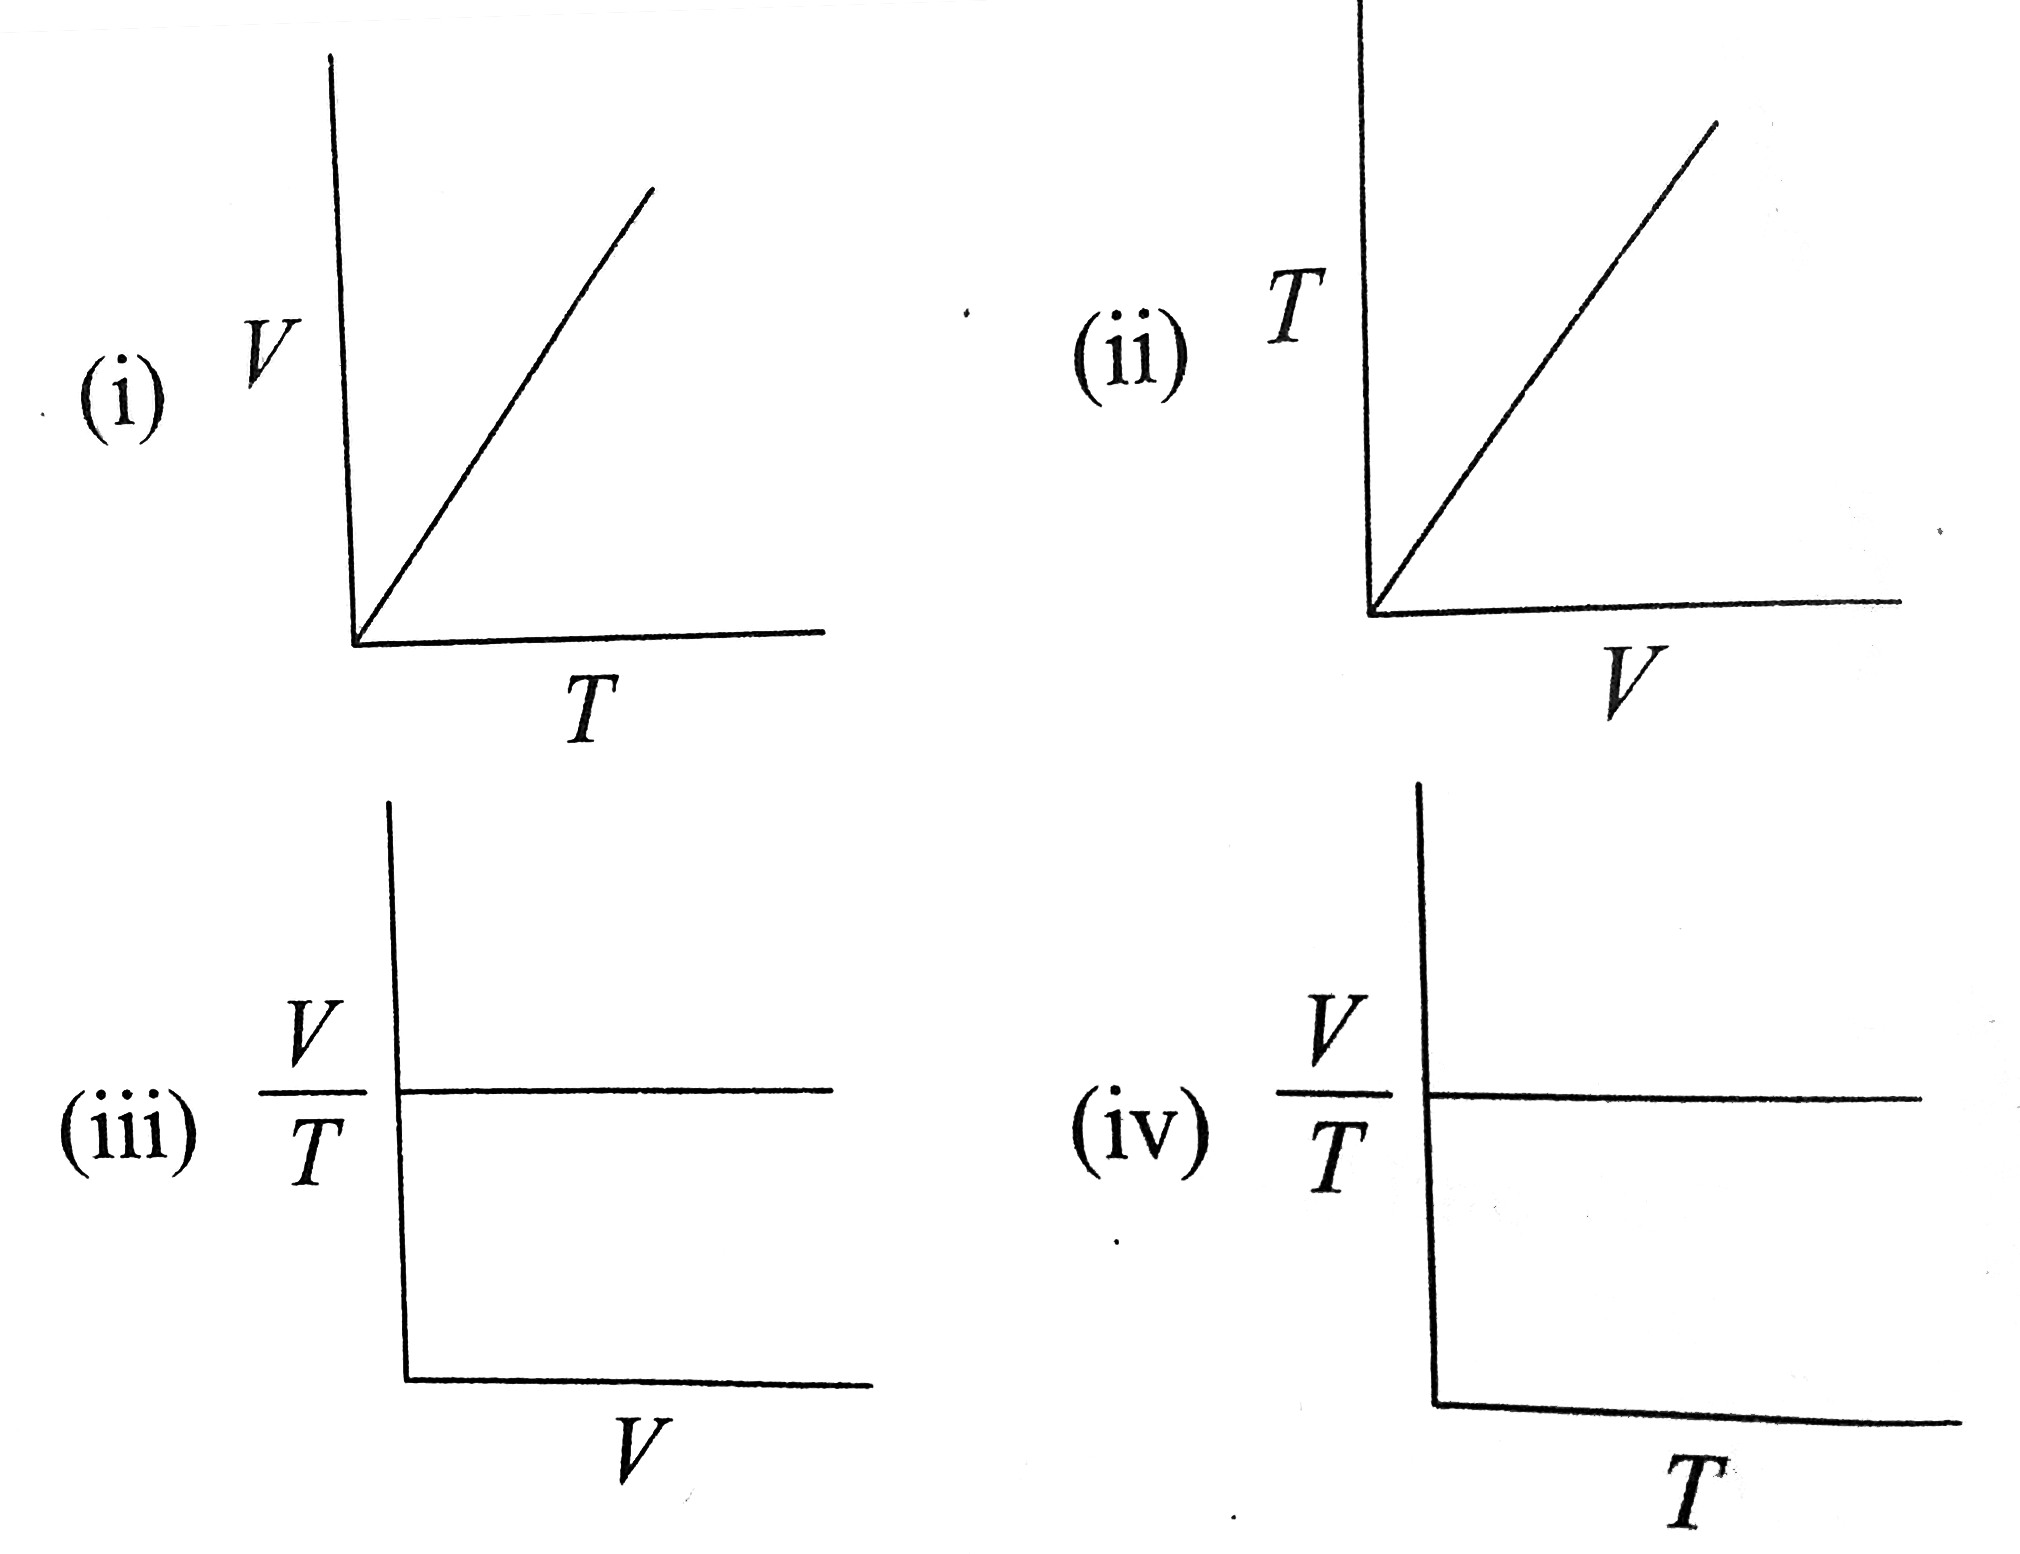 View Solution
Which of the following curves represent(s) Boyle's law?
View SolutionOne of the following represents the Boyle's law .
View SolutionWhich of the following represents the ohm's law ?
View Solution

