Which of the following graphs correctly gives the relationship between the rate of photosynthesis and light intensity
A

B

C

D

Text Solution
The correct Answer is:A
|
Updated on:21/07/2023
Similar Questions
Knowledge Check
- Question 1 - Select One
Which of the following graph is correctly represented?
A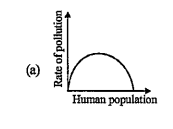 B
B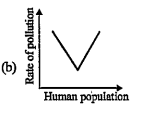 C
C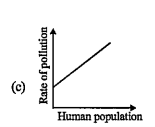 D
D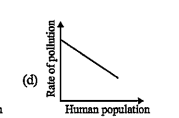
- Question 2 - Select One
Which one of the following graphs correctly gives the ideal gas behaviour ?
A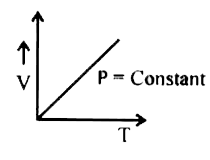 B
B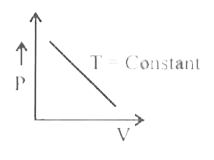 C
C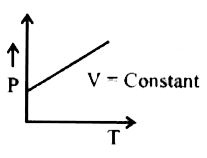 D
D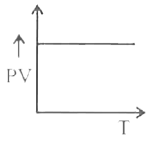
- Question 3 - Select One
Which of the following diagram correctly depicts the relationship between TC,TFC and TVC ?
A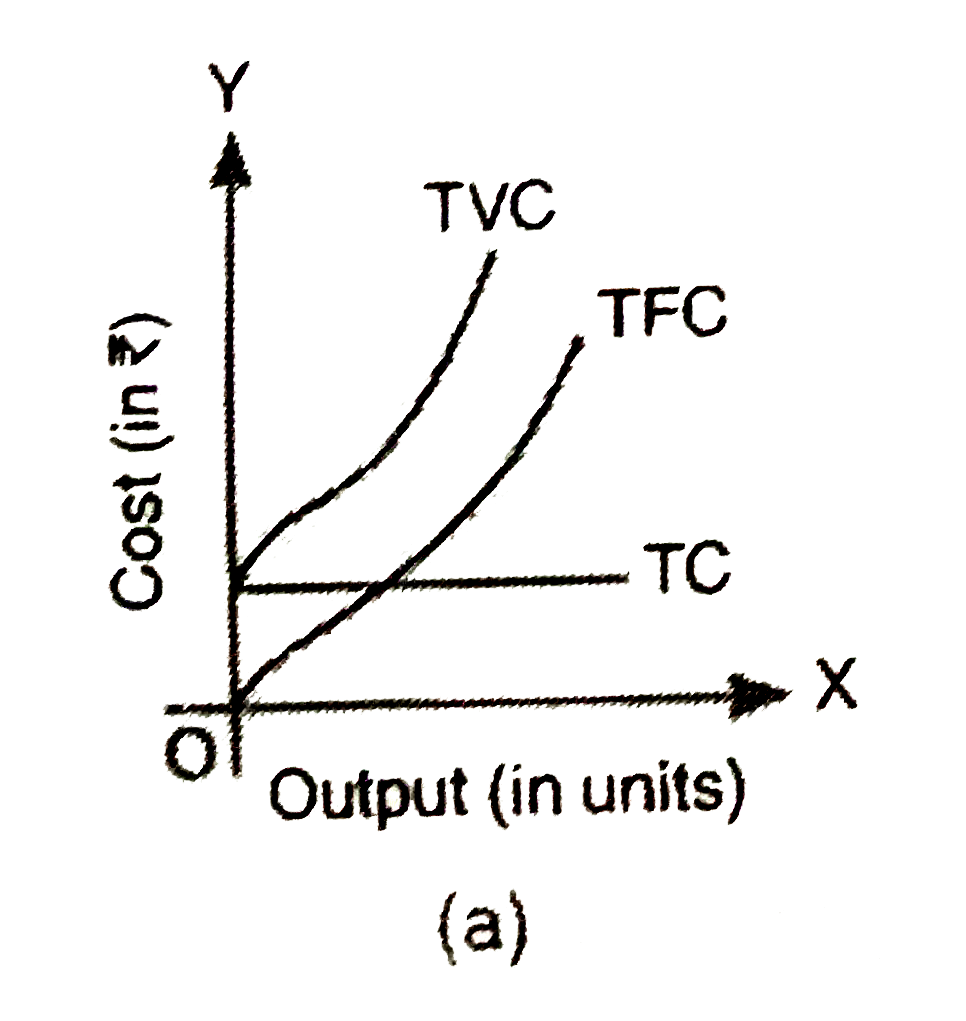 B
B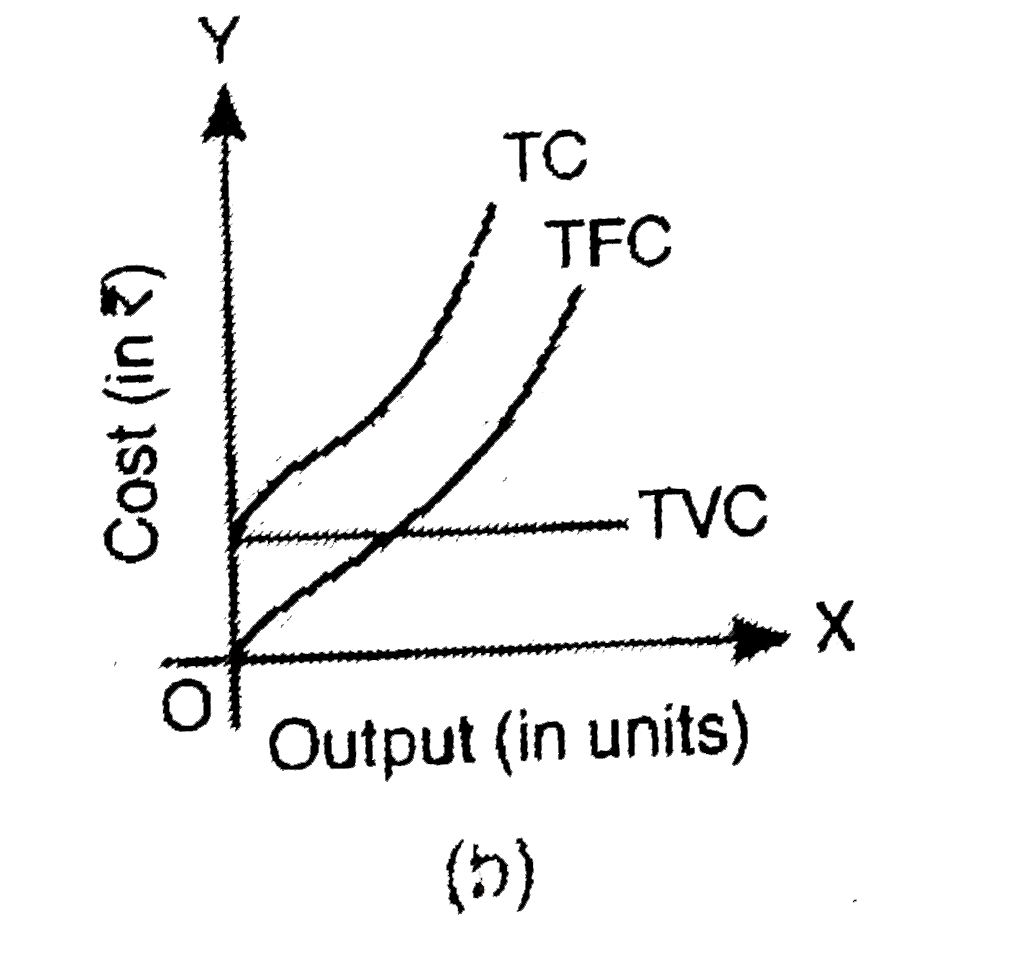 C
C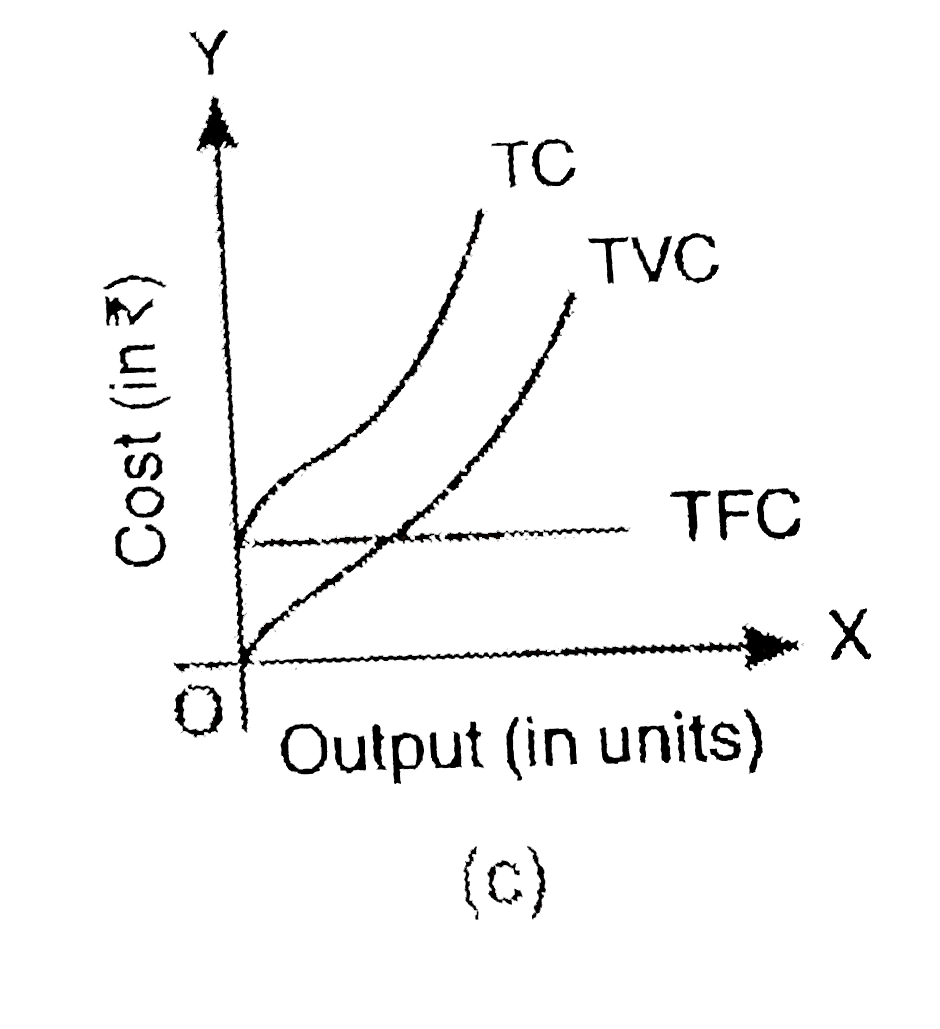 D
D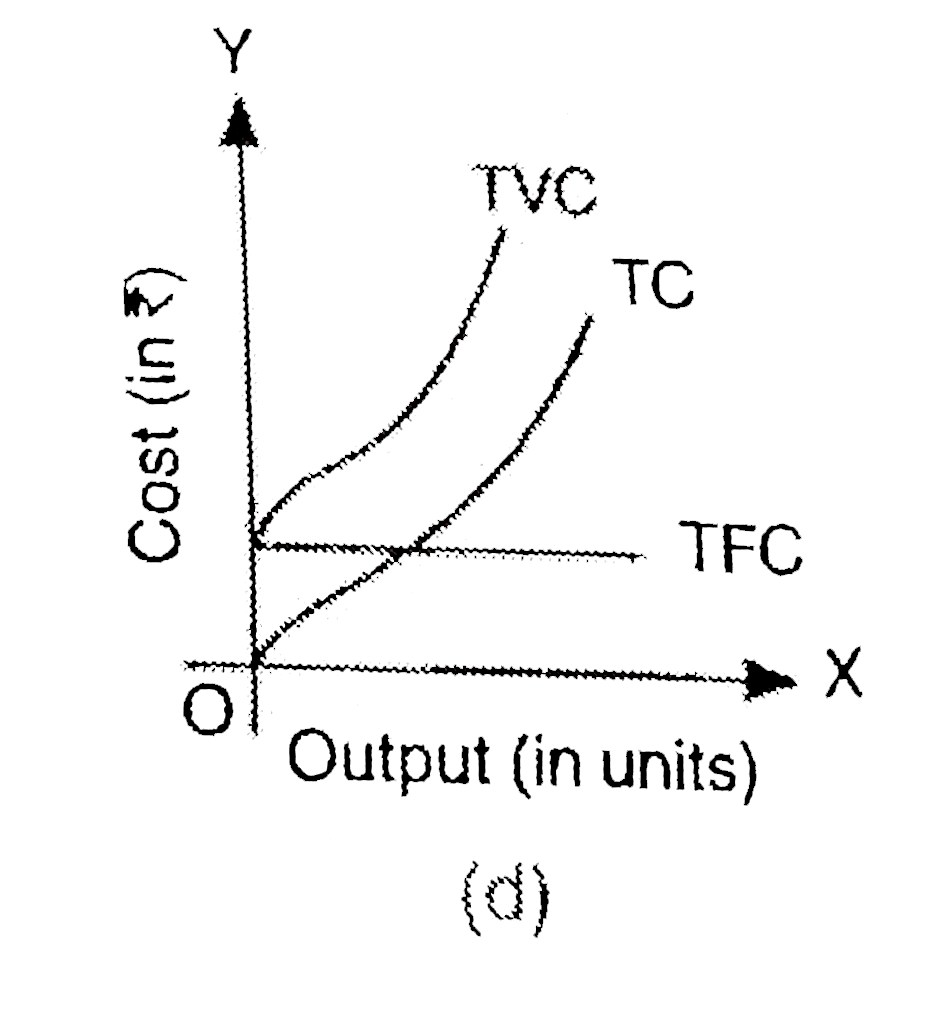
Which of the following graphs correctly depicts the rate of photosynthesis of sun plant (P) and shade plant (Q)?
View SolutionWhich of the following graphs correctly depicts the rate of photosynthesis of sun plant (P) and shade plant (Q)?
View SolutionWhich of the following graphs shows the relationship between the rate of an enzymatic activity and substrate concentration (S) ?
View SolutionWhich of the following graphs shows the relationship between the rate of an enzymatic activity and substrate concentration (S) ?
View SolutionWhich of the following diagrams correctly represents the relationship between automobile cars and motorcycles?
View Solution

