Which of the following graphs shows the relationship between the rate of an enzymatic activity and substrate concentration (S) ?
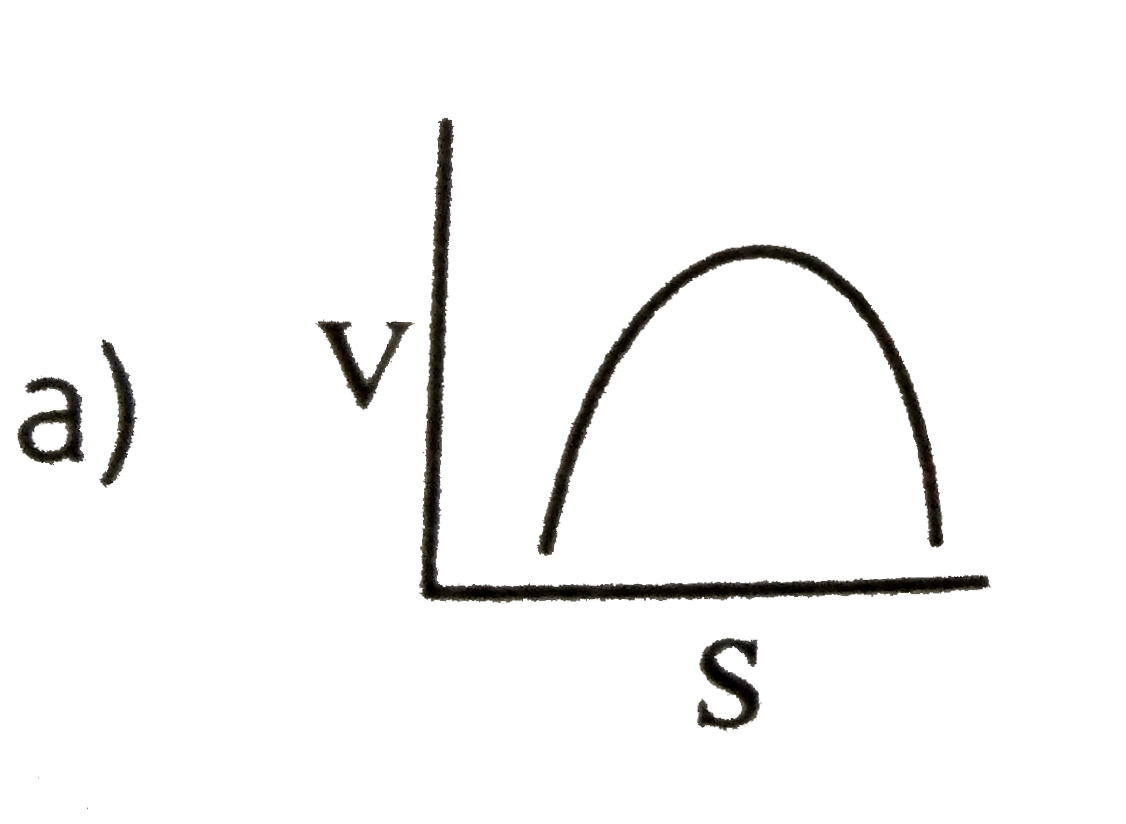
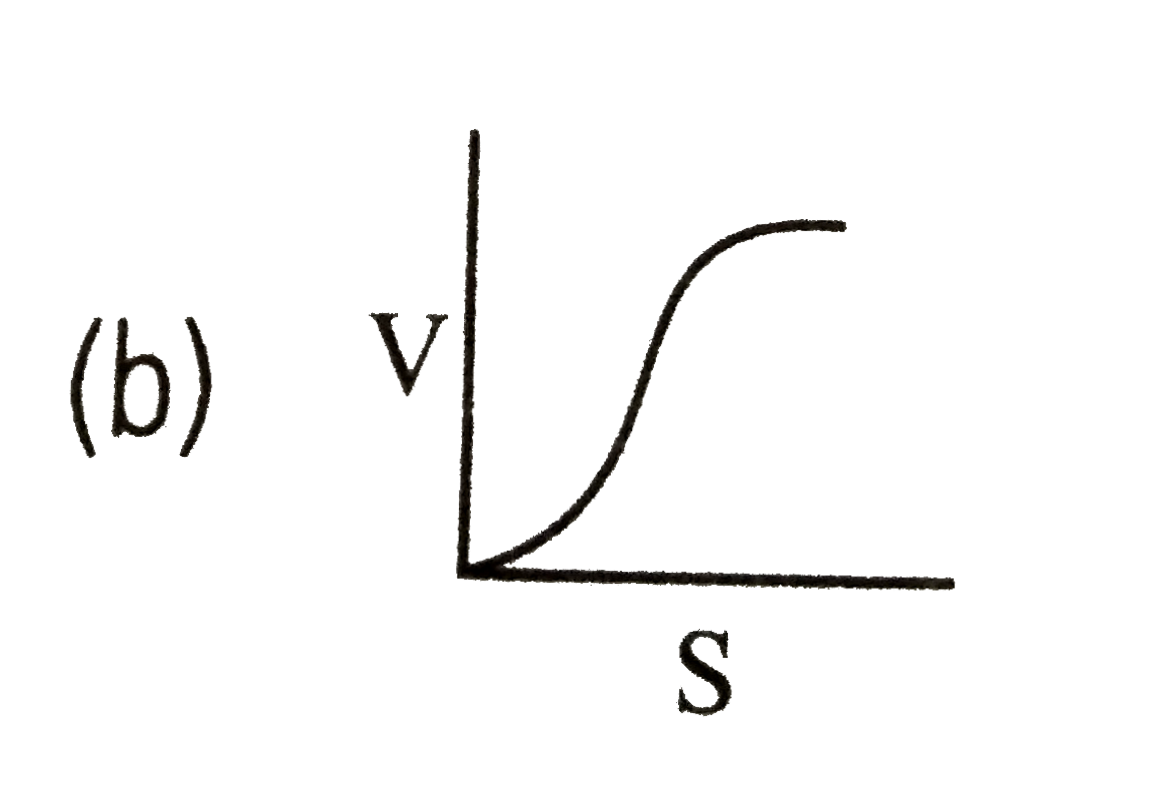
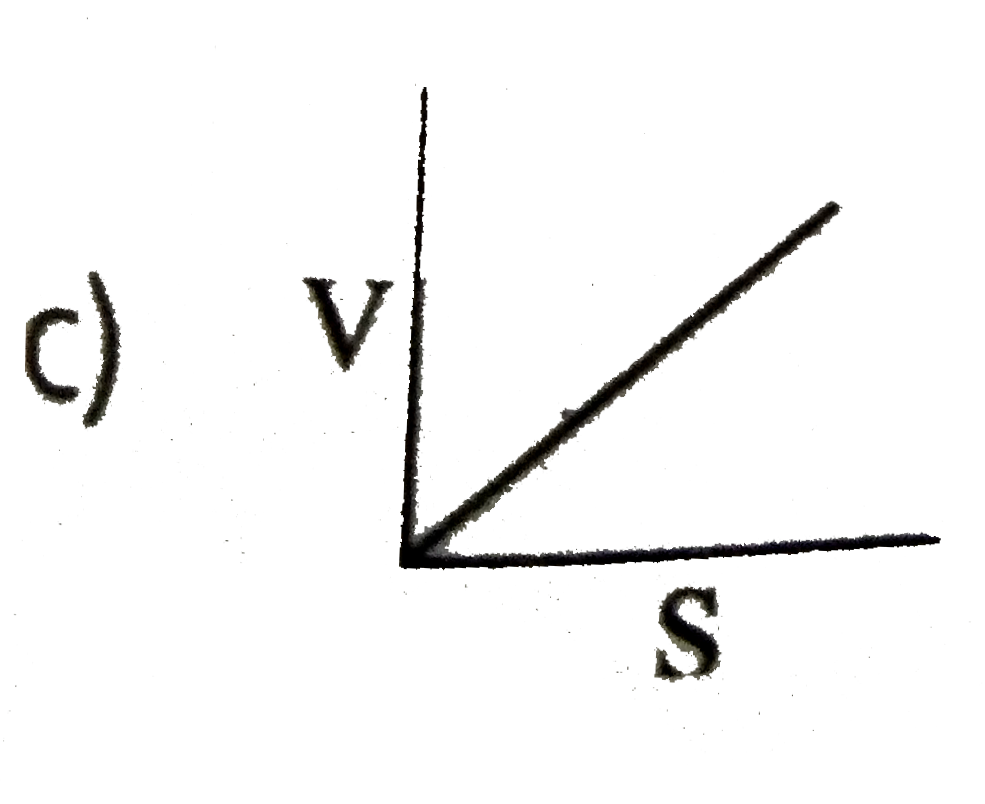
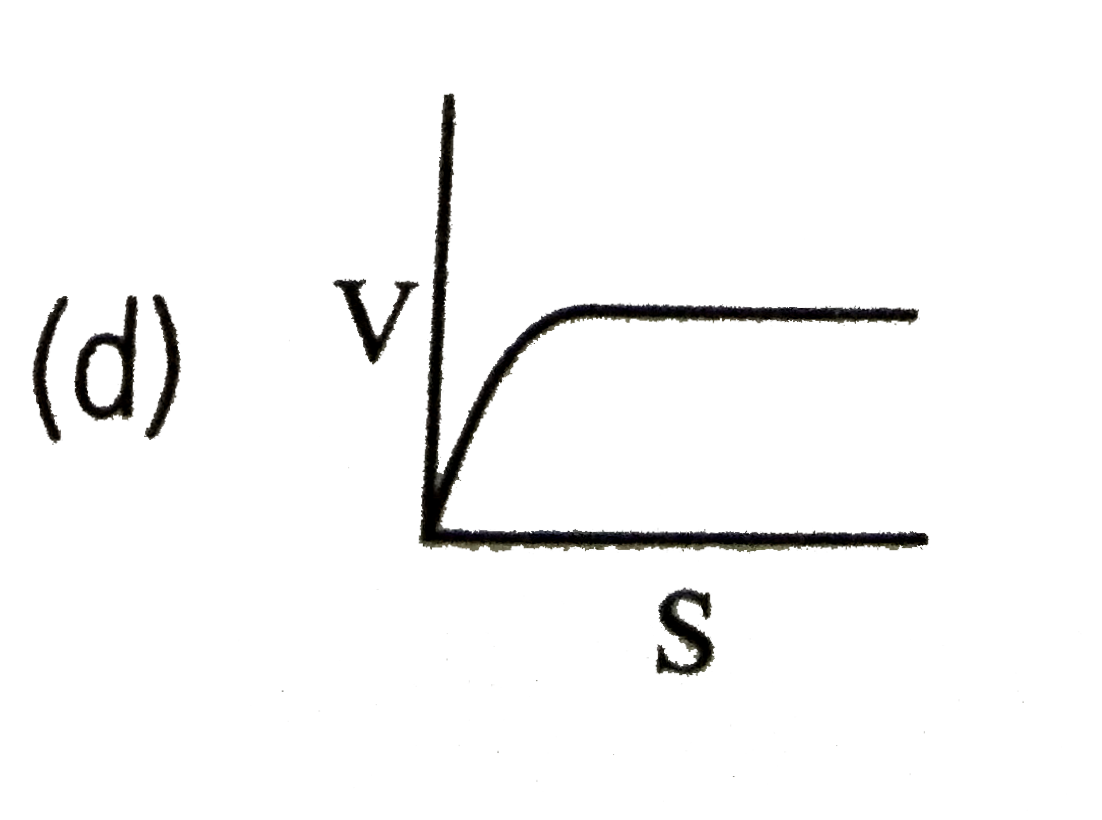
The correct Answer is:D
To determine the correct graph that shows the relationship between the rate of enzymatic activity and substrate concentration (S), we can follow these steps:
1. Understand the Variables:
- The x-axis represents substrate concentration (S).
- The y-axis represents the rate of enzymatic activity.
2. Initial Increase in Substrate Concentration:
- When the substrate concentration is low (e.g., 5 substrate molecules), there are plenty of enzyme molecules available to bind to the substrates.
- As the substrate concentration increases (e.g., from 5 to 10 substrate molecules), the rate of enzymatic activity increases linearly because more substrate molecules are available for the enzymes to act upon.
3. Saturation Point:
- As we continue to increase the substrate concentration (e.g., to 20 substrate molecules), we reach a point where all enzyme active sites are occupied.
- In this case, even if we add more substrate, the rate of enzymatic activity will not increase further because there are no free enzyme active sites available to bind with the additional substrate.
4. Graph Representation:
- The graph will initially show a linear increase in the rate of enzymatic activity as substrate concentration increases.
- After reaching a certain point (saturation), the graph will plateau, indicating that the rate of enzymatic activity has reached its maximum and does not increase further despite increasing substrate concentration.
5. Identify the Correct Graph:
- The correct representation of this relationship is a graph that shows a linear increase followed by a plateau. This is typically represented as a hyperbolic curve in enzyme kinetics, specifically the Michaelis-Menten curve.
- Based on the options provided, option D is the one that correctly represents this relationship.
Final Answer:
The correct graph that shows the relationship between the rate of enzymatic activity and substrate concentration (S) is option D.
---
- The x-axis represents substrate concentration (S).
- The y-axis represents the rate of enzymatic activity.
- When the substrate concentration is low (e.g., 5 substrate molecules), there are plenty of enzyme molecules available to bind to the substrates.
- As the substrate concentration increases (e.g., from 5 to 10 substrate molecules), the rate of enzymatic activity increases linearly because more substrate molecules are available for the enzymes to act upon.
- As we continue to increase the substrate concentration (e.g., to 20 substrate molecules), we reach a point where all enzyme active sites are occupied.
- In this case, even if we add more substrate, the rate of enzymatic activity will not increase further because there are no free enzyme active sites available to bind with the additional substrate.
- The graph will initially show a linear increase in the rate of enzymatic activity as substrate concentration increases.
- After reaching a certain point (saturation), the graph will plateau, indicating that the rate of enzymatic activity has reached its maximum and does not increase further despite increasing substrate concentration.
- The correct representation of this relationship is a graph that shows a linear increase followed by a plateau. This is typically represented as a hyperbolic curve in enzyme kinetics, specifically the Michaelis-Menten curve.
- Based on the options provided, option D is the one that correctly represents this relationship.
The correct graph that shows the relationship between the rate of enzymatic activity and substrate concentration (S) is option D.
Topper's Solved these Questions
- BOOK - NCERT FINGERTPS ENGLISHCHAPTER - BIOMOLECULESEXERCISE - Biomolecules137videos
BIOMOLECULES
- BOOK - NCERT FINGERTPS ENGLISHCHAPTER - BIOLOGICAL CLASSIFICATIONEXERCISE - Biological Classification132videos
BIOLOGICAL CLASSIFICATION
- BOOK - NCERT FINGERTPS ENGLISHCHAPTER - BODY FLUIDS AND CIRCULATIONEXERCISE - Body Fluids And Circulation151videos
BODY FLUIDS AND CIRCULATION
Similar Questions
Knowledge Check
- Question 1 - Select One
Which of the following graphs shows a stong positive association between x and y?
A B
B C
C D
D
- Question 2 - Select One
Which of the following formulae does not show the correct relationship ?
AB.O.=12(Nb−Na)BB.O.∝1Bond lengthCB.O.∝1Bond dissociation energyDNb>Na,B.O.=+ve
Which of the following shows optical activity?
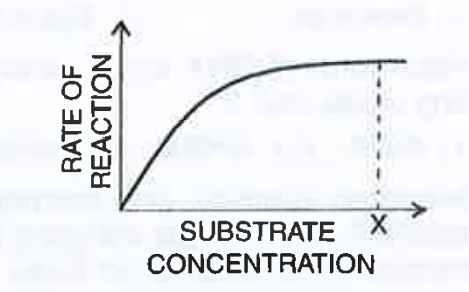
View SolutionThe given graph is showing the relationship between the rate of enzyme reaction and concentration of substrate. At concentration of substrate greater than X, the
 View Solution
Which of the following pair does not show correct relationship ?
View SolutionWhich of the following does not show the relationship between Boyle's law and Charles' law?
View SolutionLichens show symbiotic relationships between
View SolutionWhich of the following will show optical activity
View Solution

