Which of the following graphs correctly shows the reasoraption of sodium and water at specific sites in the tubule
A

B

C

D

Text Solution
The correct Answer is:C
|
Similar Questions
Knowledge Check
Which of the following graph is correctly represented?
A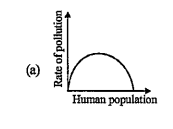 B
B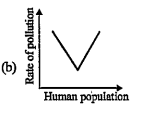 C
C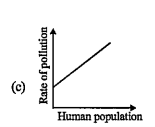 D
D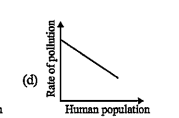
Which of the following correctly shows the order of decreasing basicity -
AAniline > o-nitroaniline > p-nitroanilne > m-nitroanilineBAnili ne > p -nitroaniline > o-nitroaniline > m-nitroanilineCAniline > m-nitroaniline > p- nitroaniline >− o-nitroanilineDo-Nitroaniline > p-nitroaniline > aniline > m-nitroanilineWhich one of the following graphs correctly gives the ideal gas behaviour ?
A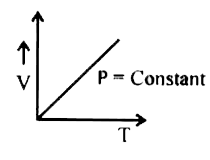 B
B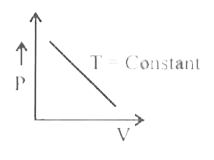 C
C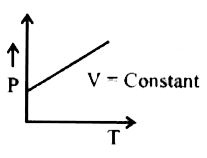 D
D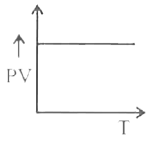
Which of the following correctly depicts the recongnition site for EcoRI ?
View SolutionWhich of the following graph shows the variationi of density of water increase in temperature ?
View SolutionWhich of the following graph shows the variationi of density of water increase in temperature ?
View SolutionWhich of the following graphs represents freundlich adsorption isotherm?
View SolutionWhich of the following option correctly defines the function of sodium-potassium pump?
View Solution
