Which of the following graph shows the variationi of density of water increase in temperature ?
The correct Answer is:A
To determine which graph shows the variation of the density of water with temperature, we need to understand the relationship between temperature and the density of water.
1. Understanding Density of Water:
- Water has a unique property where its density varies with temperature. It reaches its maximum density at 4 degrees Celsius.
2. Behavior Below 4 Degrees Celsius:
- As the temperature decreases from room temperature (around 20 degrees Celsius) to 0 degrees Celsius, the density of water increases. This is because the water molecules come closer together as it cools down.
3. Behavior Above 4 Degrees Celsius:
- When the temperature increases beyond 4 degrees Celsius, the density of water starts to decrease. This is due to the thermal expansion of water, where the molecules move further apart as the temperature rises.
4. Graph Characteristics:
- The correct graph should show that the density increases as the temperature approaches 4 degrees Celsius from lower temperatures and then decreases as the temperature goes beyond 4 degrees Celsius.
5. Analyzing the Graphs:
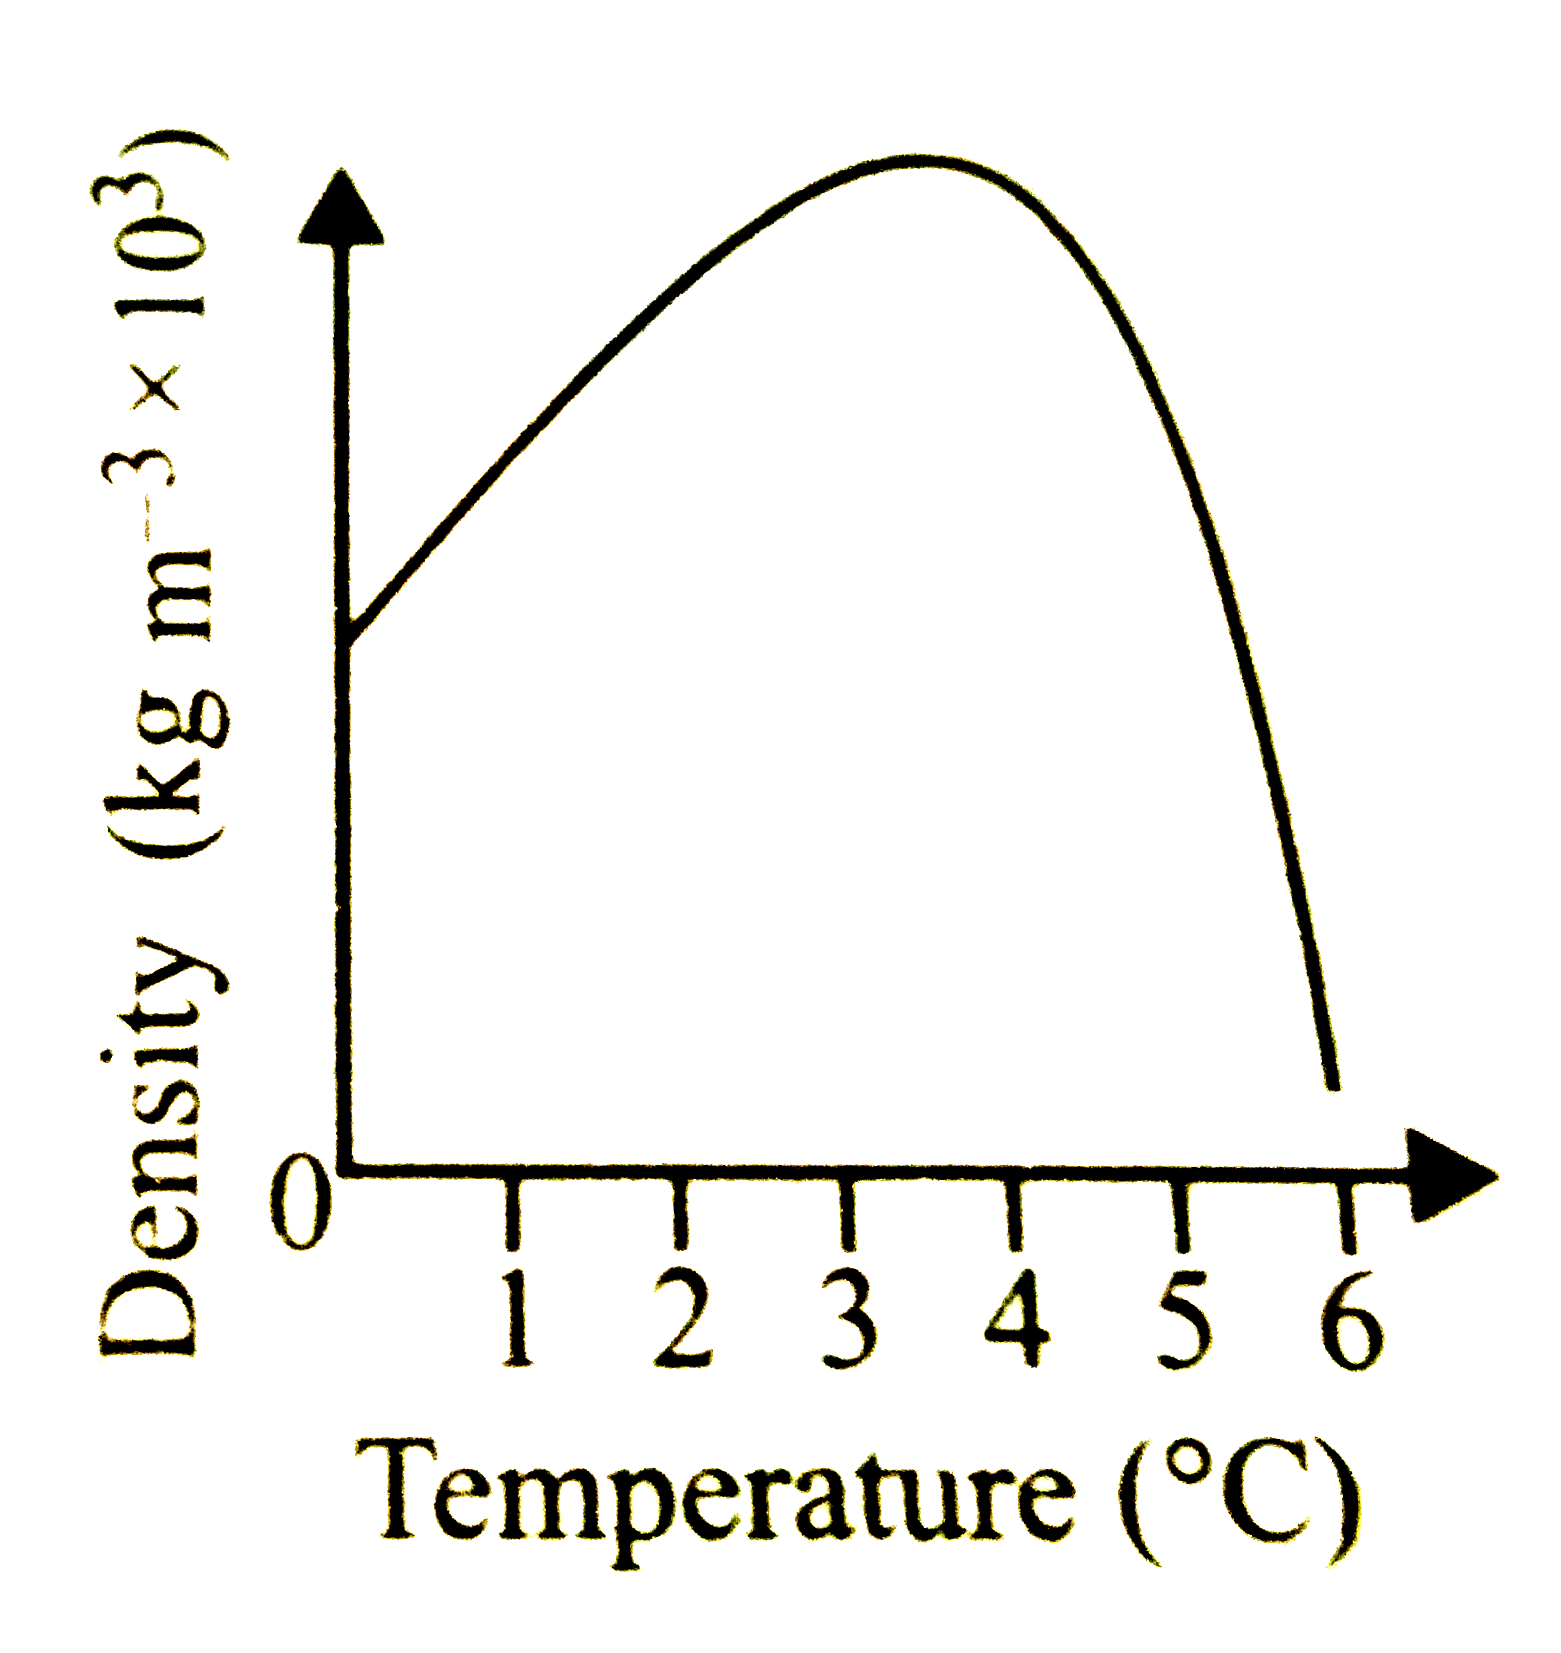
- Graph 1: Shows maximum density at 4 degrees Celsius, which aligns with our understanding.
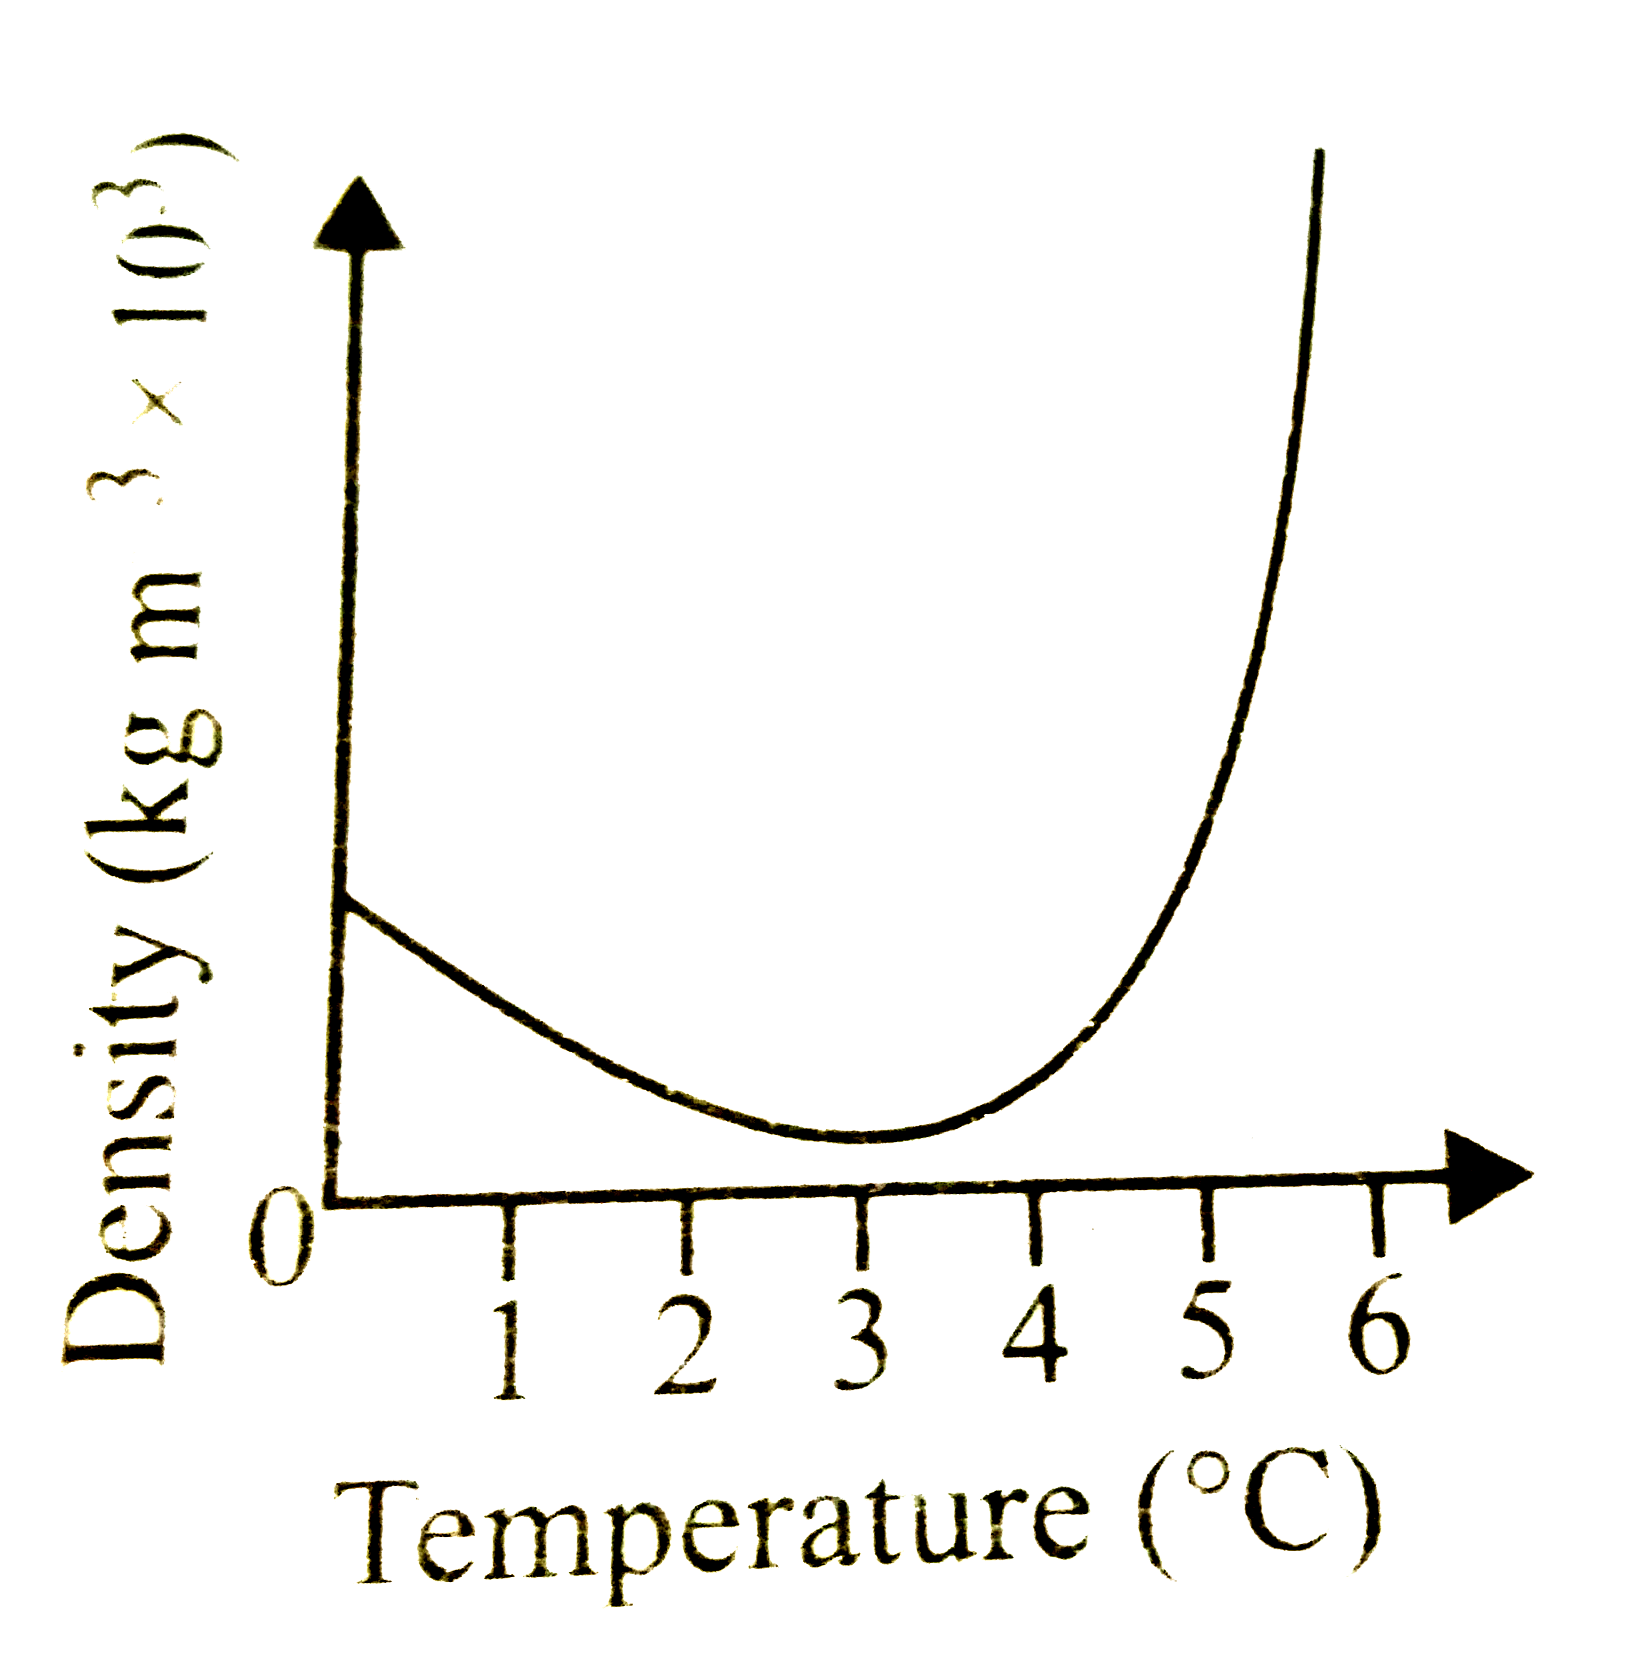
- Graph 2: Shows minimum density at 4 degrees Celsius, which is incorrect.
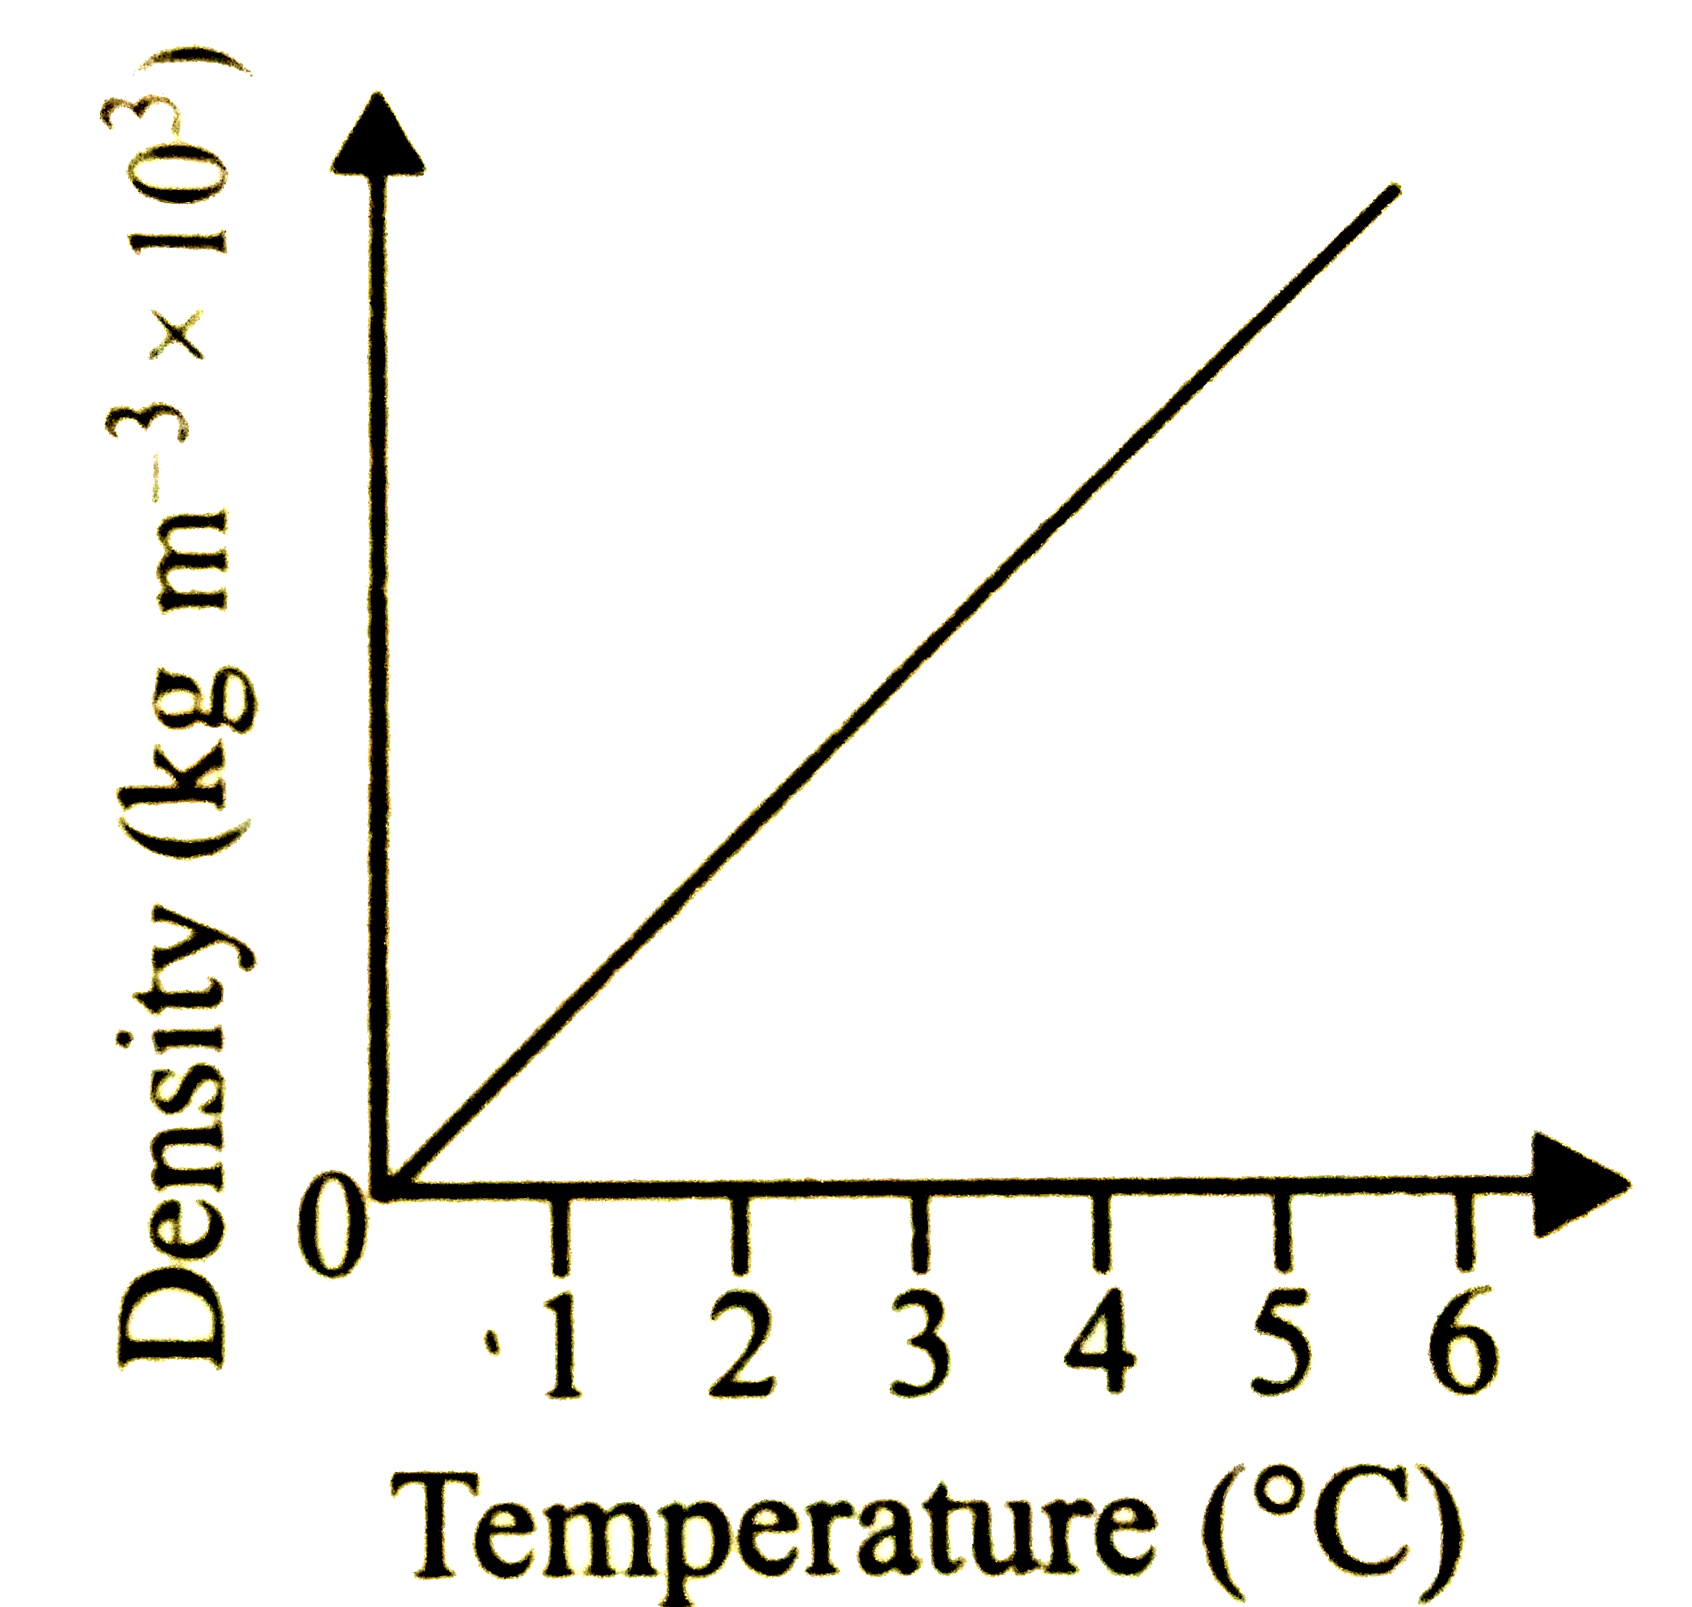
- Graph 3: Depicts a linear relationship, which does not represent the behavior of water density.
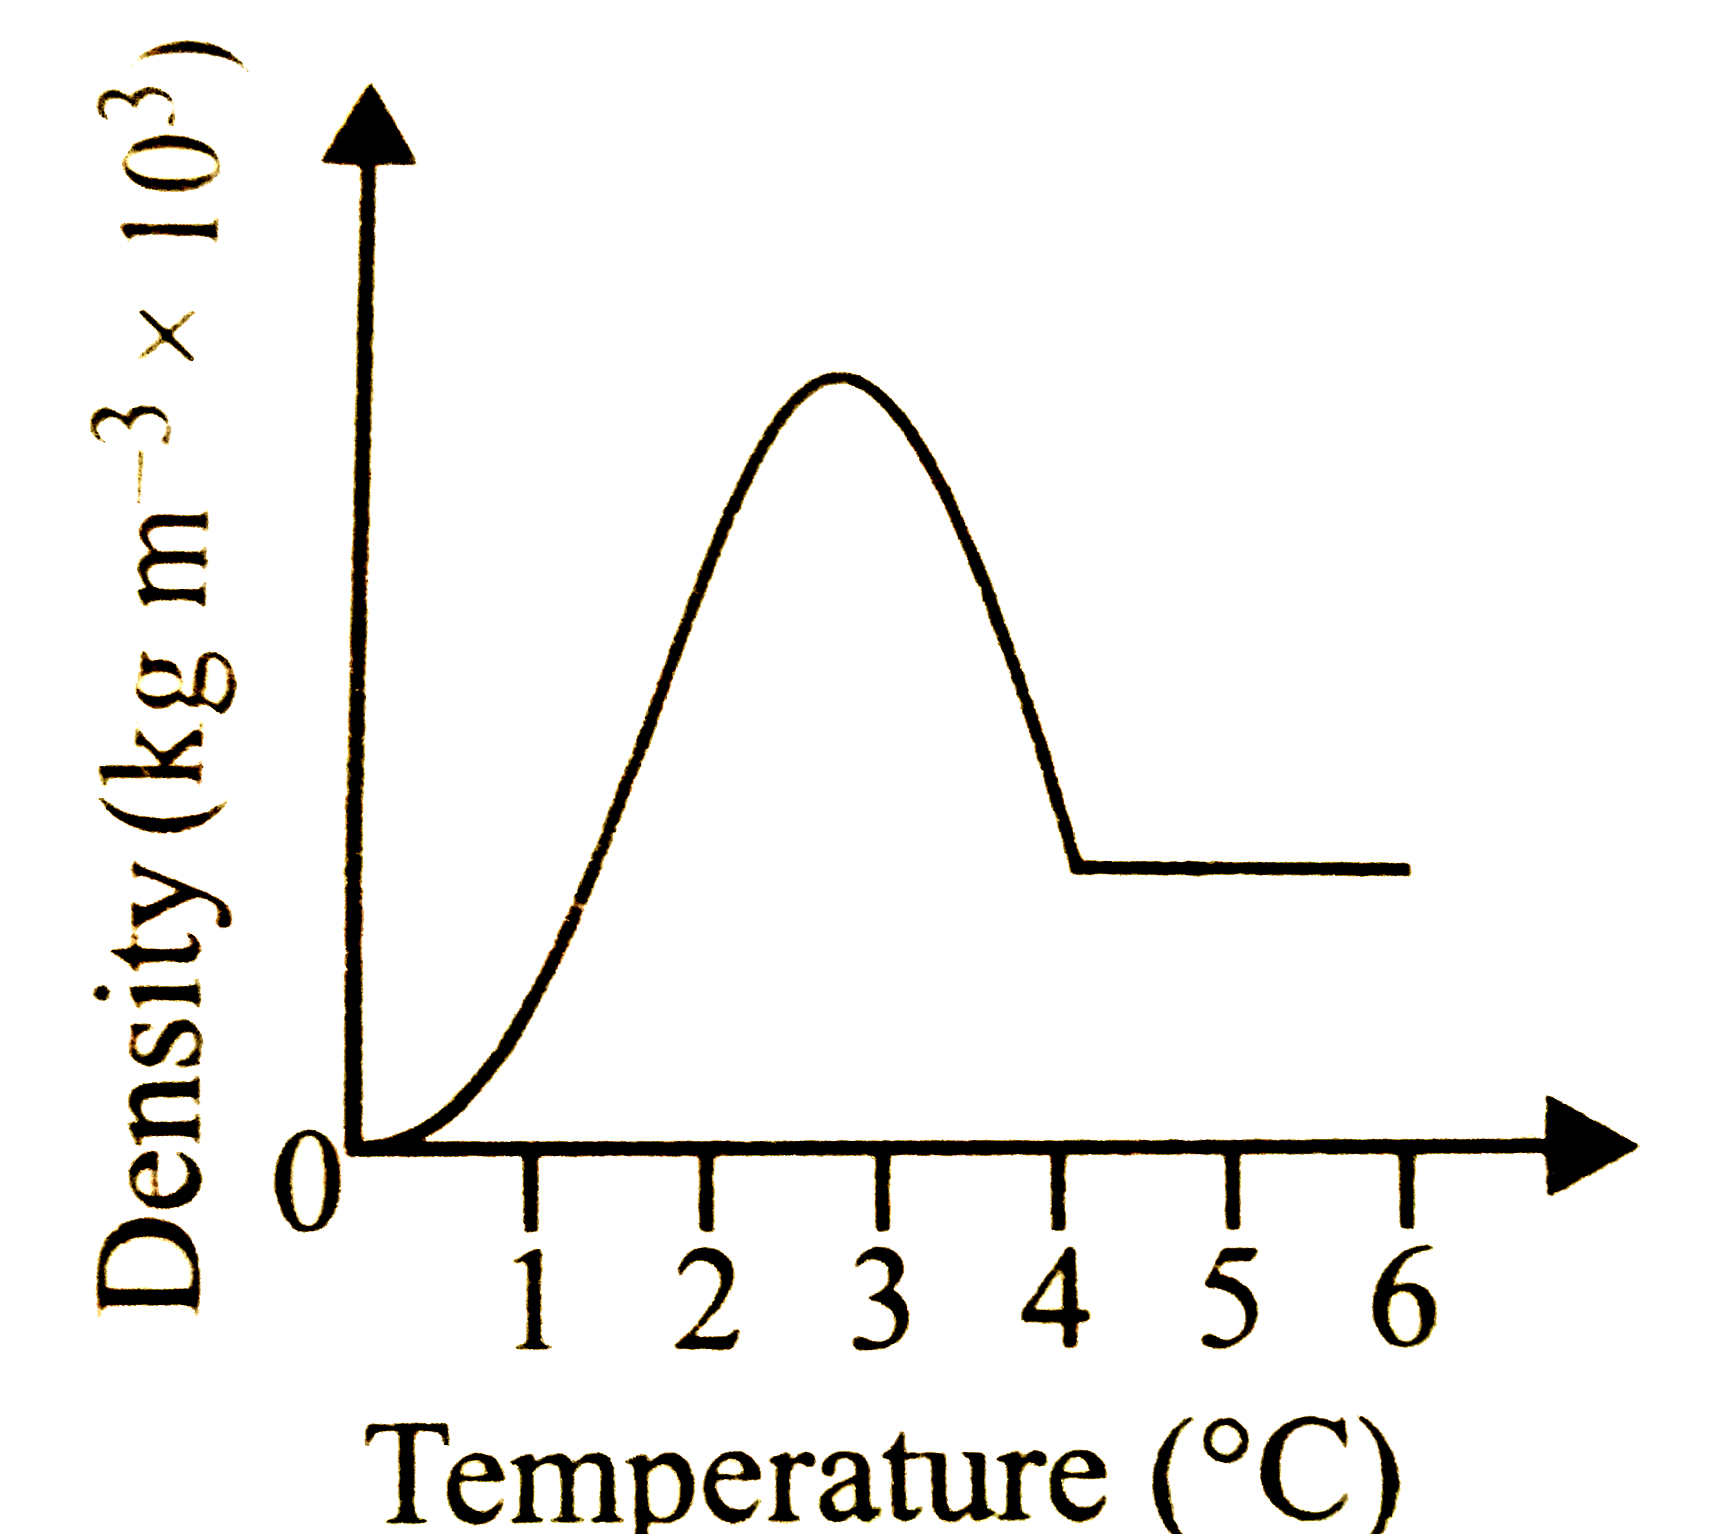
- Graph 4: Does not show maximum density at 4 degrees Celsius.
6. Conclusion:
- The correct graph that represents the variation of density of water with temperature is Graph 1, as it accurately depicts the maximum density at 4 degrees Celsius.
- Water has a unique property where its density varies with temperature. It reaches its maximum density at 4 degrees Celsius.
- As the temperature decreases from room temperature (around 20 degrees Celsius) to 0 degrees Celsius, the density of water increases. This is because the water molecules come closer together as it cools down.
- When the temperature increases beyond 4 degrees Celsius, the density of water starts to decrease. This is due to the thermal expansion of water, where the molecules move further apart as the temperature rises.
- The correct graph should show that the density increases as the temperature approaches 4 degrees Celsius from lower temperatures and then decreases as the temperature goes beyond 4 degrees Celsius.
- Graph 1: Shows maximum density at 4 degrees Celsius, which aligns with our understanding.
- Graph 2: Shows minimum density at 4 degrees Celsius, which is incorrect.
- Graph 3: Depicts a linear relationship, which does not represent the behavior of water density.
- Graph 4: Does not show maximum density at 4 degrees Celsius.
- The correct graph that represents the variation of density of water with temperature is Graph 1, as it accurately depicts the maximum density at 4 degrees Celsius.
Topper's Solved these Questions
- BOOK - NCERT FINGERTPS ENGLISHCHAPTER - THERMAL PROPERTIES OF MATTEREXERCISE - Specific Heat5videos
THERMAL PROPERTIES OF MATTER
- BOOK - NCERT FINGERTPS ENGLISHCHAPTER - THERMAL PROPERTIES OF MATTEREXERCISE - Calorimetery4videos
THERMAL PROPERTIES OF MATTER
- BOOK - NCERT FINGERTPS ENGLISHCHAPTER - THERMAL PROPERTIES OF MATTEREXERCISE - Measurement of Temperature2videos
THERMAL PROPERTIES OF MATTER
- BOOK - NCERT FINGERTPS ENGLISHCHAPTER - SYSTEM OF PARTICLES AND ROTATIONAL MOTIONSEXERCISE - NCERT Exemplar8videos
SYSTEM OF PARTICLES AND ROTATIONAL MOTIONS
- BOOK - NCERT FINGERTPS ENGLISHCHAPTER - THERMODYNAMICSEXERCISE - Assertion And Reason15videos
THERMODYNAMICS
Similar Questions
Knowledge Check
- Question 1 - Select One
Which of the following reactions shows reduction of water ?
A2H2O+2Na→2NaOH+H2B6CO2+12H2O→C6H12O6+6H2O+6O2C2F2+2H2O→4H++4F−+O2DP4O10+6H2O→4H3PO4 - Question 2 - Select One
Which of the following is the graph showing stress-strain variation for elastomers ?
A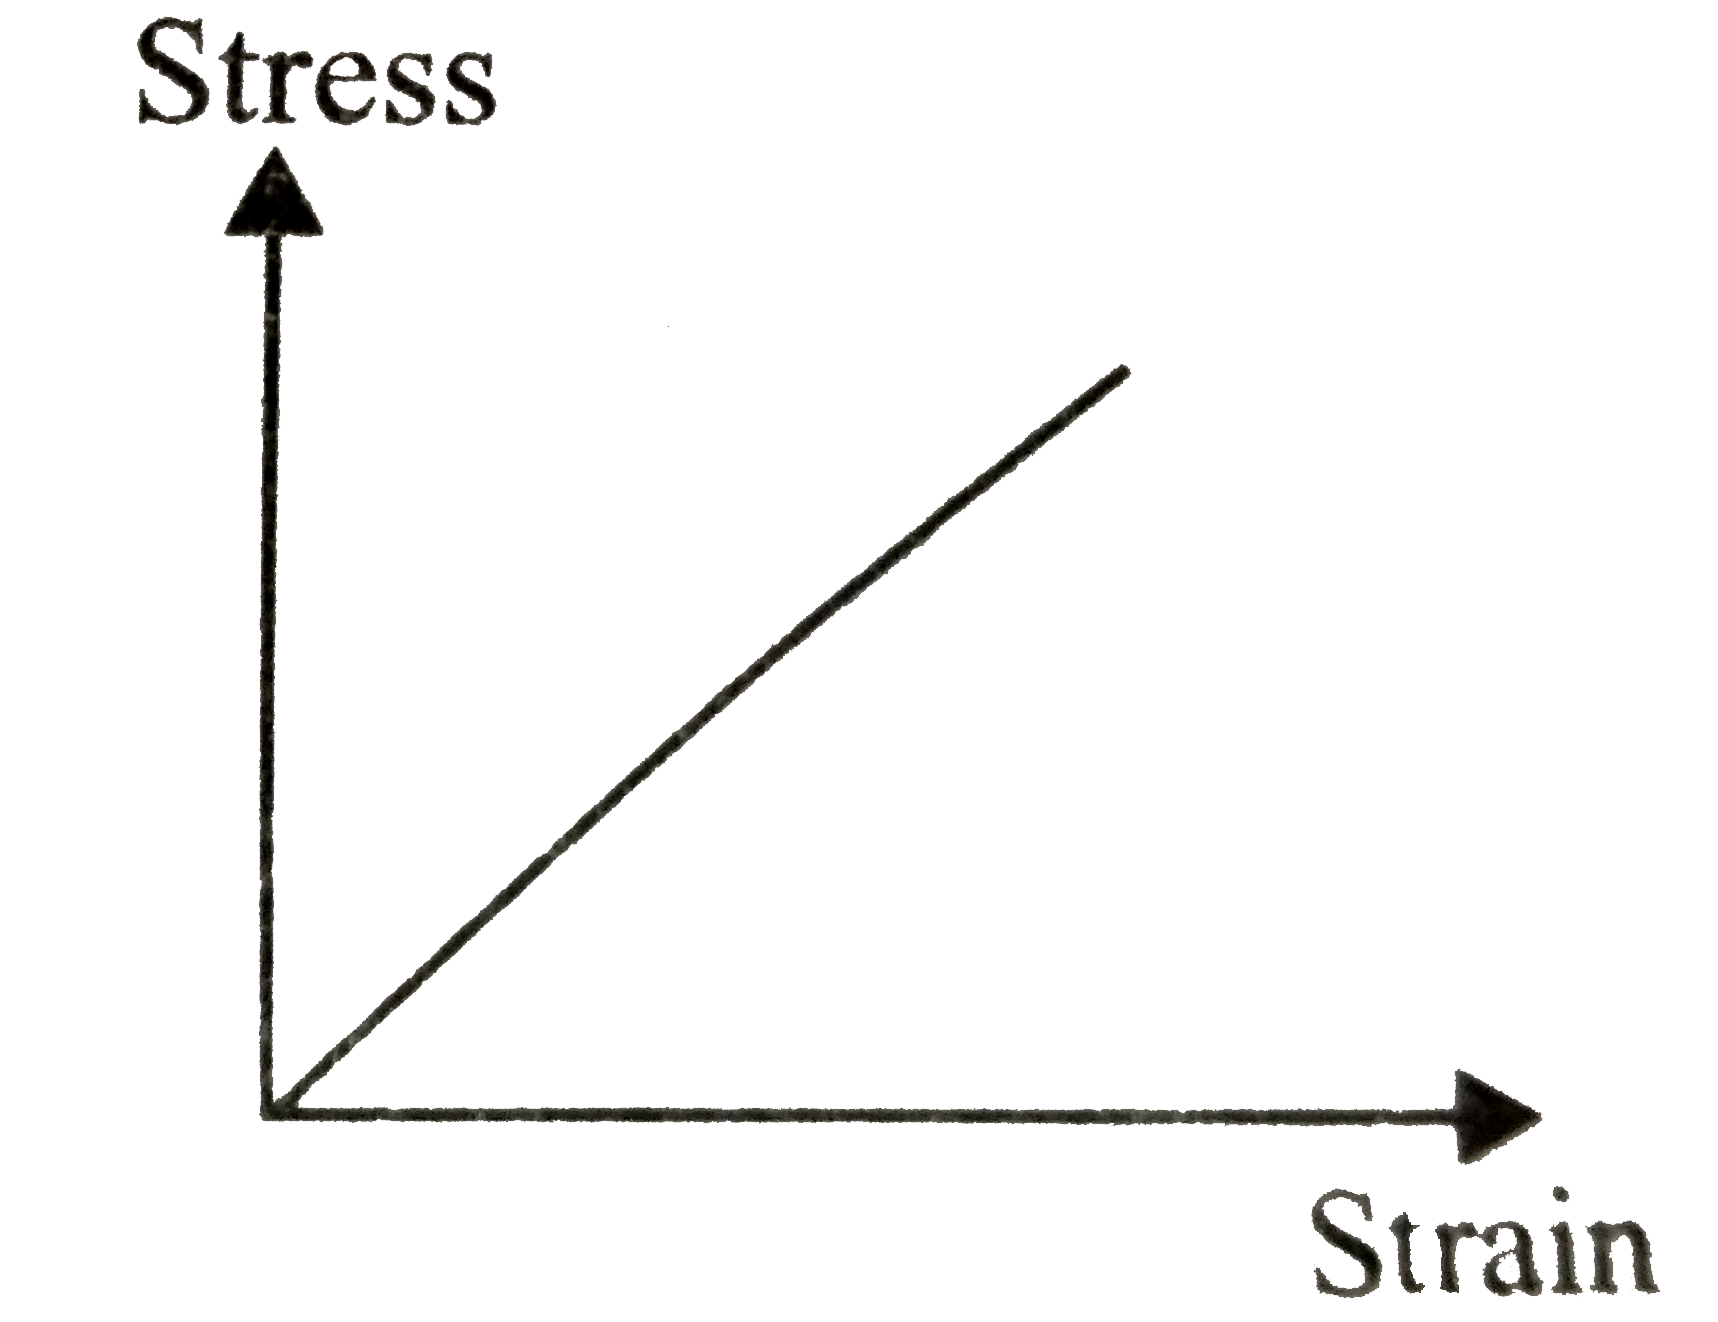 B
B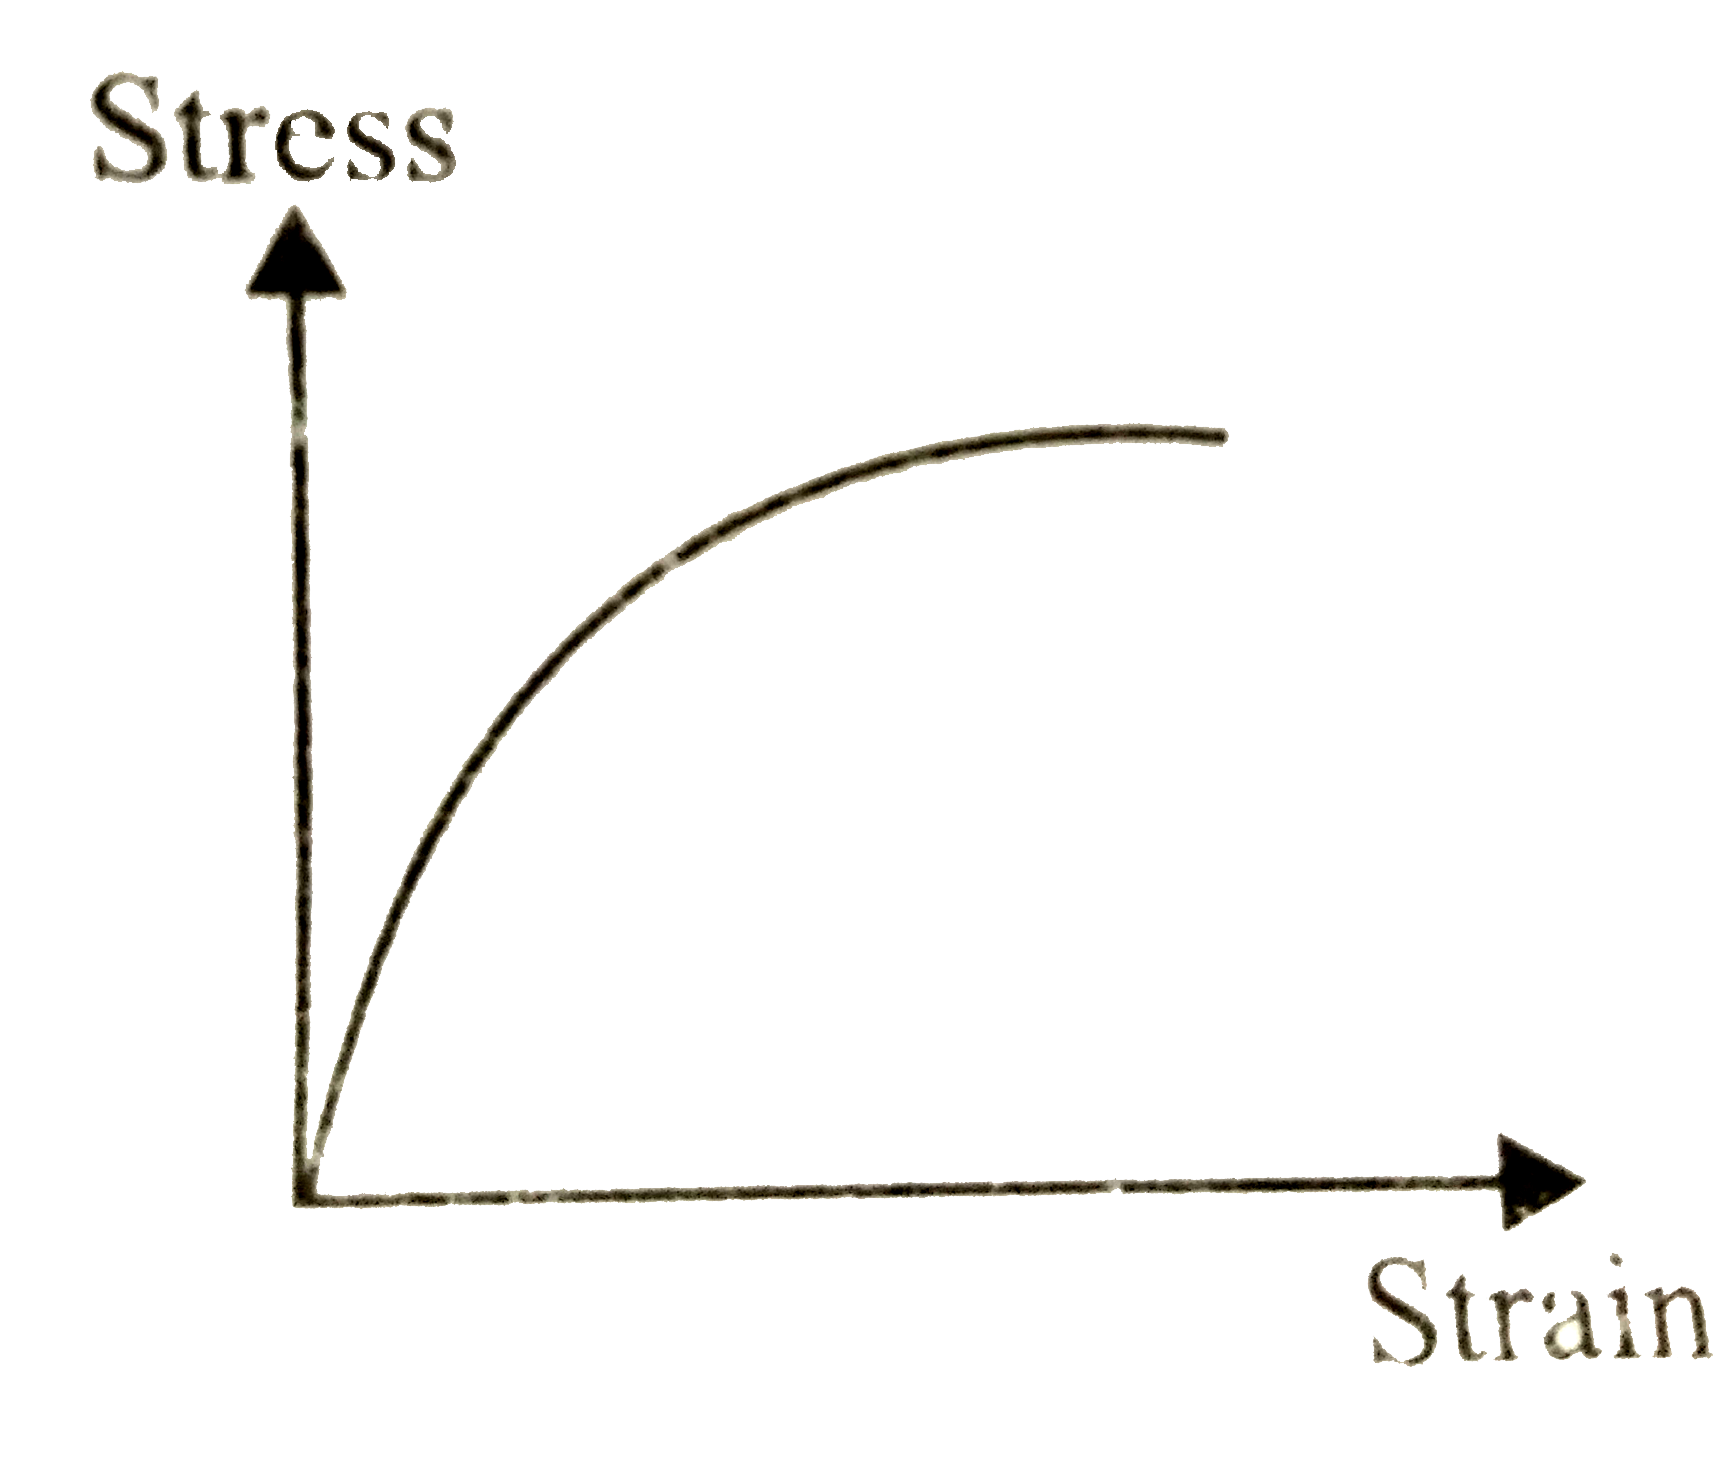 C
C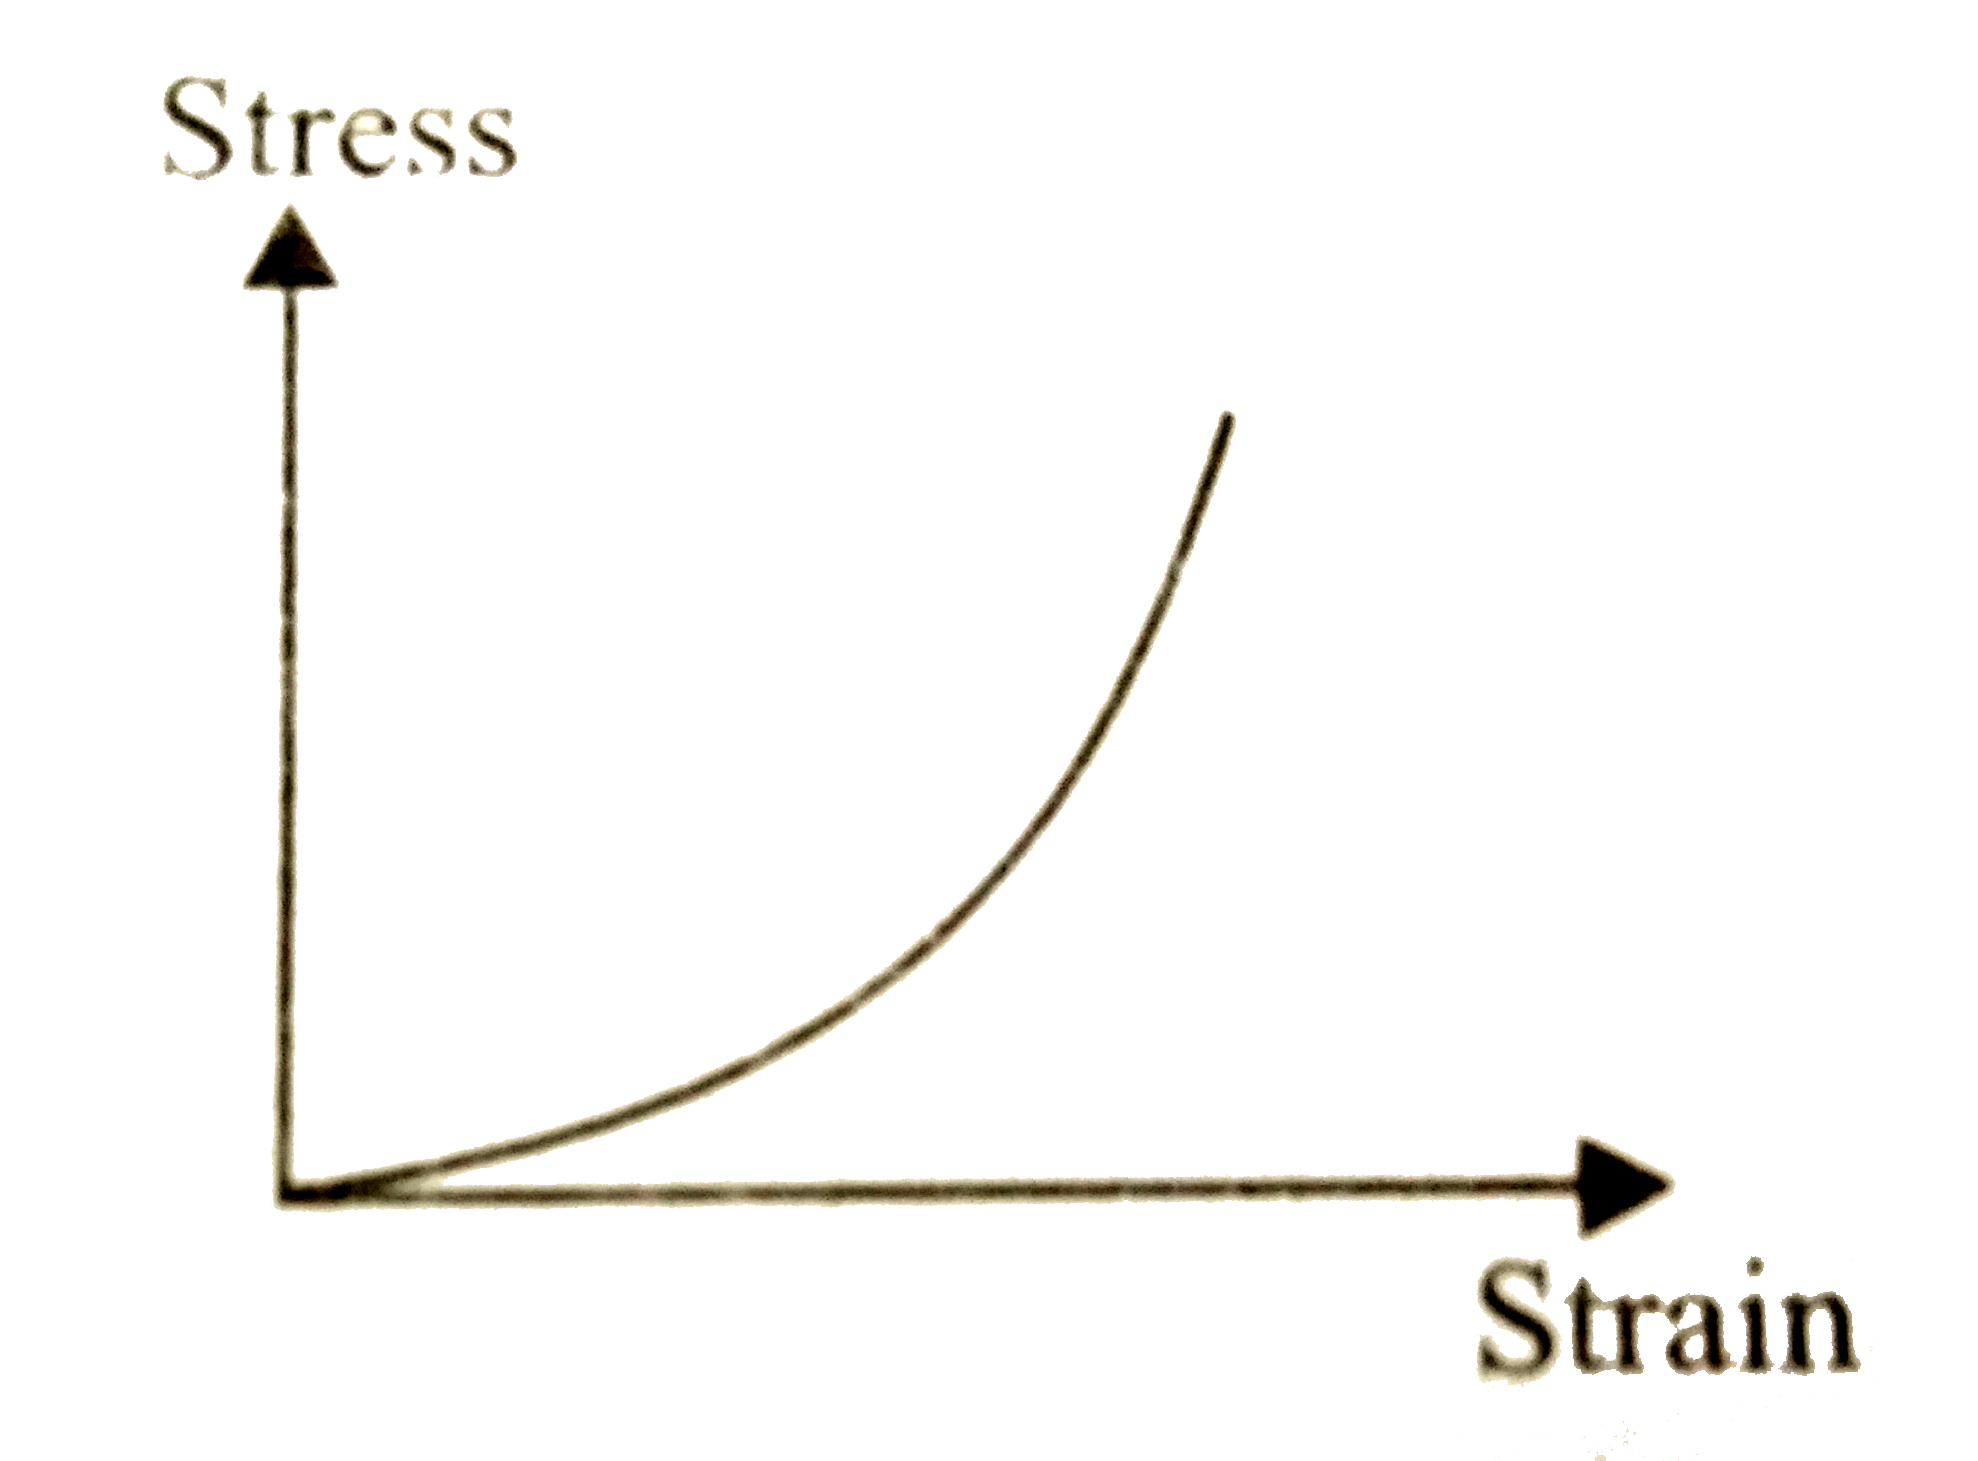 D
D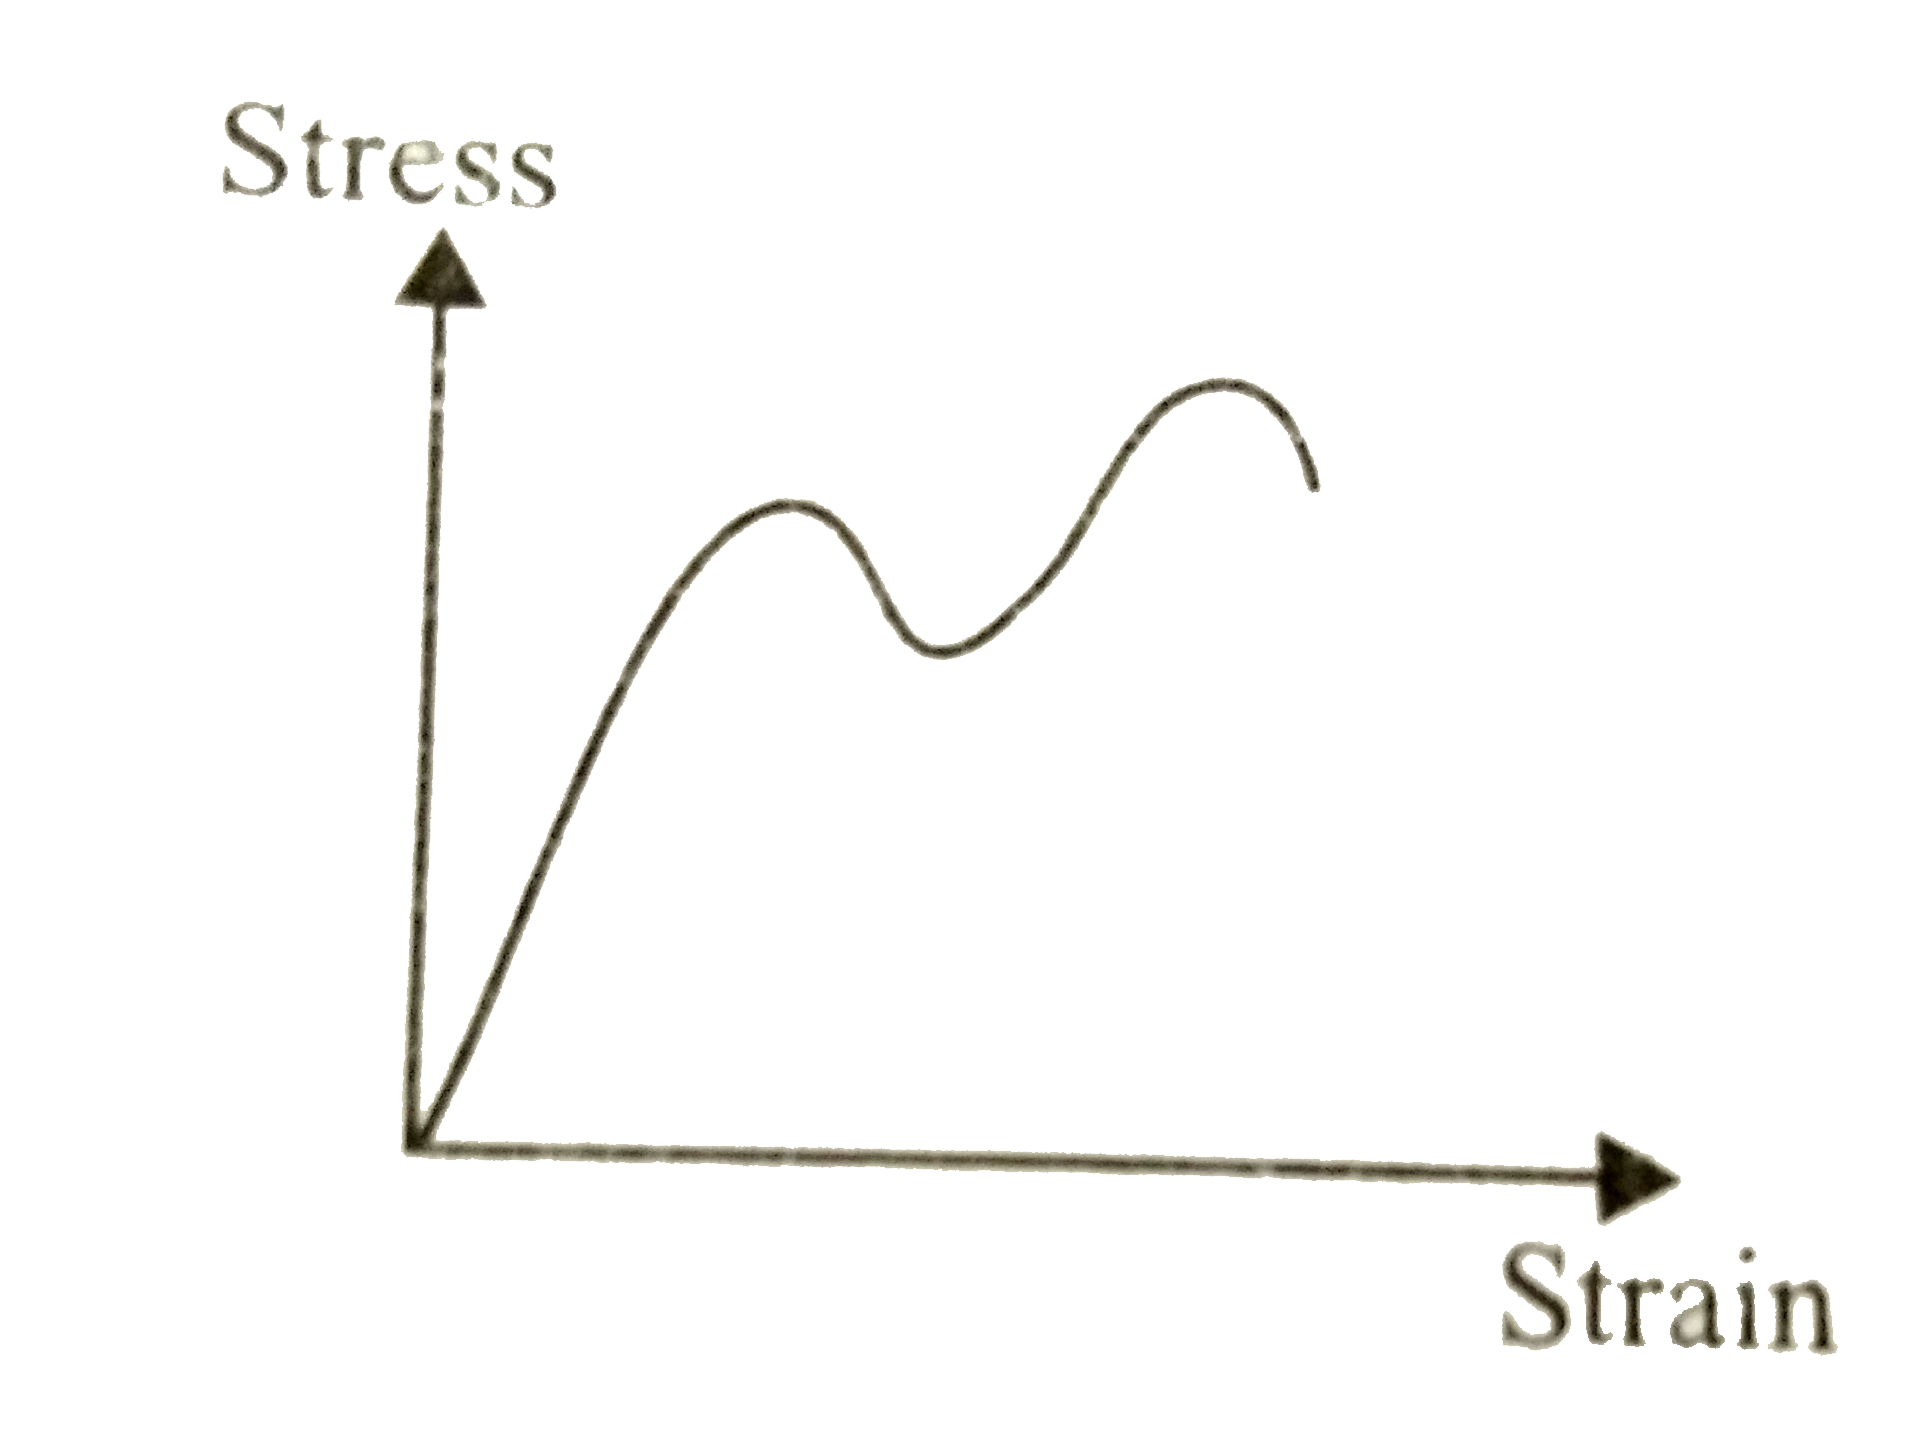
- Question 3 - Select One
Which one of the following graphs represents variation of specific heat capacity of water with temperature?
A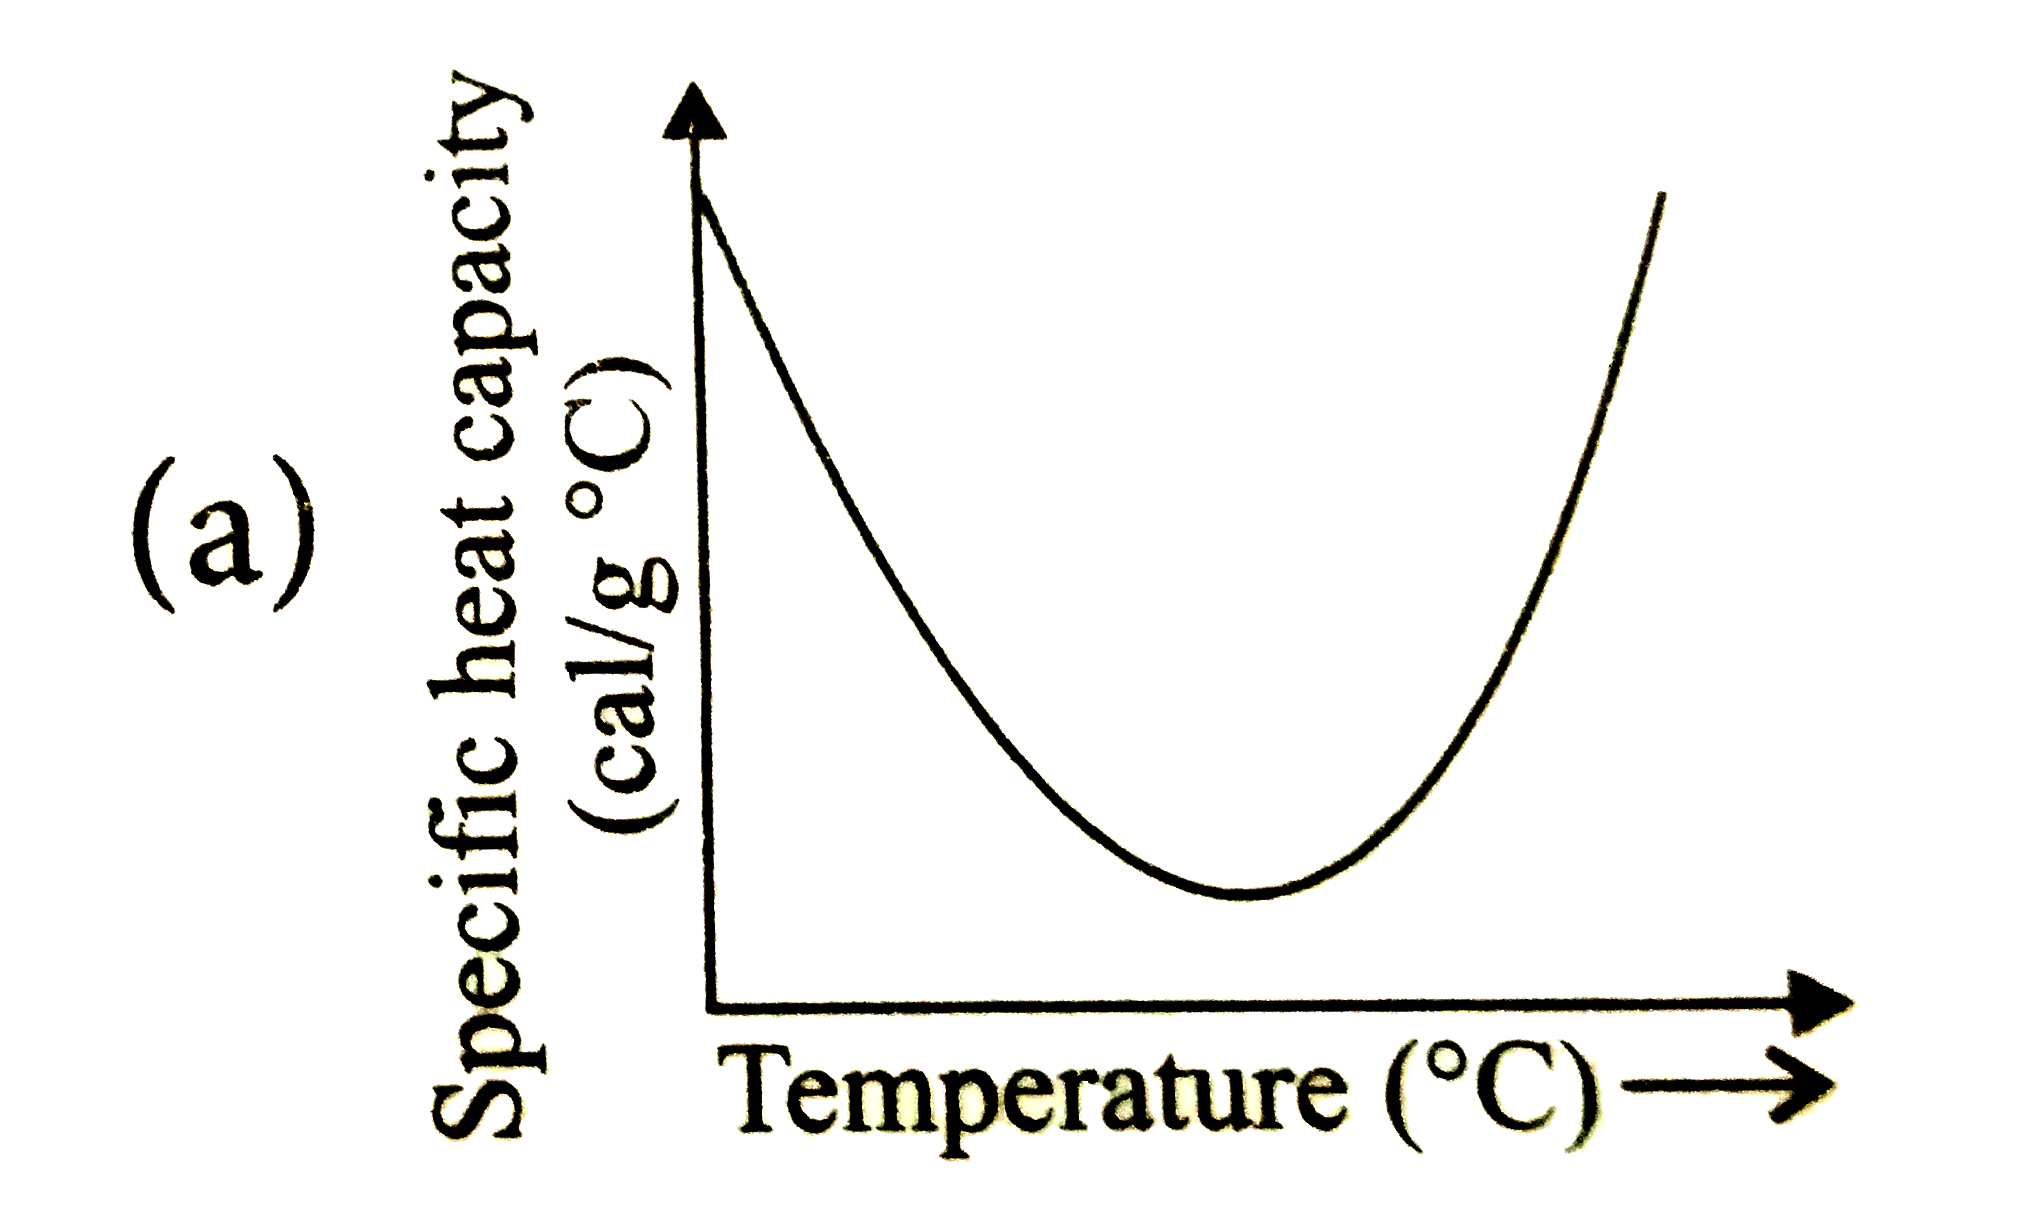 B
B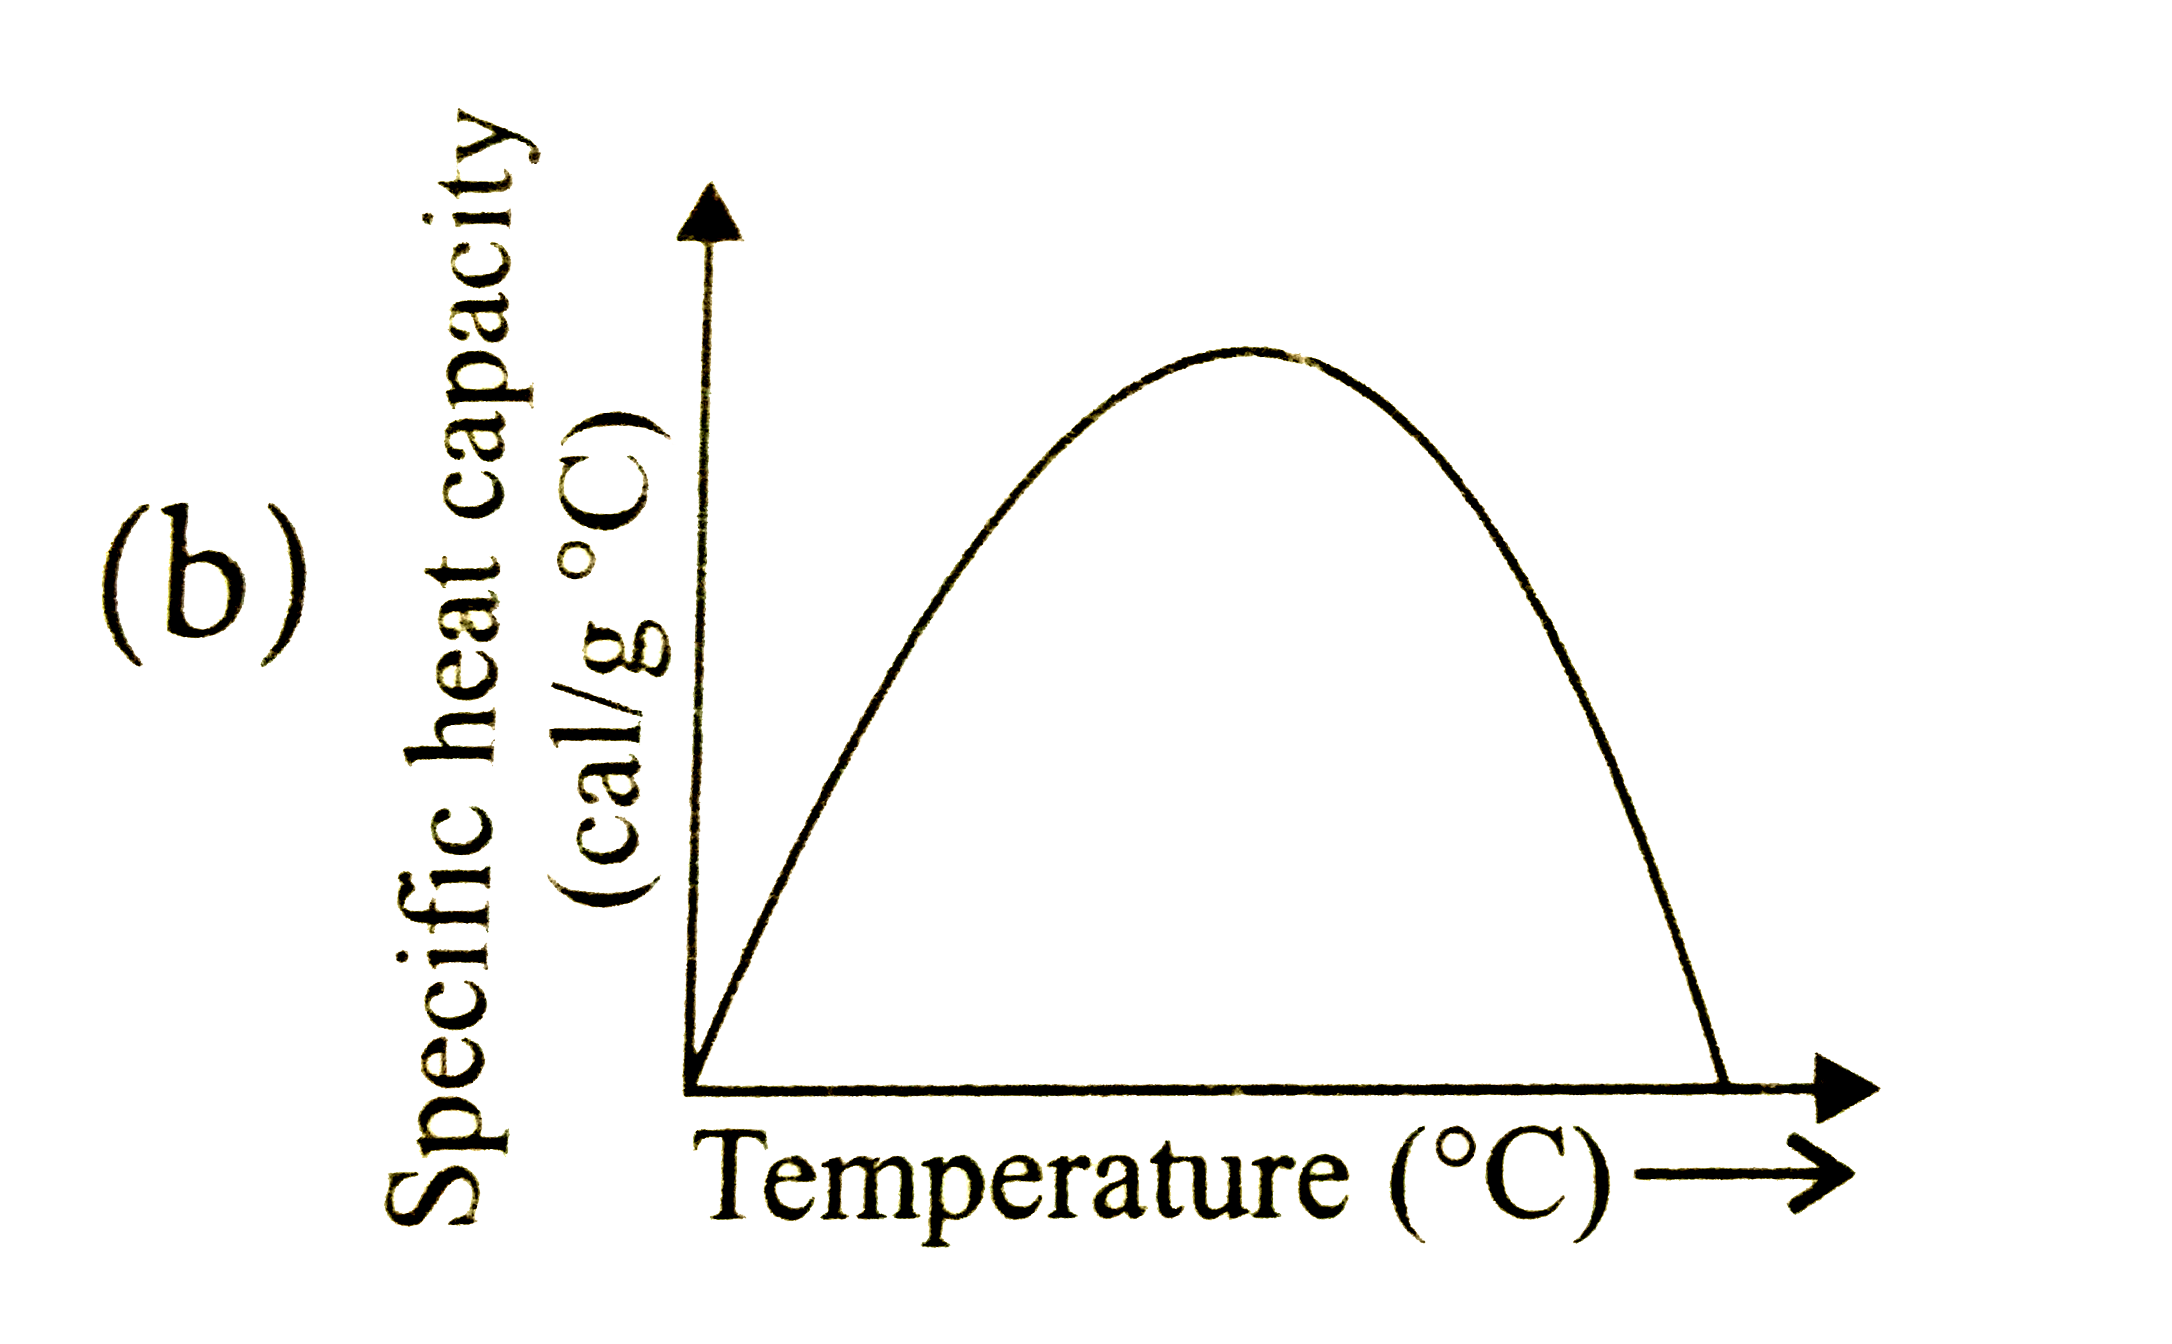 C
C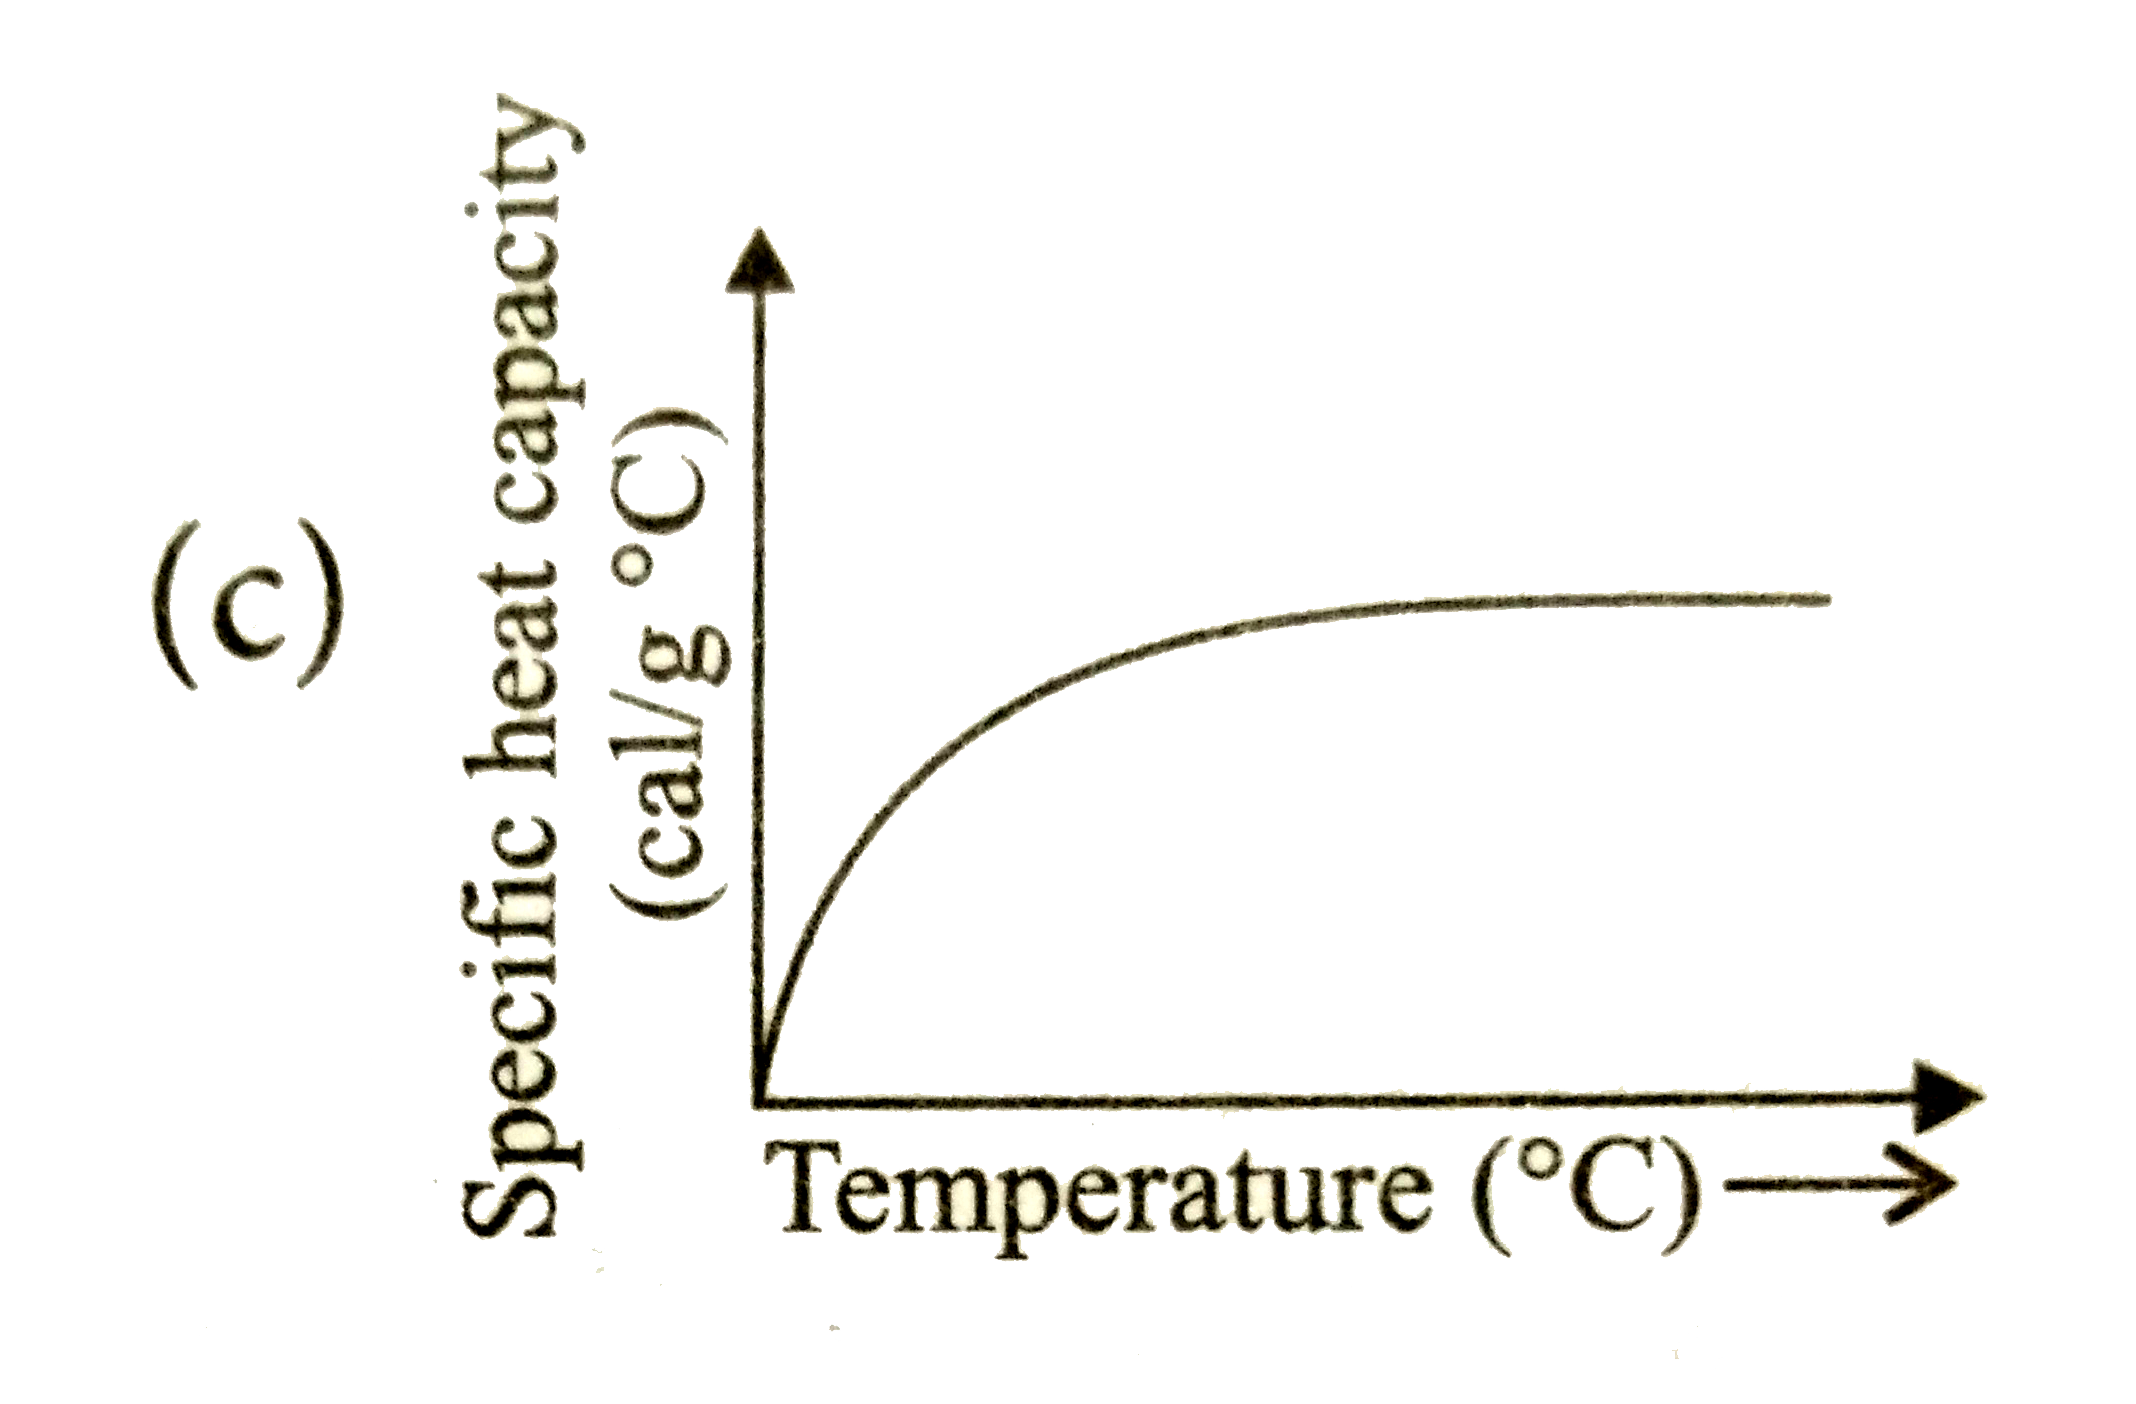 D
D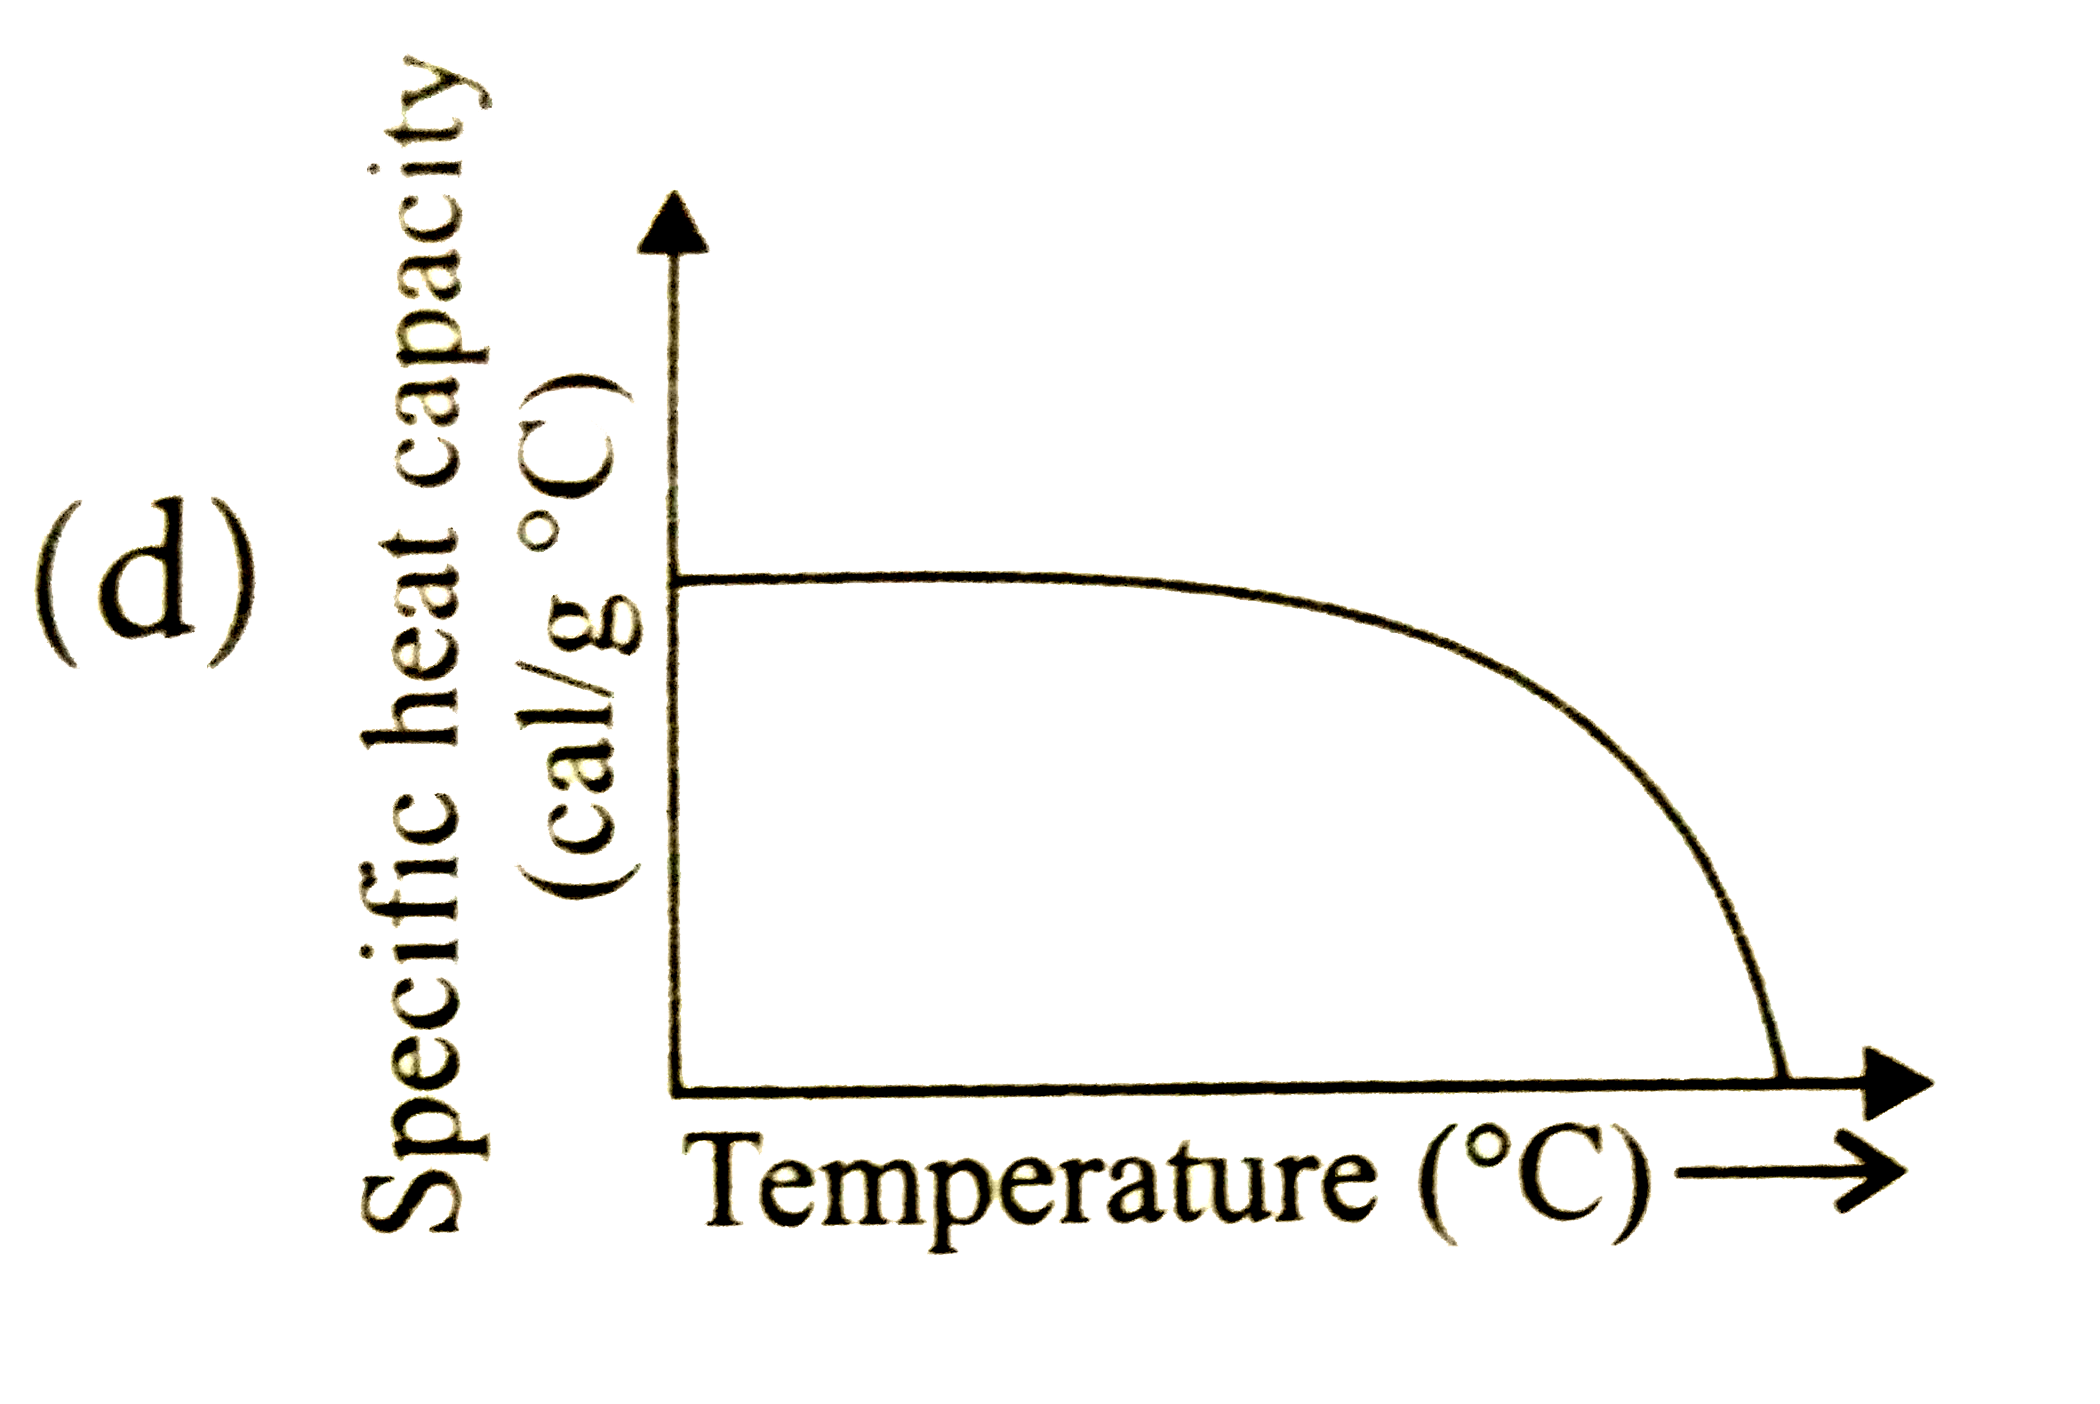
Which of the following curve represent variation of density of water with temperature best-
View SolutionWhich of the following shows an increasing value of e/m?
View SolutionDraw a graph to show the variation in density of water with temperature in the temperature range from 0∘C to 10∘C.
View SolutionShow variation of resistivity of copper as a function of temperature in a graph.
View SolutionWhich of the following graphs correctly shows variation of coefficient of volume expansion of copper as a function of temperature ?
View Solution

