Draw the line graph using suitable scale to show the annual gross profit of a company for a period of five years.

Step by step video & image solution for Draw the line graph using suitable scale to show the annual gross profit of a company for a period of five years. by Maths experts to help you in doubts & scoring excellent marks in Class 8 exams.
Updated on:21/07/2023Topper's Solved these Questions
- INTRODUCTION TO GRAPHS BOOK - NCERT EXEMPLARCHAPTER - INTRODUCTION TO GRAPHS EXERCISE - THINK AND DISCUSS
4 Videos
- EXPONENTS AND POWERSBOOK - NCERT EXEMPLARCHAPTER - EXPONENTS AND POWERSEXERCISE - EXERCISE
195 Videos
- LINEAR EQUATIONS IN ONE VARIABLEBOOK - NCERT EXEMPLARCHAPTER - LINEAR EQUATIONS IN ONE VARIABLEEXERCISE - THINK AND DISCUSS
3 Videos
Similar Questions
The following graph given the annual percent profit earned by a company during the period 1996-2001 . Study the graph carefully and answer the questions that follow
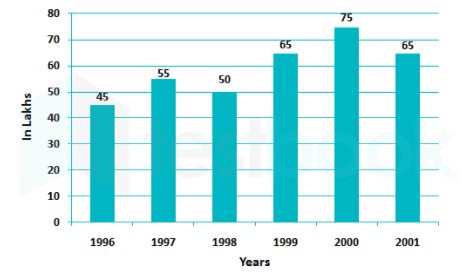
The period in which the profit of the company has increased fasted is:
View SolutionReading of line graphs containing the production and sales of a company in a period
View Solution
Knowledge Check
The following graph gives Sales, Expenses and Capital of a company for a period of five years 1994 to 1998. Read the graph and answer the following questions.
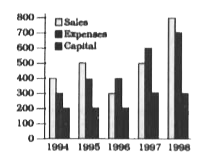
In which year was the ratio of profit to capital the highest?A1998B1995C1996D1997The following graph gives Sales, Expenses and Capital of a company for a period of five years 1994 to 1998. Read the graph and answer the following questions.
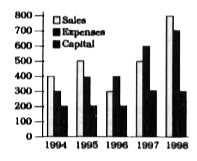
In which year was the Sales to Expense ratio the lowest?A1994B1996C1997D1998The following graph gives Sales, Expenses and Capital of a company for a period of five years 1994 to 1998. Read the graph and answer the following questions.
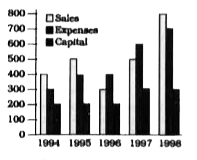
In which years was the ratio of sales tom capital the lowest ?A1998B1997C1996D1995
Direction: The pie chart shows the share in profits of the Company for five years from 2016 to 2020. Study the diagram and answer the following questions.
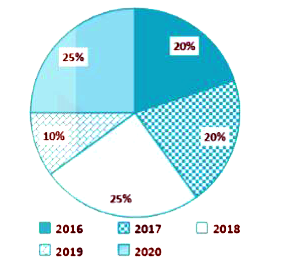
Which year got the lowest share in profits?
View SolutionThe following graph gives Sales, Expenses and Capital of a company for a period of five years 1994 to 1998. Read the graph and answer the following questions.
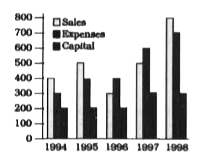
What was the average per annum increase in sales (in Rs cr.) from 1994 to 1998 ?
View SolutionThe following line graph shows the ratio of imports and exports of a company during a period of 1995-2001. Study the graph carefully and answer the questions.
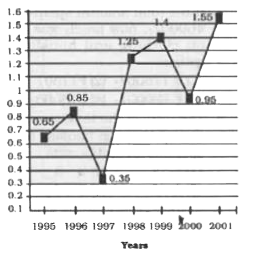
Of the given years. In how many years was the export less than import ?
View SolutionThe following line graph shows the ratio of imports and exports of a company during a period of 1995-2001. Study the graph carefully and answer the questions.
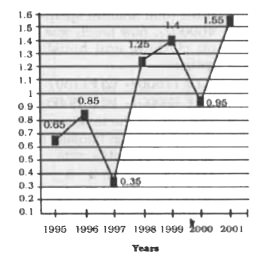
In which year was the ratio of imports to exports maximum ?
View SolutionThe line chart given below shows the profit (in crores) of a company for the years 2008 to 2015.
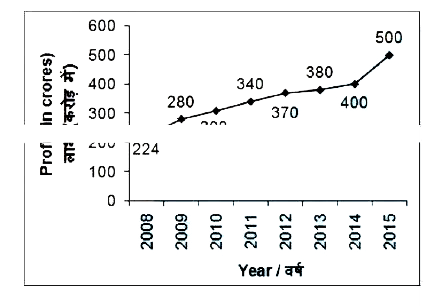
The profit in 2015 is what percetn of the profit in 2014 ?
View Solution
