v-t గ్రాఫు వాలు సూచించునది
వడి
వేగం
త్వరణం
స్థానభ్రంశం
The correct Answer is:C
Similar Questions
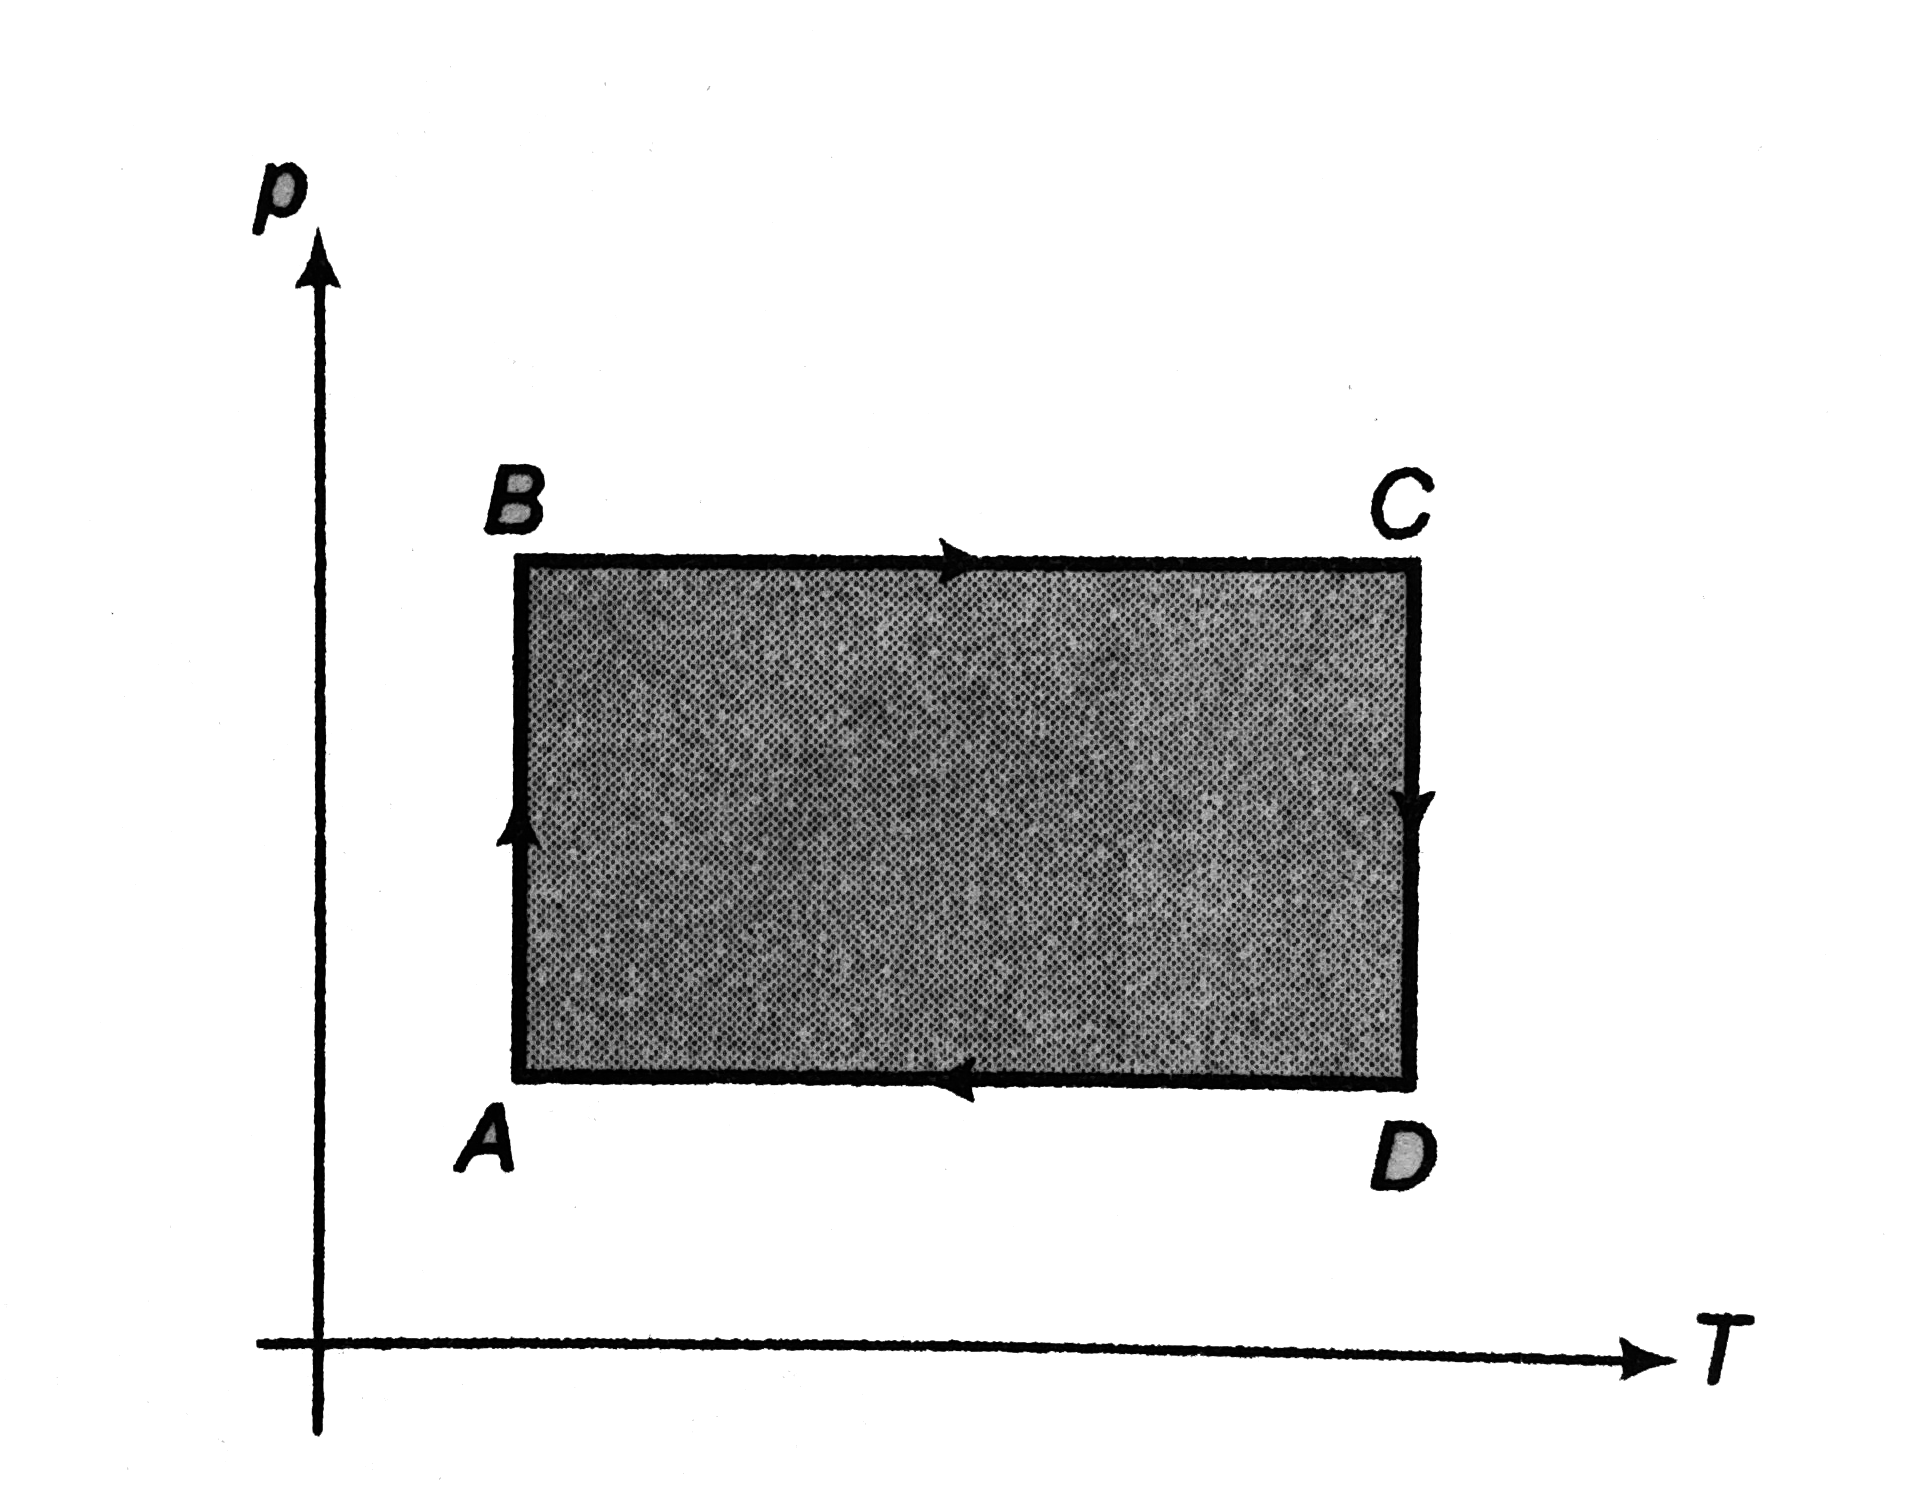
Plot P-V, V-T and p-T graph correspongidng to the P-T graph for an ideal gas shown in figure.
View SolutionHeight of T .V . Tower is h_(T) . The area of transmission of T . V . Waves is propto _________ .
View SolutionPlot (p - V),(V - T) and (ρ - T) graph corresponding to the (p - T) graph for an ideal gas shown in figure.
 .
.
View SolutionLet u(t) and v(t) be two solutions of the differential equation dydt=et2y(t)+sint with u(2)<v(2)
Statement 1: u(t)<v(t) for all t
Statement: u-v is proportional ot a positive function of t.
View SolutionIf velocity v varies with time(t) as v=2t−3, then the plot between v and t is represented by :
View SolutionIf velocity v varies with time t as v=2t^(2) , then the plot between v and t^(2) will be given as :
View SolutionHeight of T .V . Tower is hT . The area of transmission of T . V . Waves is ∝ _________ .
View SolutionIf velocity v varies with time(t) as v=2t−3, then the plot between v and t is best represented by :
View Solution
