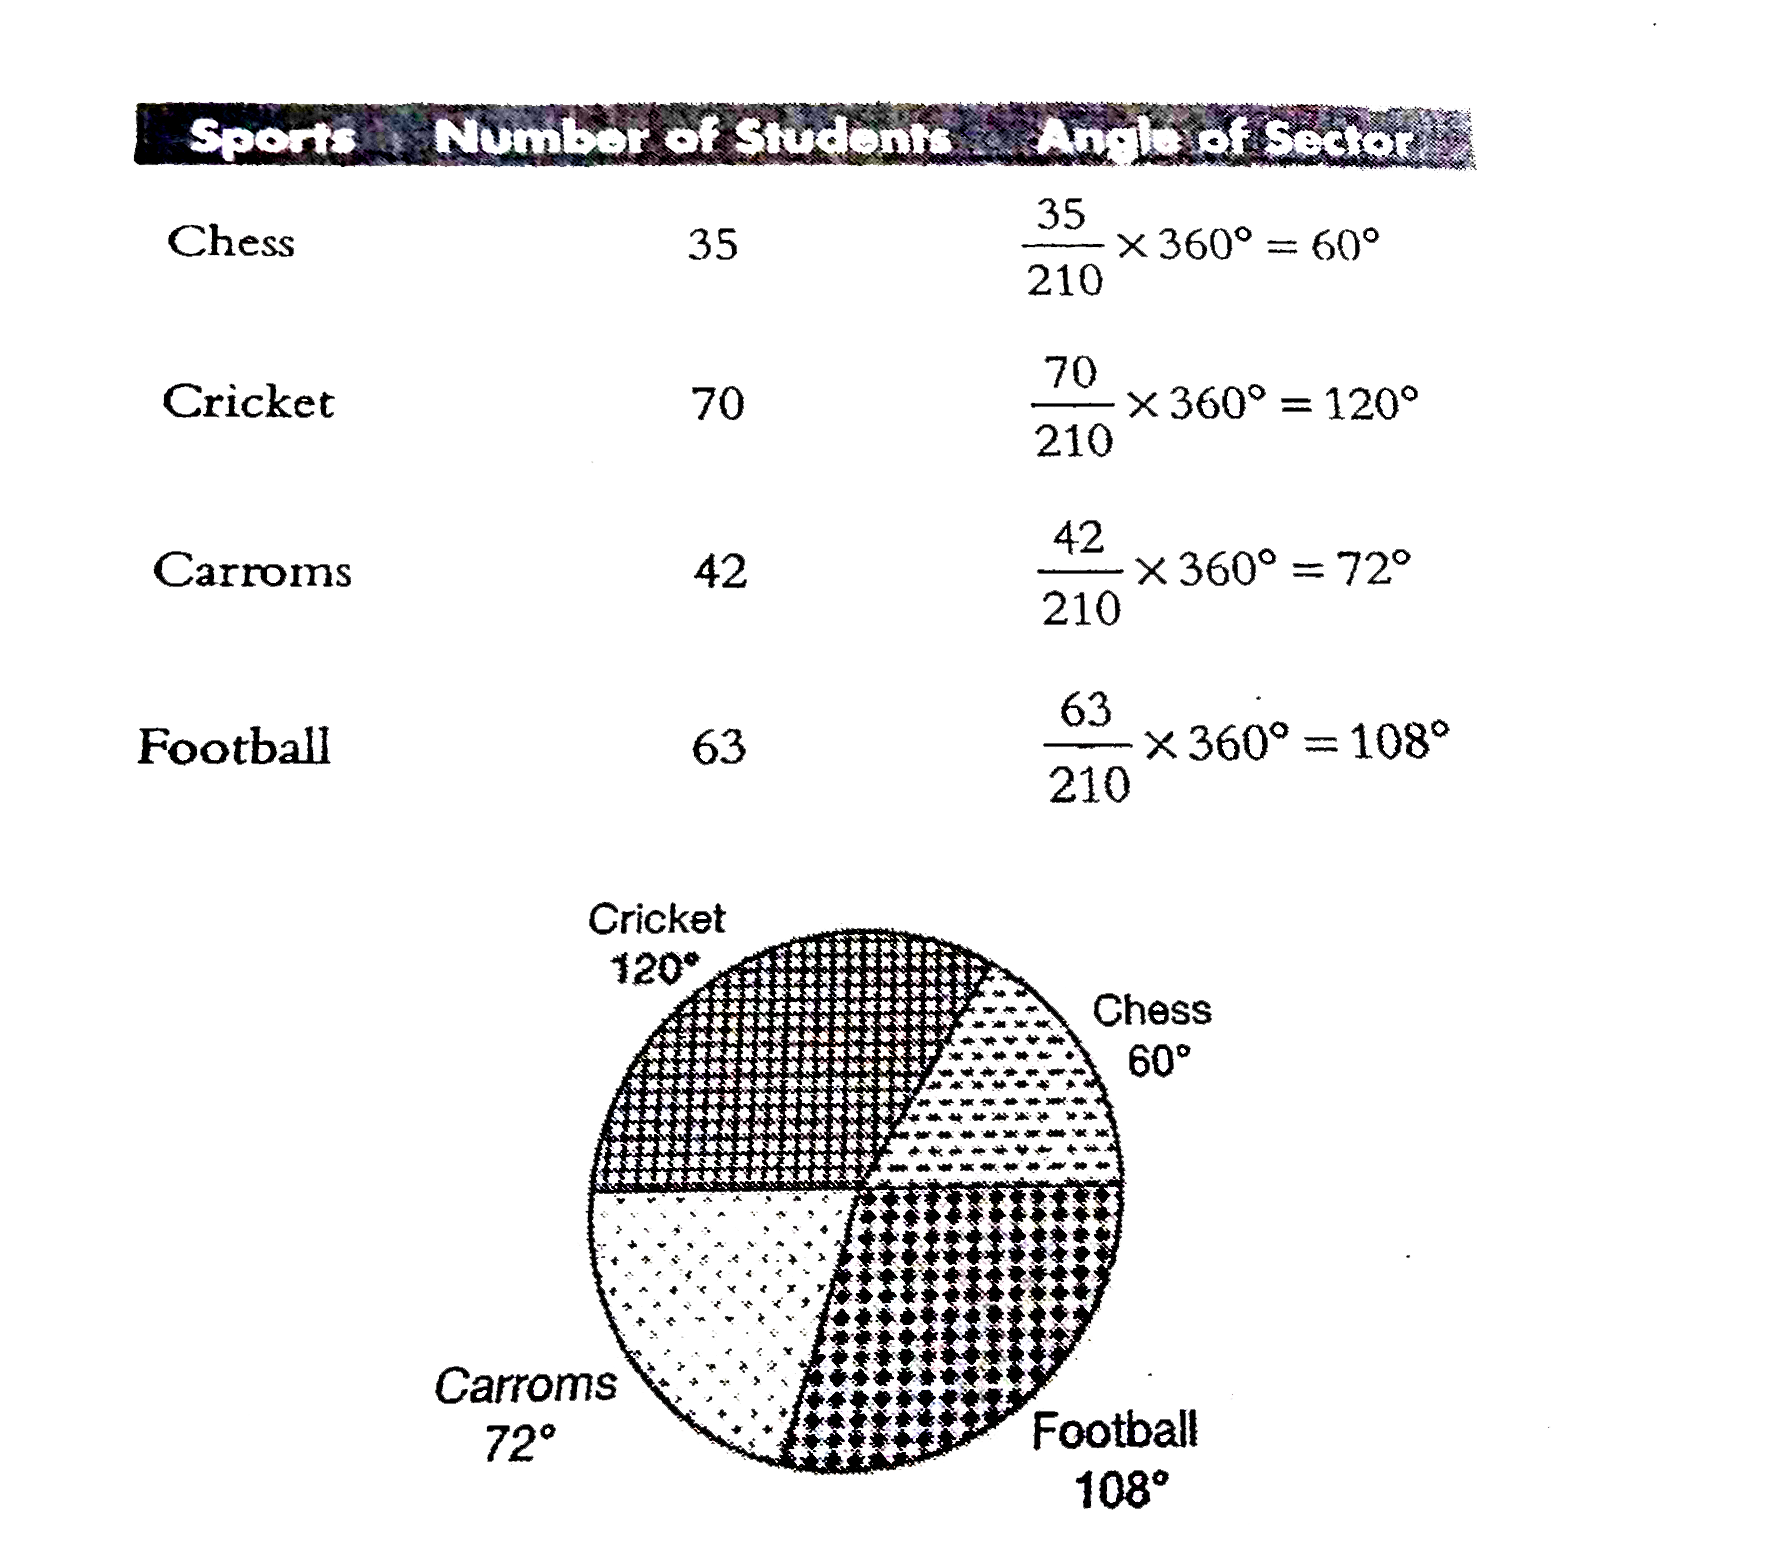
The following table shows various sports played by students in a school. Draw a pie chart to represent the given data.
SportsChessCricketCarromsFootballNumber of students35704263
Pie chart for the given data can be drawn using the following steps.
(1) Draw a circle with suitable radius. (2) Mark the angle at the centre of the circle and draw the sectors.
SportsNumber of StudentsAngle of SectorChess3535210×360∘=60∘Cricket7070210×360∘=120∘Carroms4242210×360∘=72∘Football3663210×360∘=108∘
Topper's Solved these Questions
- STATISTICSBook:PEARSON IIT JEE FOUNDATIONChapter:STATISTICSExercise:EXAMPLE 10.6
Explore 1 Video
- STATISTICSBook:PEARSON IIT JEE FOUNDATIONChapter:STATISTICSExercise:TEST YOUR CONCEPTS (VERY SHORT ANSWER TYPE QUESTION )
Explore 11 Videos
- STATISTICSBook:PEARSON IIT JEE FOUNDATIONChapter:STATISTICSExercise:EXAMPLE 10.4
Explore 1 Video
- SETSBook:PEARSON IIT JEE FOUNDATIONChapter:SETSExercise:Crossword
Explore 1 Video
Similar Questions
The following table shows the number of students in different classes of a high school. Draw a histogram to represent the given data.
ClassesVIVIIVIIIIXXNumber of students3742355048
View SolutionThe following table shows the favourite games of 240 students of a school. Draw a pie chart for the following data.
¯¯¯¯¯¯¯¯¯¯¯¯¯¯¯¯¯¯¯¯¯¯¯¯¯¯¯¯¯¯¯¯¯¯¯¯¯¯¯¯¯¯¯¯¯¯¯¯¯¯¯¯¯¯¯¯¯¯¯¯¯¯¯¯¯¯¯¯¯¯¯¯¯¯¯¯¯¯¯¯¯¯¯¯¯¯¯¯¯¯¯¯¯¯¯¯¯¯¯¯¯¯¯¯¯¯¯¯¯¯¯¯¯¯¯¯¯¯¯¯Game Football Badminton Criket Volleyball HockeyNumber of 35 30 80 40 55students ––––––––––––––––––––––––––––––––––––––––––––––––––––––––––––––––––––––––––––––
View Solution
Knowledge Check
The following table shows various sports played by students in a school.
SportFootballVolleyballBadminbtonChessNumber of students68345642
If we respresent these value in the form of a bar graph, then the height of the bar corresponding to football is 13.6cm. Find the difference between the height of the bars corresponding to volley ball and badminton.A4.4 cmB6.8 cmC8.8 cmD7.7 cmDirections: Study the graph carefully and answer the question that follows.
The following bar graph shows 5 different sports played by 550 students of a College.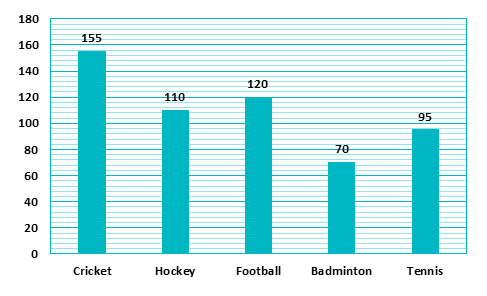
Find the difference between the total number of students who played (Cricket and Hockey) and (Football and Tennis) respectively.A70B40C60D50
The following table shows the interest of students of a school in different games :

Represent the data by using a simple bar diagram.
View SolutionThe marks obtained by a student in various subjects in an examination are given below.

Represent the data using pie diagram.
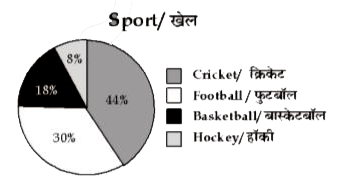
View SolutionThe given pie-chart shows favourite sport of students of a school.
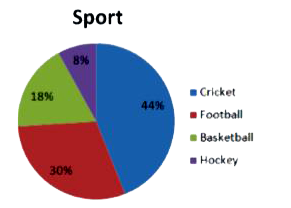
In the given pie-chart, if there were 1280 students in all, how many liked football?
View SolutionIn the time table of a school, periods allotted per week to different teaching subjects are given below:

Draw a pie chart for this data.
View SolutionThe given pie-chart shows favourite sport of students of a school.
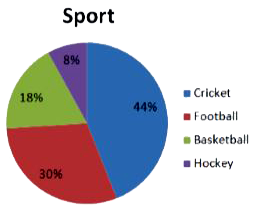
In the given pie-chart, what is the difference in percentage between liking for football and basketball?
View SolutionThe given pie chart shows favorite shows of student of a school
In the given pie chart, if there were 1280 students in all, how many liked football
View Solution
