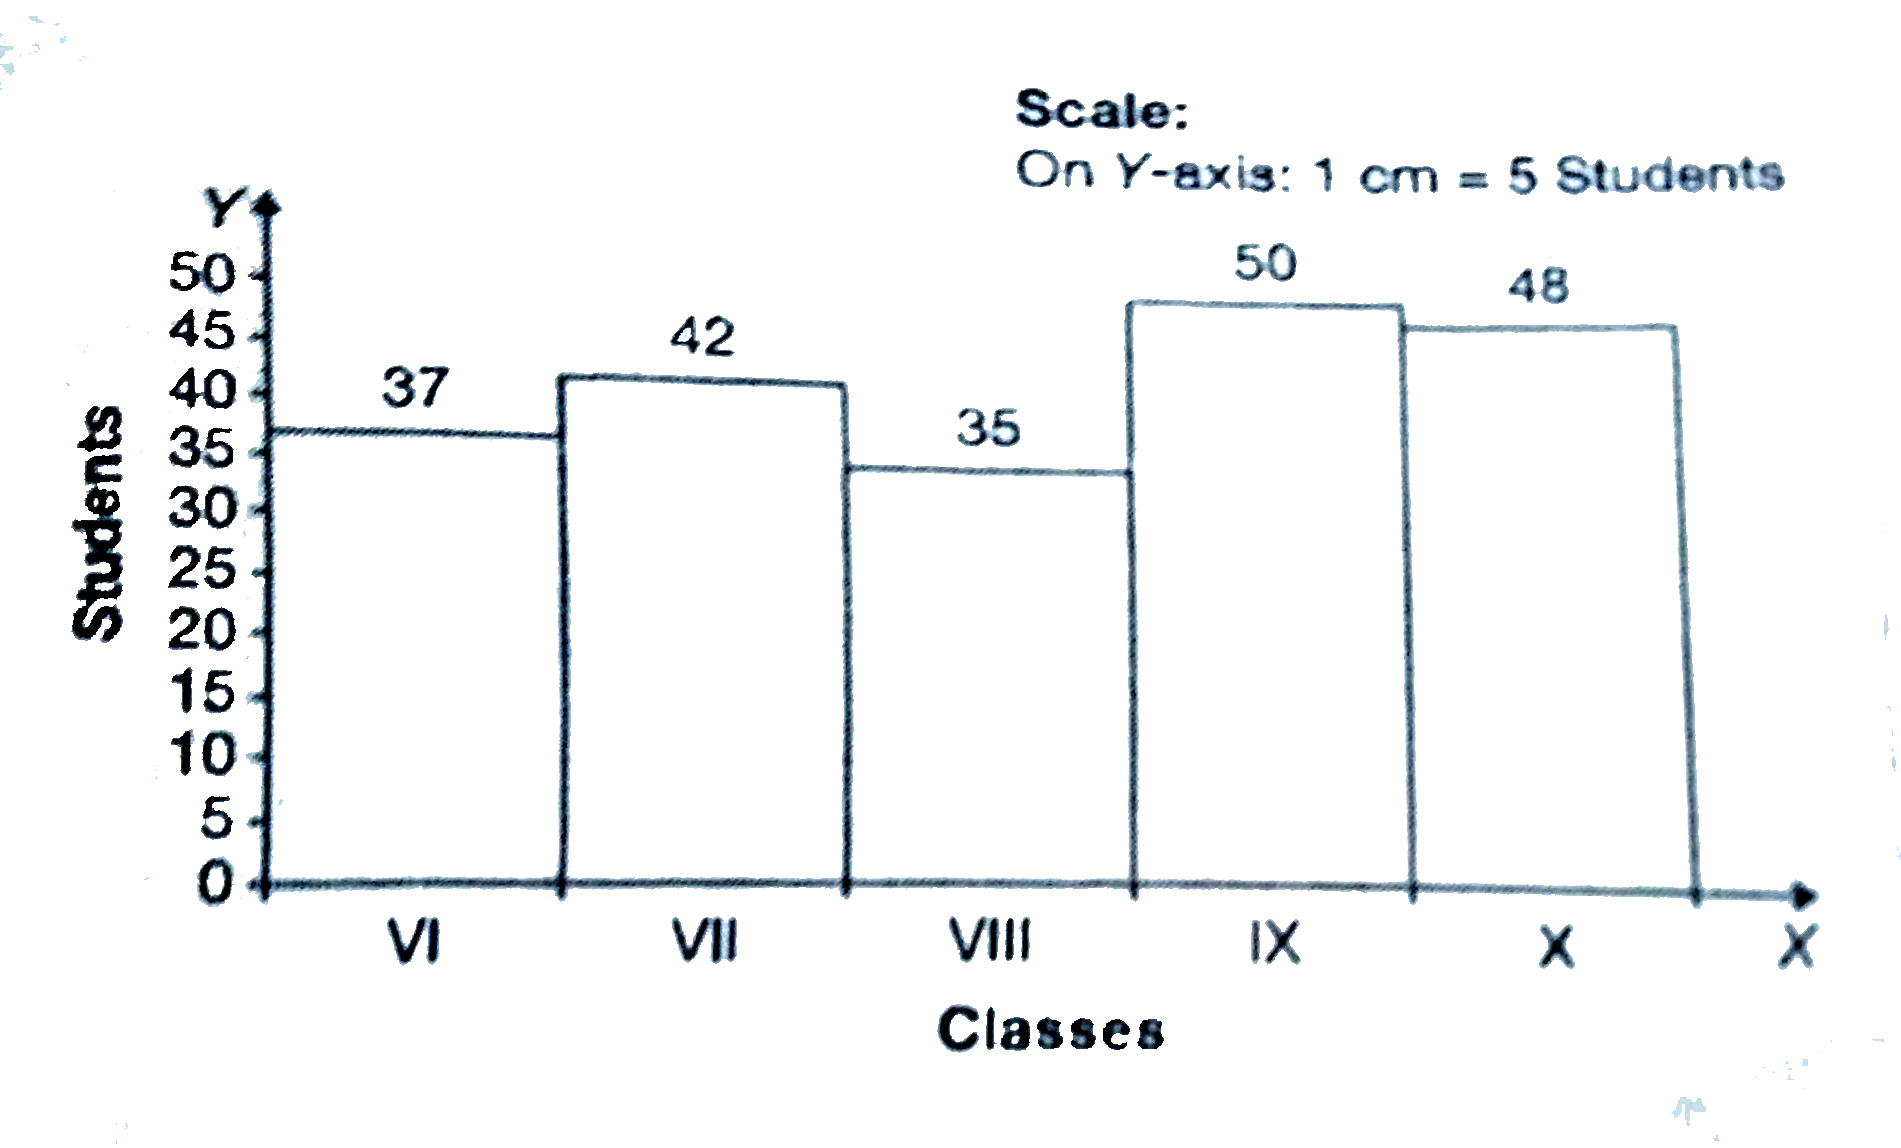
The following table shows the number of students in different classes of a high school. Draw a histogram to represent the given data.
ClassesVIVIIVIIIIXXNumber of students3742355048
To draw a bar graph, take classes on the X-axis and the number of student on the Y-axis.
Topper's Solved these Questions
Similar Questions
The following bar graph shows the number of students in different classes of a school.
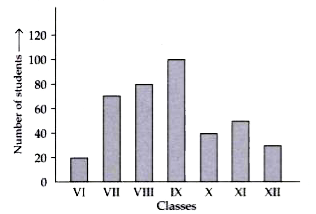
How many more students are there in Class IX than in Class VIII ?View SolutionThe following table shows various sports played by students in a school. Draw a pie chart to represent the given data.
SportsChessCricketCarromsFootballNumber of students35704263View SolutionThe following table shows the interest of students of a school in different games :

Represent the data by using a simple bar diagram.View SolutionIn a class of 40 students, the marks obtained (out of 50) are as given below:

Draw a histogram to represent the given data.View SolutionThe given bar graph, shows the number of students in different classes.
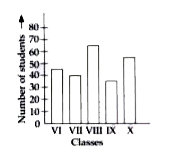
Find the total number of students in the classes VIII to X.View SolutionThe given bar graph, shows the number of students in different classes.
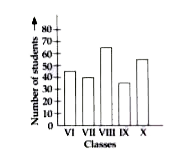
Arrange the classes in descending order of student population.View SolutionThe given bar graph, shows the number of students in different classes.
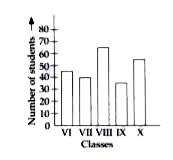
How many more students are there in class VIII than in class IX?View SolutionThe following data shows the number of students born in different months of a particular year of class VI. Make the bar graph based on the given information.
 View Solution
The following data shows the number of students who attended the school on weekdays. Draw a bar graph to represent information by using appropriate scale.
 View Solution
Total number of students of a school in different years is shown in the following table
View Solution

