The cotton yielded from the crop of a farmer is given below. Find the average mass of cotton yielded per week.
Week 1 - 20 quintals
Week 2 - 15 quintals
Week 3 - 12 quintals
Aim: To measure the diagonal length of your TV screen in inches.
Apparatus: Scale
Procedure: Take a metre scale. Measure the length of the diagonal of screen in centimeters. Convert the reading in terms of inches. If 1 inch = _____ centimeters. The diagonal of the screen = _____ cm = _____ inches.
Topper's Solved these Questions
- MEASUREMENTS AND MOTIONBOOK - PEARSON IIT JEE FOUNDATIONCHAPTER - MEASUREMENTS AND MOTIONEXERCISE - Very Short Answer Questions
45 Videos
- MEASUREMENTS AND MOTIONBOOK - PEARSON IIT JEE FOUNDATIONCHAPTER - MEASUREMENTS AND MOTIONEXERCISE - Short Answer Type Questions
52 Videos
- LIGHTBOOK - PEARSON IIT JEE FOUNDATIONCHAPTER - LIGHTEXERCISE - ASSESSMENT TEST (CROSS WORD )
11 Videos
- MOVEMENT - AN AMAZING ACTIVITY BOOK - PEARSON IIT JEE FOUNDATIONCHAPTER - MOVEMENT - AN AMAZING ACTIVITY EXERCISE - CROSSWORD
1 Video
Similar Questions
The cotton yielded from the crop of a farmer is given below. Find the average mass of cotton yielded per week.
Week 1 - 20 quintals
Week 2 - 15 quintals
Week 3 - 12 quintals
View SolutionThe yield of wheat from 8 hectares of land is 360 quintals. Find the number of hectares of land required for a yield of 540 quintals?
View SolutionThe yield of wheat from 6 hectares is 280 quintals. Find the number of hectares required for a yield of 225 quintals.
View SolutionThe yields of soya bean per acre for 7 years was 10,7,5,3,9,6,9 quintals. Find the mean of yields peracre.
View SolutionEqual masses of two samples of charcoal AandB are burnt separately and the resulting carbon dioxide are collected in two vessels. The radioactivity of ^14C is measured for both the gas samples. The gas from the charcoal A gives 2100counts per week and the gas from the charcoal A gives 2100 counts per week and the gas from the charcoal B gives 1400 counts per week. Find the age difference between the two samples. Half-life of ^14C=5730y.
View SolutionFor an experiment in botany, two different plants, plant A and B, were grown under similar laboratory conditions. Their heights were measured at the end of each week for three weeks. The results are shown by the line graph given below :
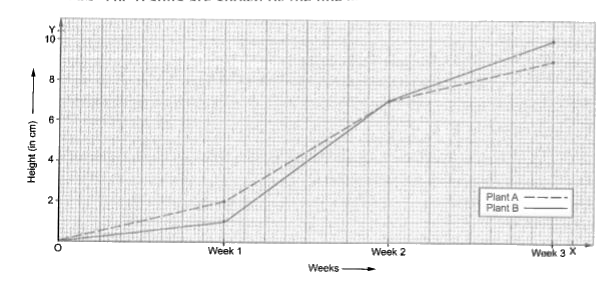
Study the above line graph carefully and answer the questions given below:
(i) How high was plant A after (a)2 weeks (b)3 weeks ?
(ii) How high was plant B after (a)2 weeks (b)3 weeks?
(iii) How much did plant A grow during the 3rd week?
(iv) How much did plant B grow from the end of the 2nd week to the end of the 3rd week ?
(v) During which week did plant A grow most ?
(vi) During which week did plant B grow least ?
(vii) Were the two plants of the same height during any week shown here ? Specify.
View SolutionThe following Pie Chart shows the export of different foodgrains from India in 2010. Study the chart and answer the questions :
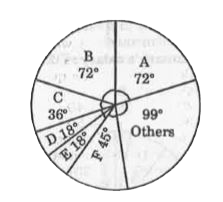
If a total of 1.5 million quintals of crop F was exported, the amount of total foodgrains exported (in million) quintals was
View SolutionStudy the line graph given below to answer the following questions.
The line graph given below shows the percentage of orders delivered from Monday to Saturday of week III out of the orders received on Sunday of Week II and it also shows the number of orders returned on any given day as a percentage of total number of orders delivered till previous day.
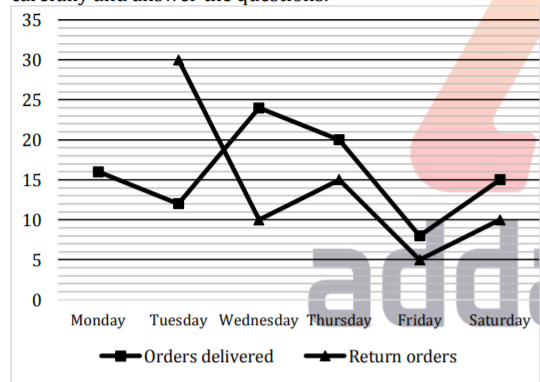
Note: • Number of orders which were yet to be delivered after Saturday of week III were 25.
• Orders cannot be returned on the same day of delivery. It has to be returned on next day of delivery and no order was returned on Sunday of Week III.
Find the average number of orders delivered on Monday, Tuesday and Thursday of week III.
View SolutionStudy the line graph given below to answer the following questions.
The line graph given below shows the percentage of orders delivered from Monday to Saturday of week III out of the orders received on Sunday of Week II and it also shows the number of orders returned on any given day as a percentage of total number of orders delivered till previous day.
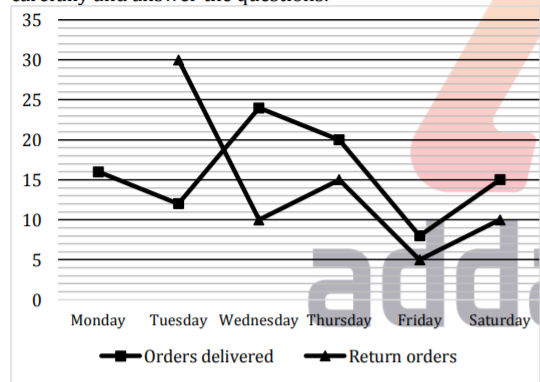
Note: • Number of orders which were yet to be delivered after Saturday of week III were 25.
• Orders cannot be returned on the same day of delivery. It has to be returned on next day of delivery and no order was returned on Sunday of Week III.
If the average number of orders returned from Tuesday to Sunday of week III is 30, then the number of orders returned on Sunday of week III is what percent more/less than the number of orders returned on Tuesday of week III?
View SolutionStudy the line graph given below to answer the following questions.
The line graph given below shows the percentage of orders delivered from Monday to Saturday of week III out of the orders received on Sunday of Week II and it also shows the number of orders returned on any given day as a percentage of total number of orders delivered till previous day.
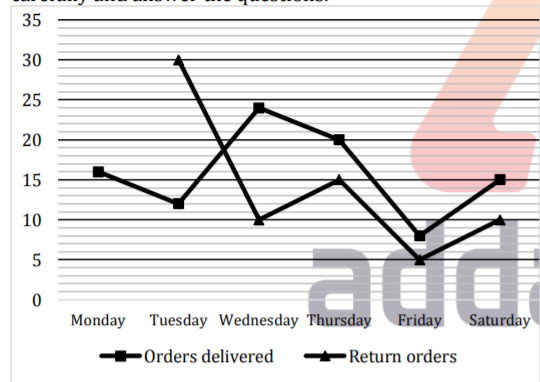
Note: • Number of orders which were yet to be delivered after Saturday of week III were 25.
• Orders cannot be returned on the same day of delivery. It has to be returned on next day of delivery and no order was returned on Sunday of Week III.
If 25 orders were returned on Sunday of week III, then what percent of the total number of orders placed on Sunday of week II were not returned by the customers till Sunday of week 2?
View Solution