Study the line graph given below to answer the following questions.
The line graph given below shows the percentage of orders delivered from Monday to Saturday of week III out of the orders received on Sunday of Week II and it also shows the number of orders returned on any given day as a percentage of total number of orders delivered till previous day.
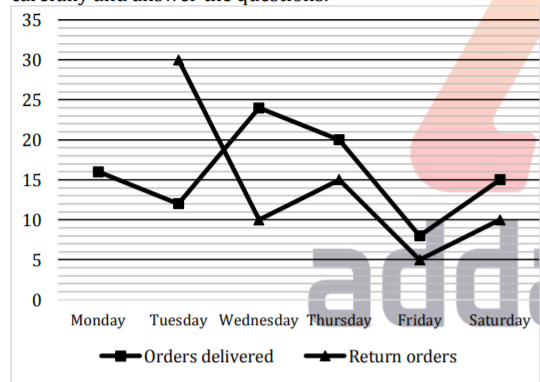
Note: • Number of orders which were yet to be delivered after Saturday of week III were 25.
• Orders cannot be returned on the same day of delivery. It has to be returned on next day of delivery and no order was returned on Sunday of Week III.
Find the average number of orders delivered on Monday, Tuesday and Thursday of week III.
70
80
60
50
The correct Answer is:B
Total percentage of orders delivered from Monday to Saturday of week III = 16% + 12% + 24% + 20% + 8% + 15% = 95%
Remaining Orders = 100% – 95% = 5%
It is given that, number of orders which were not delivered = 25
Thus, 5% of total orders = 25
So, total number of orders received on Sunday of week II = =500
Now, we can calculate the number of orders delivered on each day and also the number of orders which were returned.

Required average ==80
Hence, option B is the correct answer.
Similar Questions
Study the line graph given below to answer the following questions.
The line graph given below shows the percentage of orders delivered from Monday to Saturday of week III out of the orders received on Sunday of Week II and it also shows the number of orders returned on any given day as a percentage of total number of orders delivered till previous day.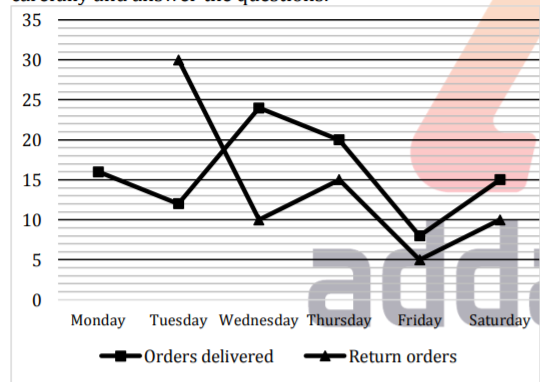
Note: • Number of orders which were yet to be delivered after Saturday of week III were 25.
• Orders cannot be returned on the same day of delivery. It has to be returned on next day of delivery and no order was returned on Sunday of Week III.
Find the ratio between the total number of orders delivered from Monday to Thursday of week III to the total number of orders returned on Wednesday, Friday and Saturday together.
View SolutionStudy the line graph given below to answer the following questions.
The line graph given below shows the percentage of orders delivered from Monday to Saturday of week III out of the orders received on Sunday of Week II and it also shows the number of orders returned on any given day as a percentage of total number of orders delivered till previous day.
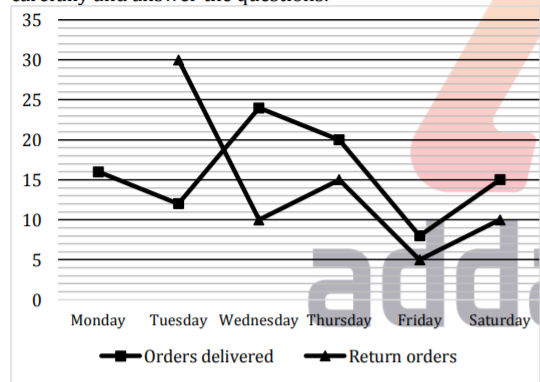
Note: • Number of orders which were yet to be delivered after Saturday of week III were 25.
• Orders cannot be returned on the same day of delivery. It has to be returned on next day of delivery and no order was returned on Sunday of Week III.
If the average number of orders returned from Tuesday to Sunday of week III is 30, then the number of orders returned on Sunday of week III is what percent more/less than the number of orders returned on Tuesday of week III?
View Solution
Knowledge Check
Study the following graph carefully and answer the questions given below it -----
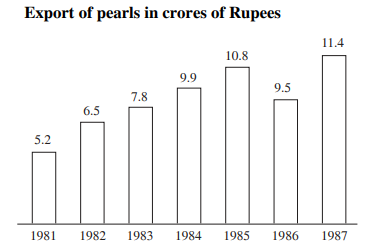
What was the percentage increase in export from 1986 to 1987 ?A1623%B20%C19%D3313%Study the following graph carefully and answer the question given below-----
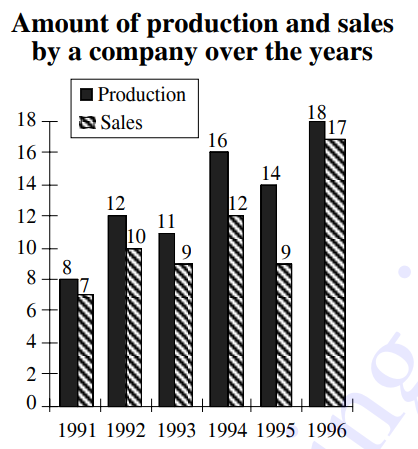
What was the percentage drop in sales from 1992 to 1993 ?A1B10C20D15Study the following graph carefully and answer the questions given below
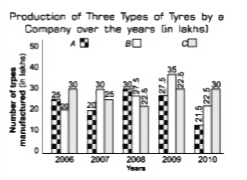
What was the percentage drop in the number of C type tyres manufactured from 2007 to 2008?A25%B10%C15%D2.5%
Study the line graph given below to answer the following questions.
The line graph given below shows the percentage of orders delivered from Monday to Saturday of week III out of the orders received on Sunday of Week II and it also shows the number of orders returned on any given day as a percentage of total number of orders delivered till previous day.
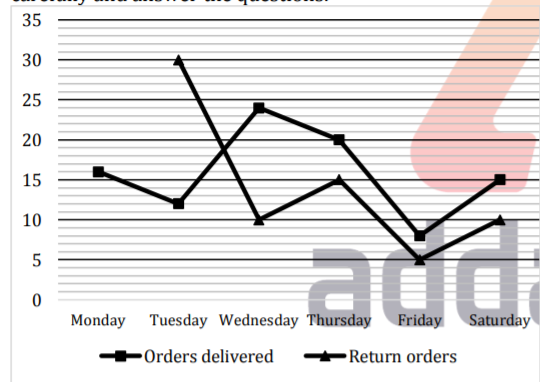
Note: • Number of orders which were yet to be delivered after Saturday of week III were 25.
• Orders cannot be returned on the same day of delivery. It has to be returned on next day of delivery and no order was returned on Sunday of Week III.
What is the ratio between the number of orders returned on Wednesday to that returned on Friday?
View SolutionStudy the line graph given below to answer the following questions.
The line graph given below shows the percentage of orders delivered from Monday to Saturday of week III out of the orders received on Sunday of Week II and it also shows the number of orders returned on any given day as a percentage of total number of orders delivered till previous day.
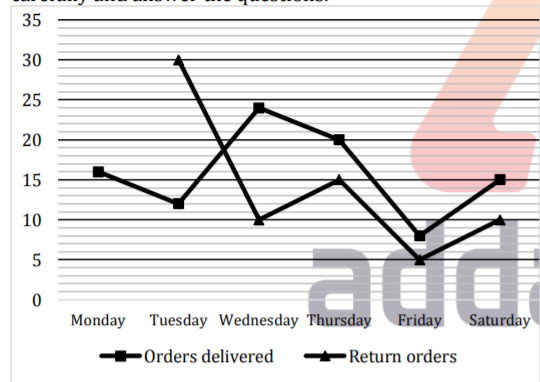
Note: • Number of orders which were yet to be delivered after Saturday of week III were 25.
• Orders cannot be returned on the same day of delivery. It has to be returned on next day of delivery and no order was returned on Sunday of Week III.
If 25 orders were returned on Sunday of week III, then what percent of the total number of orders placed on Sunday of week II were not returned by the customers till Sunday of week 2?
View SolutionStudy the following graph and answer the questions given below it.
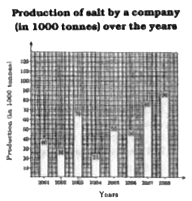
What was the percentage decline in the product of salt from 2003 to 2004 ?
View SolutionStudy the following graph and answer the question based on the graph.
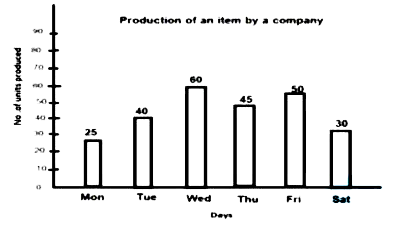
What was the percentage decline in the production from Friday to Saturday?
View SolutionStudy the following graph and answer the questions given below it.
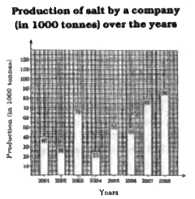
What was the percentage increase in production of salt in 2008 compared to that of 2001 ?
View Solution