The following pie chart depicts the expenditure of a state government under different heads,(if the total spending is 10 crores)
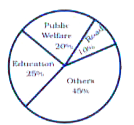
How many times is the amount of money Others spent on education compared to the amount spent on roads?
Step by step video & image solution for The following pie chart depicts the expenditure of a state government under different heads,(if the total spending is 10 crores) How many times is the amount of money Others spent on education compared to the amount spent on roads? by Maths experts to help you in doubts & scoring excellent marks in Class 8 exams.
Updated on:21/07/2023Topper's Solved these Questions
- DATA HANDLINGBOOK - NCERT EXEMPLARCHAPTER - DATA HANDLINGEXERCISE - EXERCISE (True or False)
23 Videos
- COMPARING QUANTITIESBOOK - NCERT EXEMPLARCHAPTER - COMPARING QUANTITIESEXERCISE - Think and Discuss
2 Videos
- DIRECT AND INVERSE PROPORTIONS BOOK - NCERT EXEMPLARCHAPTER - DIRECT AND INVERSE PROPORTIONS EXERCISE - THINK AND DISCUSS
2 Videos
Similar Questions
The following pie chart depicts the expenditure of a state government under different heads,
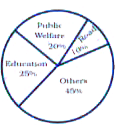
If the total spending is 10 crores, how much 20% do money was spent on roads?
View SolutionThe following pie chart depicts the expenditure of a state government under different heads,
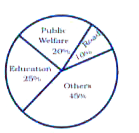
What fraction of the total expenditure is spent on both roads and public welfare together?
View Solution
Knowledge Check
The following pie chart shows percentage expenditure of a country on different heads .The total expenditure is Rs. 1.680 (in billions ). Study chart and answer the question .
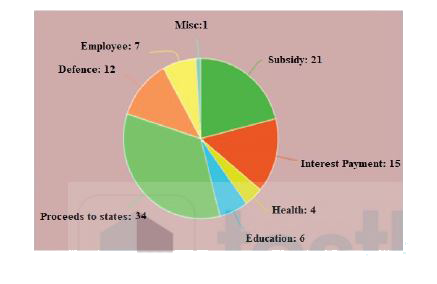
The amount of expenditure on Defence is what percentage more than the expenditure on Education ?A150%B125%C50%D100%The following pie chart shows percentage expenditure of a country on different heads. The total expenditure is Rs. 1,680 (in billions). Study the chart and answer the question.
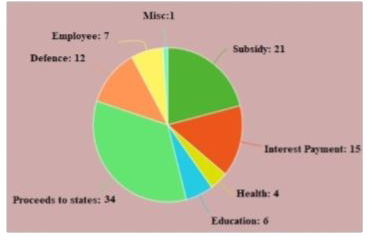
The expenditure on Education is what percentage less than the espenditure on Defence ?A150%B125%C100%D50%The following pie chart shows percentage expenditure of a country on different heads .The total expenditure is Rs. 1,680 (in billions).Study the chart and answer the question.
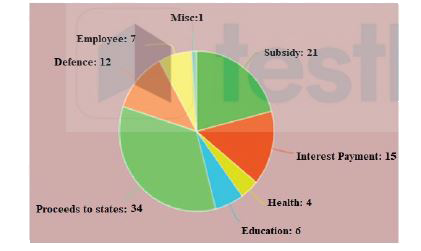
The total amount of expenditure for education and Health (in billions Rs. )is:Aa)84Bb)168Cc)126Dd)186
The following pie-chart shows the monthly expenditure of a man on various items. If he spends Rs. 16,000 per month, answer the following questions.
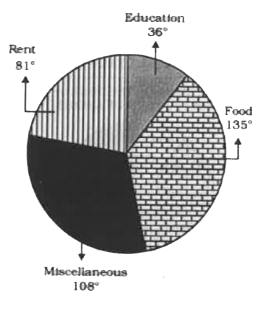
How much more does he spend on rent as compared to education ?
View SolutionThe following pie-chart shows the monthly expenditure of a man on various items. If he spends Rs. 16,000 per month, answer the following questions.
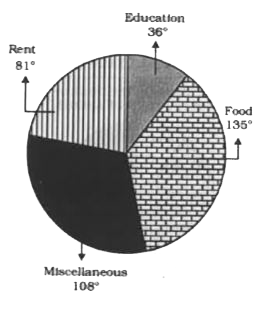
The amount he spends on education is:
View SolutionRead the following pie-chart carefully and andswer the question.
Degree of amount incurred in different Expenditure Total Expenditure = Rs. 43,200
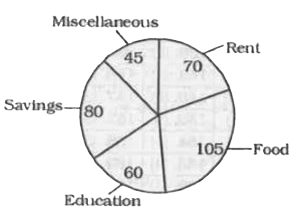
In the given pie-chart, the amount spent on education is what percent of the savings?
View SolutionThe following pie-chart shows the expenditure (in percentage) of five companies P, Q, R, S and T in the year 2016.
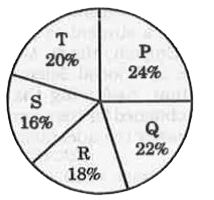
Total amount spent by company S is what percent of total amount spent by companies T and R?
View SolutionThe following pie chart represents a total expenditure of 540000 on different items in constructing a flat in a town. The percentage of the total expenditure spent on steel and cement is
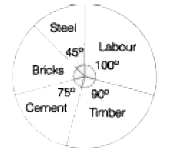
View Solution
