An LCR circuit is equivalent to a damped pendulum. In an LCR circuit the capacitor is charged to and then connected to the L and R as shown below:
If a student plots graphs of the square of maximum charge on the capacitor with time (t) for two different values of L, then which of the following graphs represents this correctly ? (plots are schematic and not drawn to scale )


The correct Answer is:A
(a)
Given
At particular time t for the is lower than that for
This means is more steeper than
Topper's Solved these Questions
- ALTERNATING CURRENT BOOK - MODERN PUBLICATIONCHAPTER - ALTERNATING CURRENT EXERCISE - COMPETITION FILE JEE (ADVANCED ) FOR IIT ENTRANCE
4 Videos
- ALTERNATING CURRENT BOOK - MODERN PUBLICATIONCHAPTER - ALTERNATING CURRENT EXERCISE - COMPETITION FILE C. MULTIPLE CHOICE QUESTIONS
17 Videos
- ALTERNATING CURRENT BOOK - MODERN PUBLICATIONCHAPTER - ALTERNATING CURRENT EXERCISE - COMPETITION FILE (OBJECTIVE TYPE QUESTIONS) B. MULTIPLE CHOICE QUESTIONS
15 Videos
- ATOMS BOOK - MODERN PUBLICATIONCHAPTER - ATOMS EXERCISE - Chapter Practice Test
16 Videos
Similar Questions
An LCR curcuit is equivalent to a damped pendulum. In an LCR circuit the capacitor is charged to (Q0) and then connected to the L ans R as shown below.
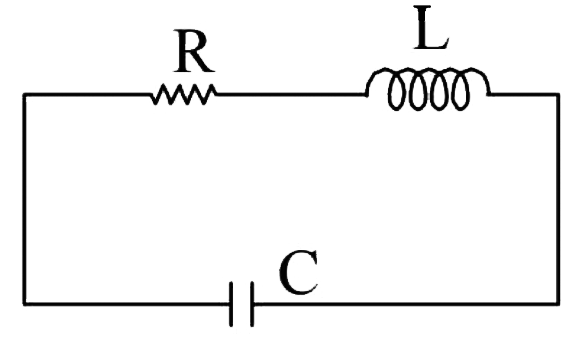
If a student plaots graphs of the square of maximum charge (Q2max) on the capacitor with time (t) for two different values L1andL2(L1>L2) of L then which of the following represents this graph correclty? (plots are schematic and not drawn to scale).
View SolutionAn LCR curcuit is equivalent to a damped pendulum. In an LCR circuit the capacitor is charged to (Q0) and then connected to the L ans R as shown below.

If a student plaots graphs of the square of maximum charge (Q2max) on the capacitor with time (t) for two different values L1andL2(L1>L2) of L then which of the following represents this graph correclty? (plots are schematic and not drawn to scale).
View Solution
Knowledge Check
An LCR curcuit is equivalent to a damped pendulum. In an LCR circuit the capacitor is charged to (Q0) and then connected to the L ans R as shown below.

If a student plaots graphs of the square of maximum charge (Q2max) on the capacitor with time (t) for two different values L1andL2(L1>L2) of L then which of the following represents this graph correclty? (plots are schematic and not drawn to scale).A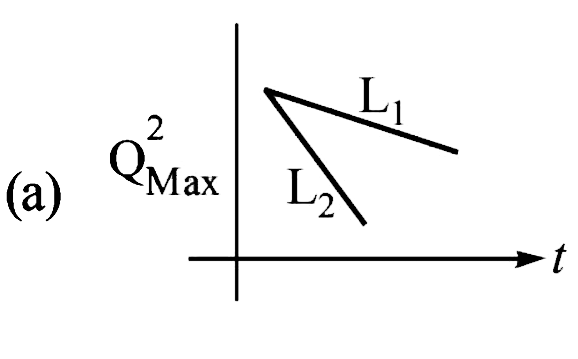 B
B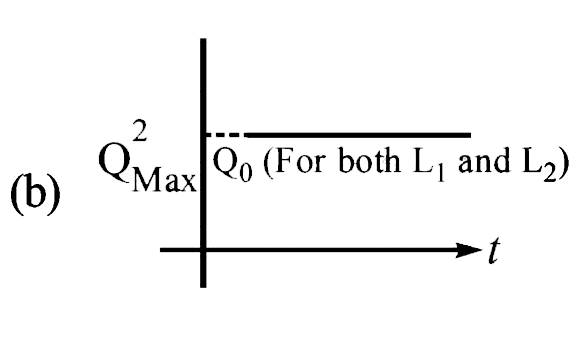 C
C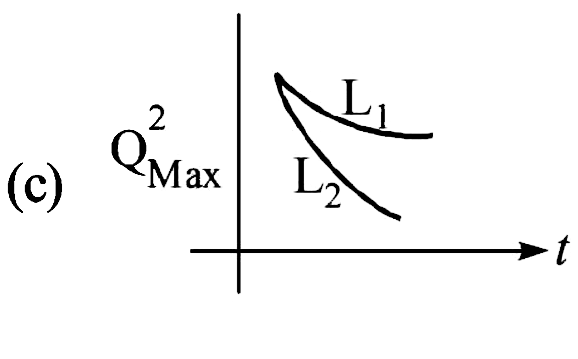 D
D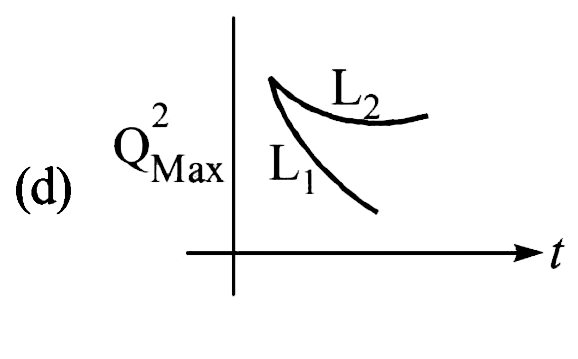
An LCR circuit is equivalent to a damped pendulum In an LCR circuit the capacitor is charged to Q0 and then connected to the L and R as shown below : Thus potential energy stored in the capacitor and that in the inductor also oscillates between maximum value an zero with double the frequency.
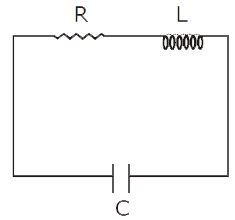
If a student plots graphs of the square of maximum charge (Q2max) on the capacitor with time (t) for two different values L1andL2(L1>L2) of L then which of the following reprersent this graph correctly ? (Plots are shematic and not drawn to scale )A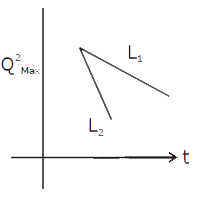 B
B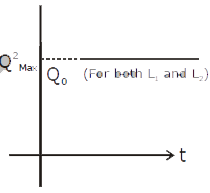 C
C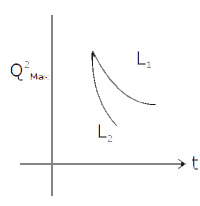 D
D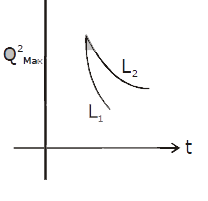
In LCR circuit, capacitor C is changed to 4C, then what should be the value of L to keep resonance frequency same
A2 LBL/2CL/4D4L
A L-C-R circuit is equivalent to a damped pendulum . In an L-C-R circuit the capacitor is charged to Qo and then connected to the L and R as shown below.
If a student plots graph of the square of maximum charge on the capacitor with time (t) for two different values L1 and L2 (L1gtL2of L), then which of the following represents this graph correctly (plots are schematic and not drawn to scale)

View SolutionIn the circuit shown in the figure, if both the lamps L1 and L2 are identical

View Solution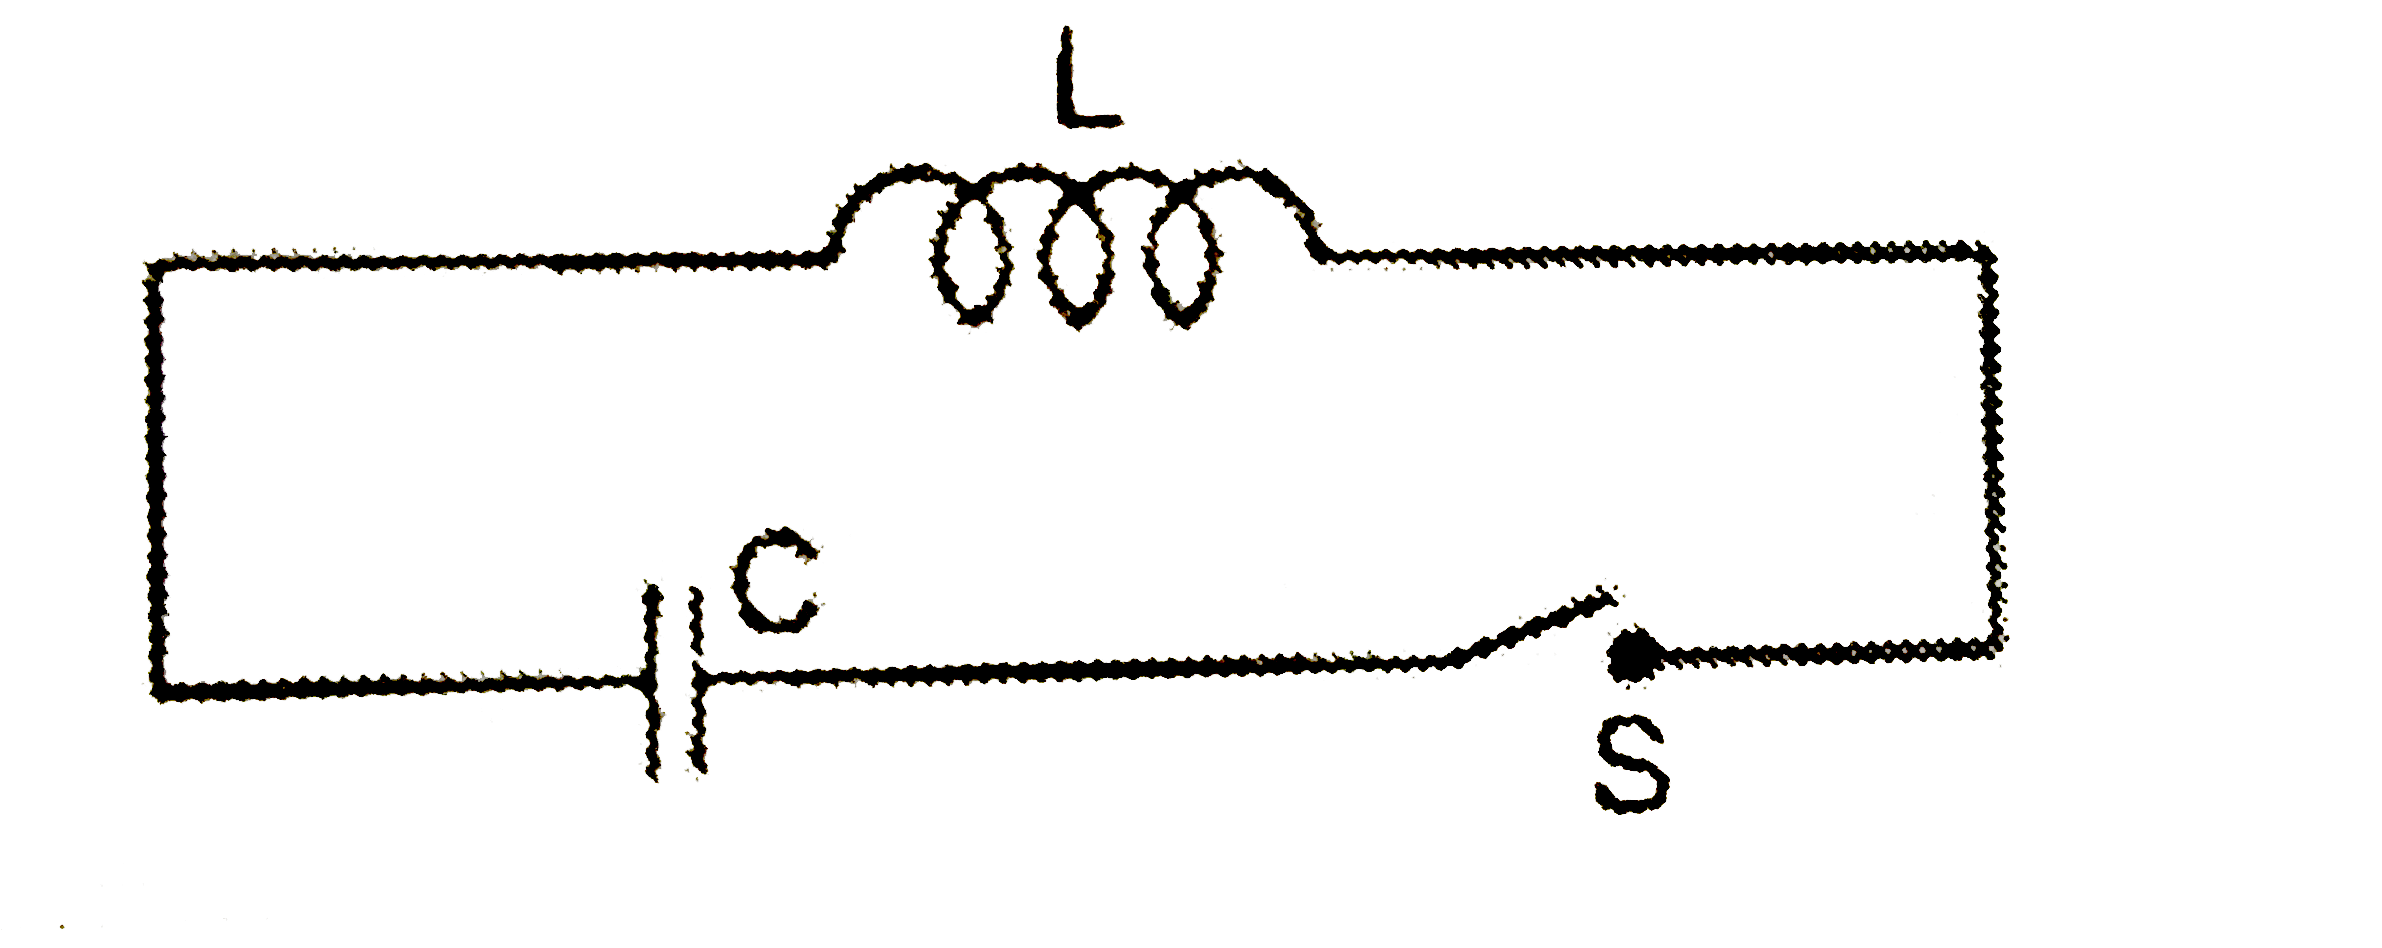
The capacitor of capacity C is given charge Q and then connected to the coil of inductance L by closing the switch S. The maximum current flowing in the circuit at any later time will be
View SolutionWhich of the following graphs represent the variation of current(I) with frequency (f) in an AC circuit containing a pure capacitor?
View SolutionThe current in an L - R circuit in a time t = 2L / R reduces to-
View Solution
