In an experiment on the photoelectric effect , the slope of the cut - off voltage versus frequency of incident light is found to be 4.12×10⁻¹⁵V s . The value of Planck's constant is
Given , slope of graph , m =4.12×10⁻¹⁵Vs
Since , m=he
∴H=e×m
=1.6×10−19×4.12×10−15
=6592×10−34Js
Topper's Solved these Questions
- DUAL NATURE OF RADIATION AND MATTER BOOK - MODERN PUBLICATIONCHAPTER - DUAL NATURE OF RADIATION AND MATTER EXERCISE - NCERT FILE (NCERT - Additional Exercises)
18 Videos
- DUAL NATURE OF RADIATION AND MATTER BOOK - MODERN PUBLICATIONCHAPTER - DUAL NATURE OF RADIATION AND MATTER EXERCISE - NCERT FILE (NCERT - Exemplar Problems - Objective Questions (Multiple Choice Questions (Type - I)))
8 Videos
- DUAL NATURE OF RADIATION AND MATTER BOOK - MODERN PUBLICATIONCHAPTER - DUAL NATURE OF RADIATION AND MATTER EXERCISE - Tough & Tricky PROBLEMS
6 Videos
- CURRENT ELECTRICITYBOOK - MODERN PUBLICATIONCHAPTER - CURRENT ELECTRICITYEXERCISE - Chapter Practice Test
15 Videos
- ELECTRIC CHARGES AND FIELDS BOOK - MODERN PUBLICATIONCHAPTER - ELECTRIC CHARGES AND FIELDS EXERCISE - Chapter Practice Test
15 Videos
Similar Questions
In an experiment on photoelectric effect, the slope of the cut-offf voltage versus frequency of incident light is found to be 4.12×10⁻¹⁵V s. calculate the value of Planck's constant.
View SolutionIn an experiment on photoelectric effect, the slope of the cut off voltage versus frequency of incident light is found to be 4.12×10⁻¹⁵Vs. Given e=1.6×10⁻¹⁹C, estimate the value of Planck's constant.
View Solution
Knowledge Check
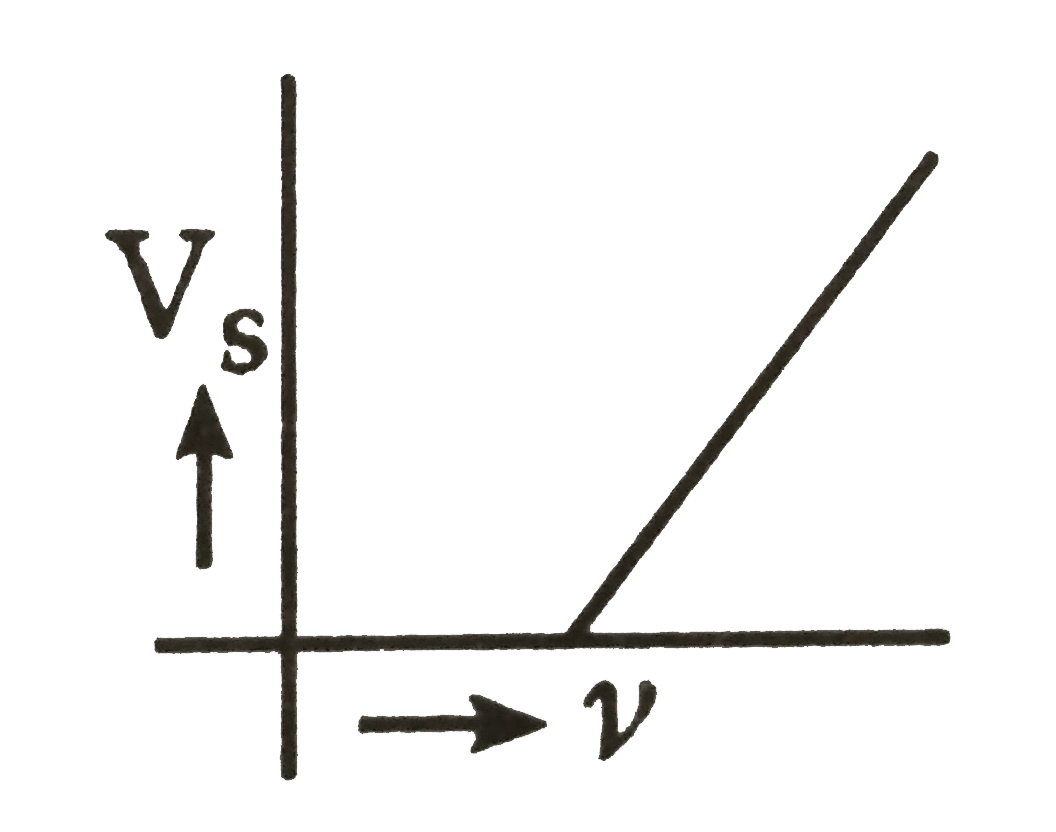
In photoelectric effect the slope of stop of stopping potential versus frequency of incident light for a given surface will be
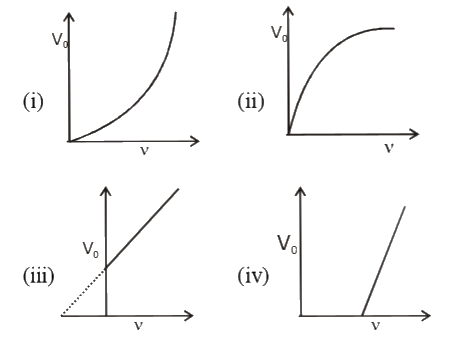
Ahe−1Be hCeDhFor a photoelectric cell, the graph shown the variation of cut off voltage (V0) with frequency (v) of incident light is
 A(i)B(ii)C(iii)D(iv)
In photo electric effect, the slope of the straight line graph between stopping potential and frequency of the incident light gives the ratio of Planck's constant to
Acharge of electronBwork functionCphoto electric currentDK.E. of electron
In photoelectric effect the slope of straight line graph between stopping potential (Vs) and frequency of incident light (v) gives

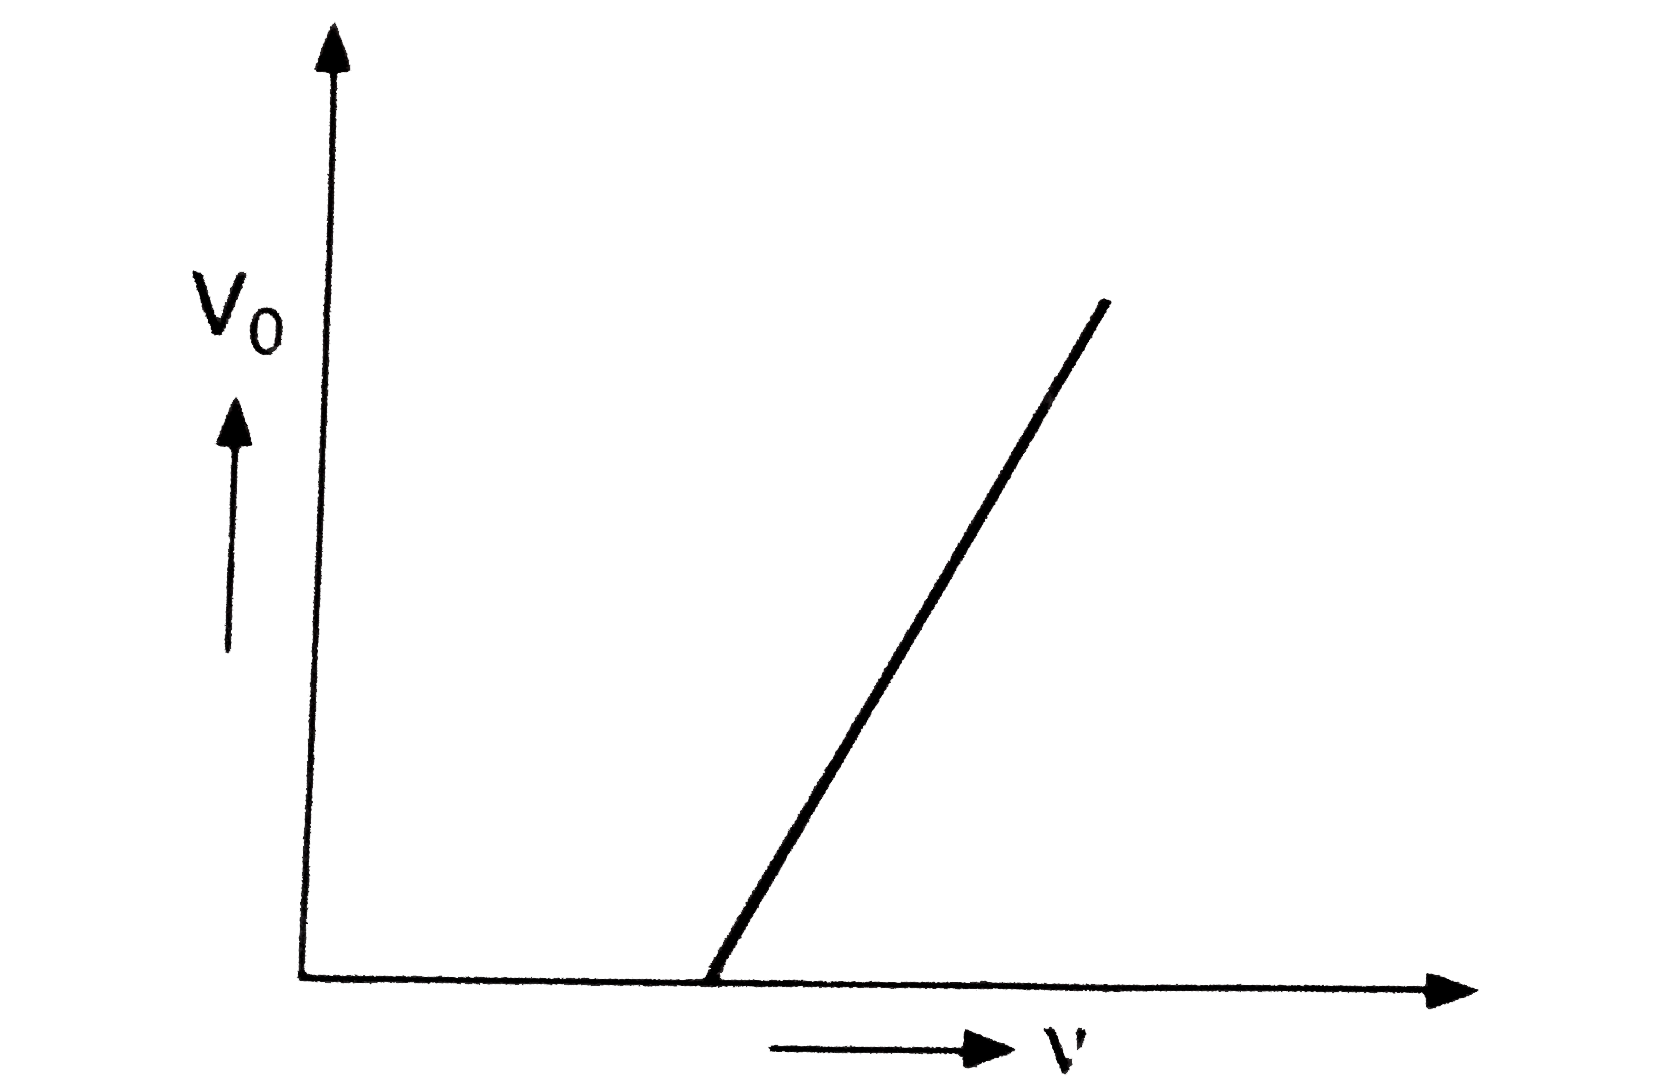
View SolutionFor a photoelectric cell the graph showing the variation of cut of voltage (V) with frequency (v) of incident light is best represented by
View SolutionIn photoelectric effect the slope of straight line graph between stopping potential (V0) and freqency of incident light (v) gives:

View SolutionFor a photoelectric cell the graph showing the variation of cut of voltage (V0) with frequency (v) of incident light is best represented by

View Solution
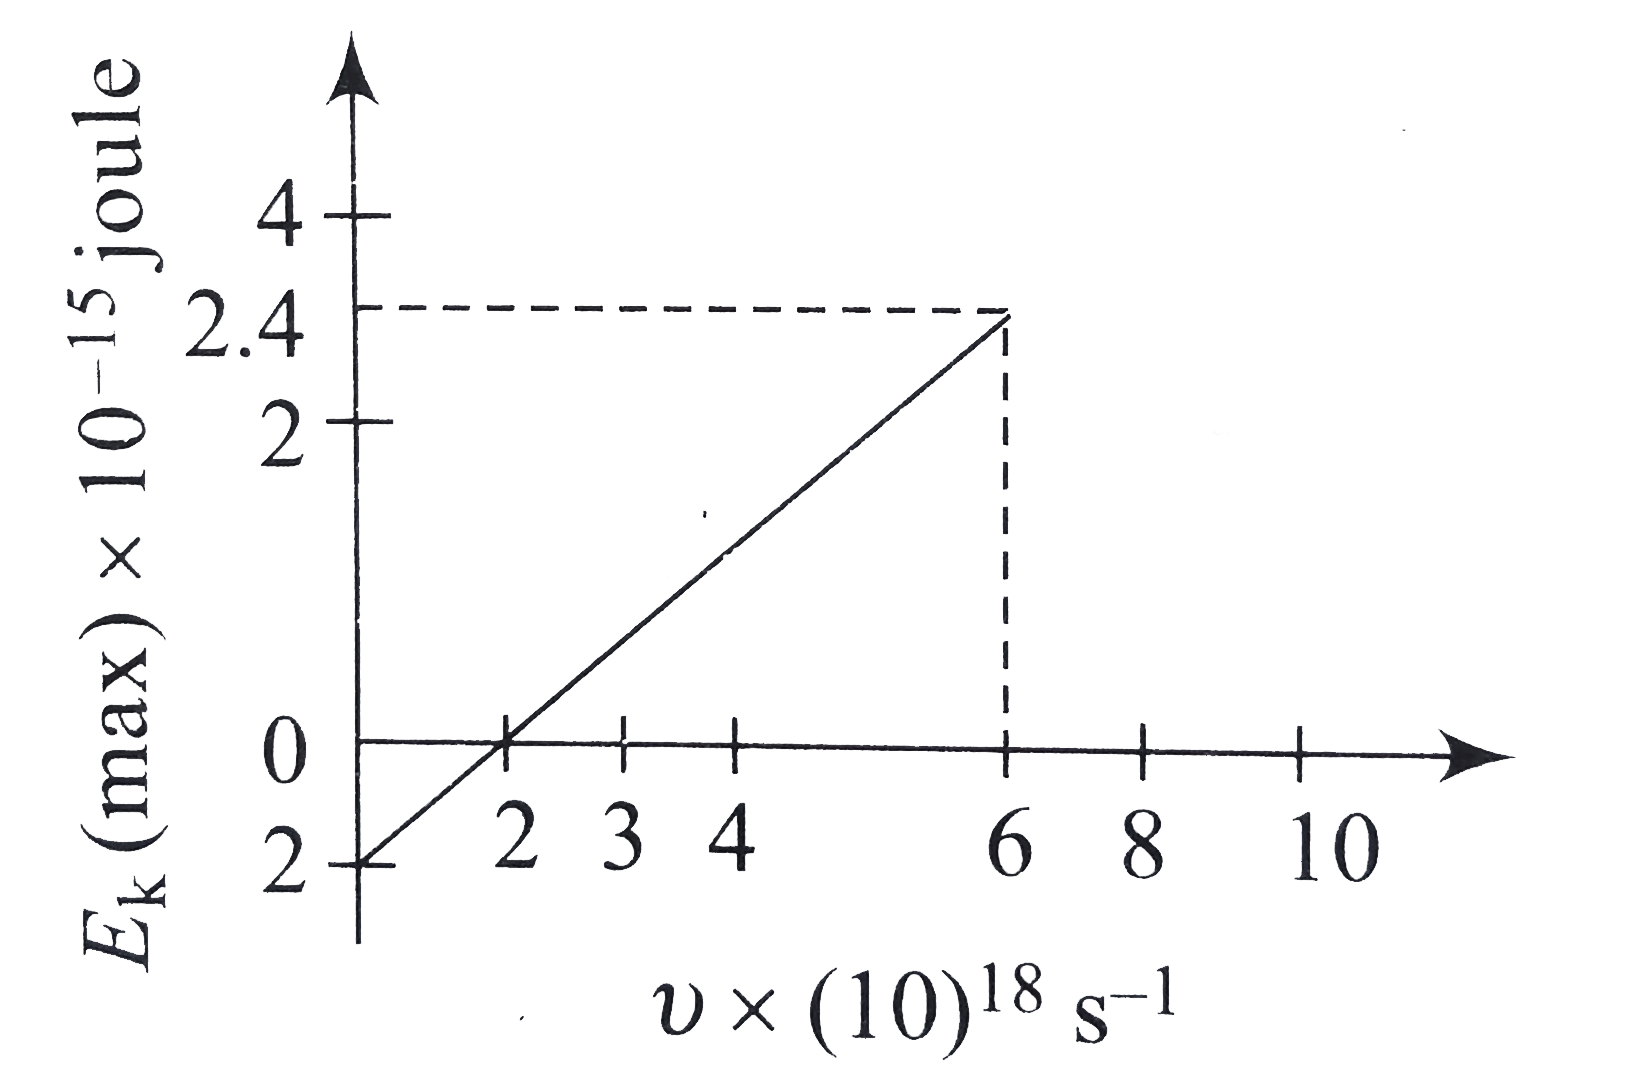
In the experiment on photoelectric effect, the graph between EK(max) and v is found to be a straight line as sshoen in fig. The threshold frequency and Planck's constant according to this graph are
View Solution
