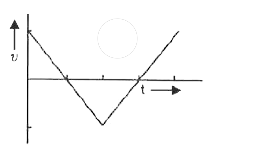
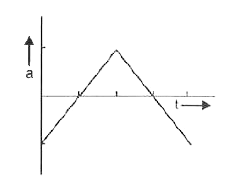
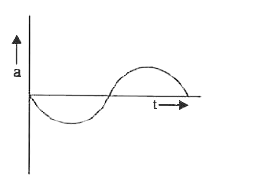
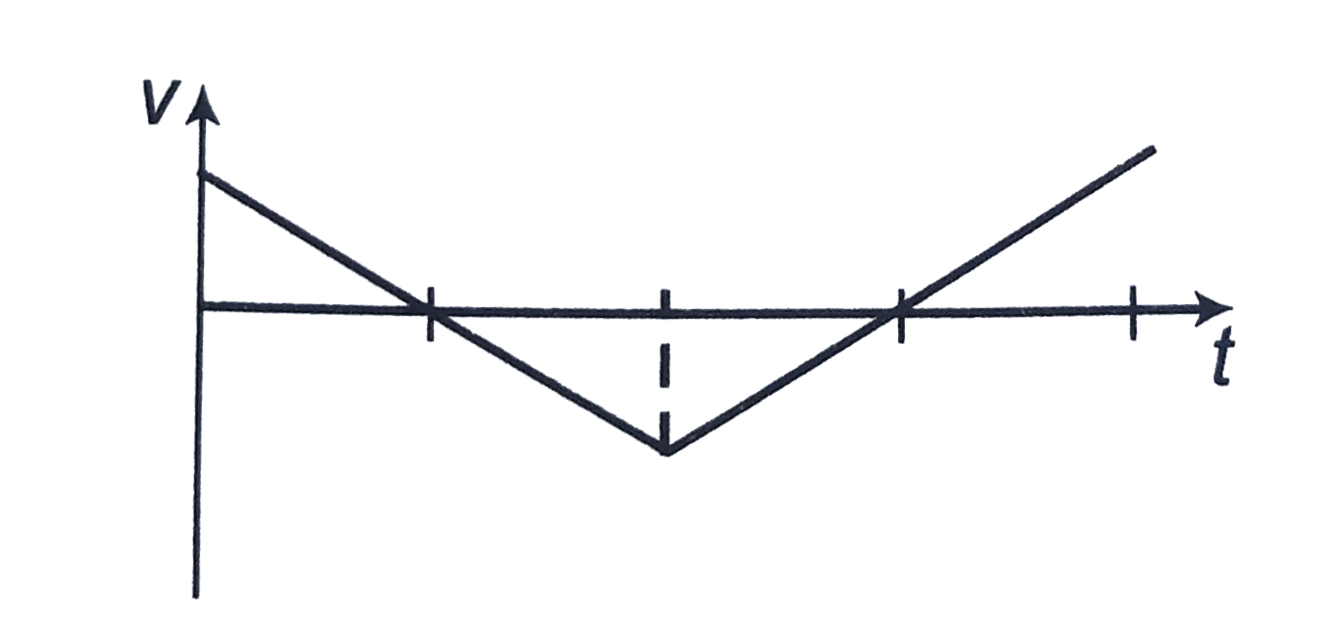
The graph shown in Fig. shows the velocity v tk versus time for a body, Which of the graphs shown below represents the corresponding accelera-tion versus time graphs ?
 Solution in Kannada
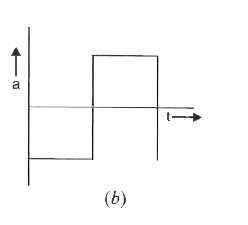

The correct Answer is:b
Acceleration is negative and consatant for first half .It is positive and consatnt over next half. This is represented ny the graph
Topper's Solved these Questions
- BOOK - MODERN PUBLICATIONCHAPTER - DESCRIPTION OF MOTION IN ONE DIMENSION EXERCISE - Recent Competitive Question12videos
DESCRIPTION OF MOTION IN ONE DIMENSION
- BOOK - MODERN PUBLICATIONCHAPTER - DESCRIPTION OF MOTION IN ONE DIMENSION EXERCISE - Revision Test45videos
DESCRIPTION OF MOTION IN ONE DIMENSION
- BOOK - MODERN PUBLICATIONCHAPTER - DESCRIPTION OF MOTION IN ONE DIMENSION EXERCISE - Revision Test45videos
DESCRIPTION OF MOTION IN ONE DIMENSION
- BOOK - MODERN PUBLICATIONCHAPTER - CURRENT ELECTRICITYEXERCISE - RECENT COMPETITIVE QUESTIONS32videos
CURRENT ELECTRICITY
- BOOK - MODERN PUBLICATIONCHAPTER - DESCRIPTION OF MOTION IN TWO AND THREE DIMENSIONEXERCISE - Revision TEST36videos
DESCRIPTION OF MOTION IN TWO AND THREE DIMENSION
Similar Questions
A train is moving slowly on a straight track with a constant speed of 2 m s−1 . A passengers in the train starts walking at a stready speed of 2 m s−1 to the back of the train in the opposite direction of the motion of the train. So to an observer standing on the platform directly in front of that passenger, the velocity of the passenger appears to be
02:44View SolutionThe acceleration of a particle increasing linearly with timer is be. The particle starts from the origin with an initial velocity, The distance travelled by the particle in time will be
02:14View SolutionThe acceleration of a particle increasing linearly with timer is be. The particle starts from the origin with an initial velocity, The distance travelled by the particle in time will be
03:05View SolutionA battery of emf E has an internal resistance r. A variable resistance R is connected to the terminals of the battery. A current i is drawn from the battery. V is the terminal potential difference. If R alone is gradually reduced to zero, which of the following best describes i and V?
01:26View SolutionThe torque of a force →F=−3ˆi+ˆj+5ˆk acting at a point is →τ. If the position vector of the point vector of the point is 7ˆi+3ˆj+ˆk, then →τ is :
02:47View SolutionVelocity versus displacement graph of a particle moving in a straight line as shown in figure. The corresponding acceleration versus velocity graph will be .
02:22View SolutionPressure versus temperature graph of an ideal gas as shown in Fig. Corresponding density (rho) versus volume (V) graph will be
02:23View SolutionThe graph of displacement versus time is shown. Its corresponding velocity-time graph will be.
03:21View SolutionVelocity versus displacement graph of a particle moving in a straight line is shown in figure. Corresponding acceleration versus velocity graph will be.
03:53View SolutionThe graph below shws the velocity versus time graph for a body
Which of the following graph represents the corresponding acceleration v//s time graph?01:08View SolutionVelocity (v) versus displacement (s) graph of a particle moving in a straight line is shown in figure. Corresponding acceleration (a) versus velocity (v) graph will be
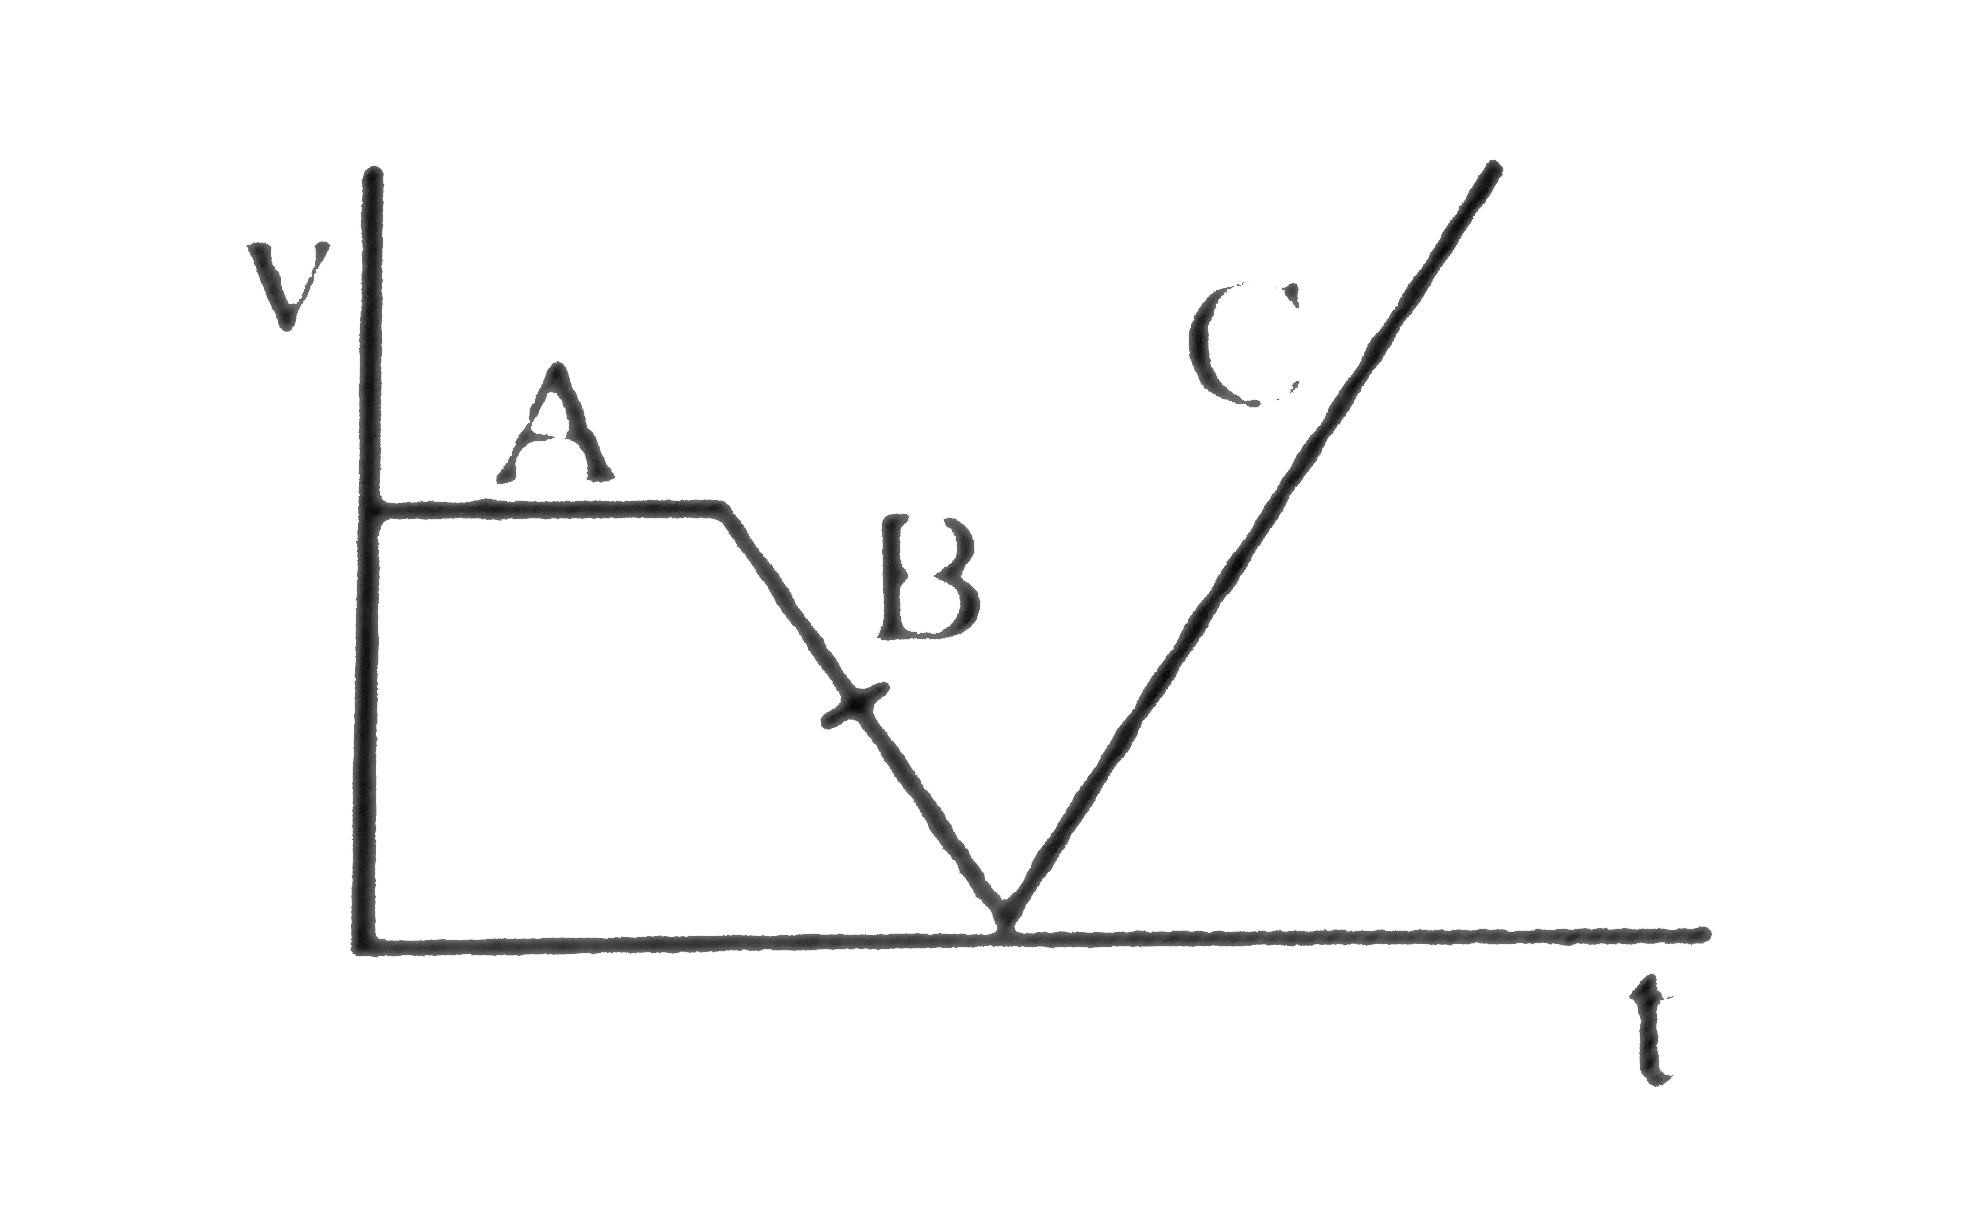
05:03View SolutionVelocity versus time graph of a body is shown in figure. It explains that
 04:10View Solution
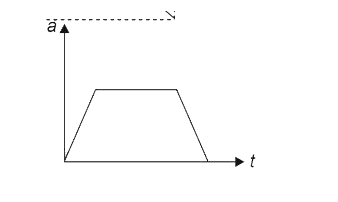
Acceleration versus time graph of a particle moving in a straight line is as shown in adjoining figure. If initially particle was at rest. Then corresponding kinetic energy versus time graph will be :
 04:16View Solution
The graph in figure shows the velocity v versus time t for a body. Which of the graphs shown in figure represents the correesponding acceleration versus time graphs ?
02:46View SolutionVelocity versus displacement graph of a particle moving in a straight line as shown in figure.
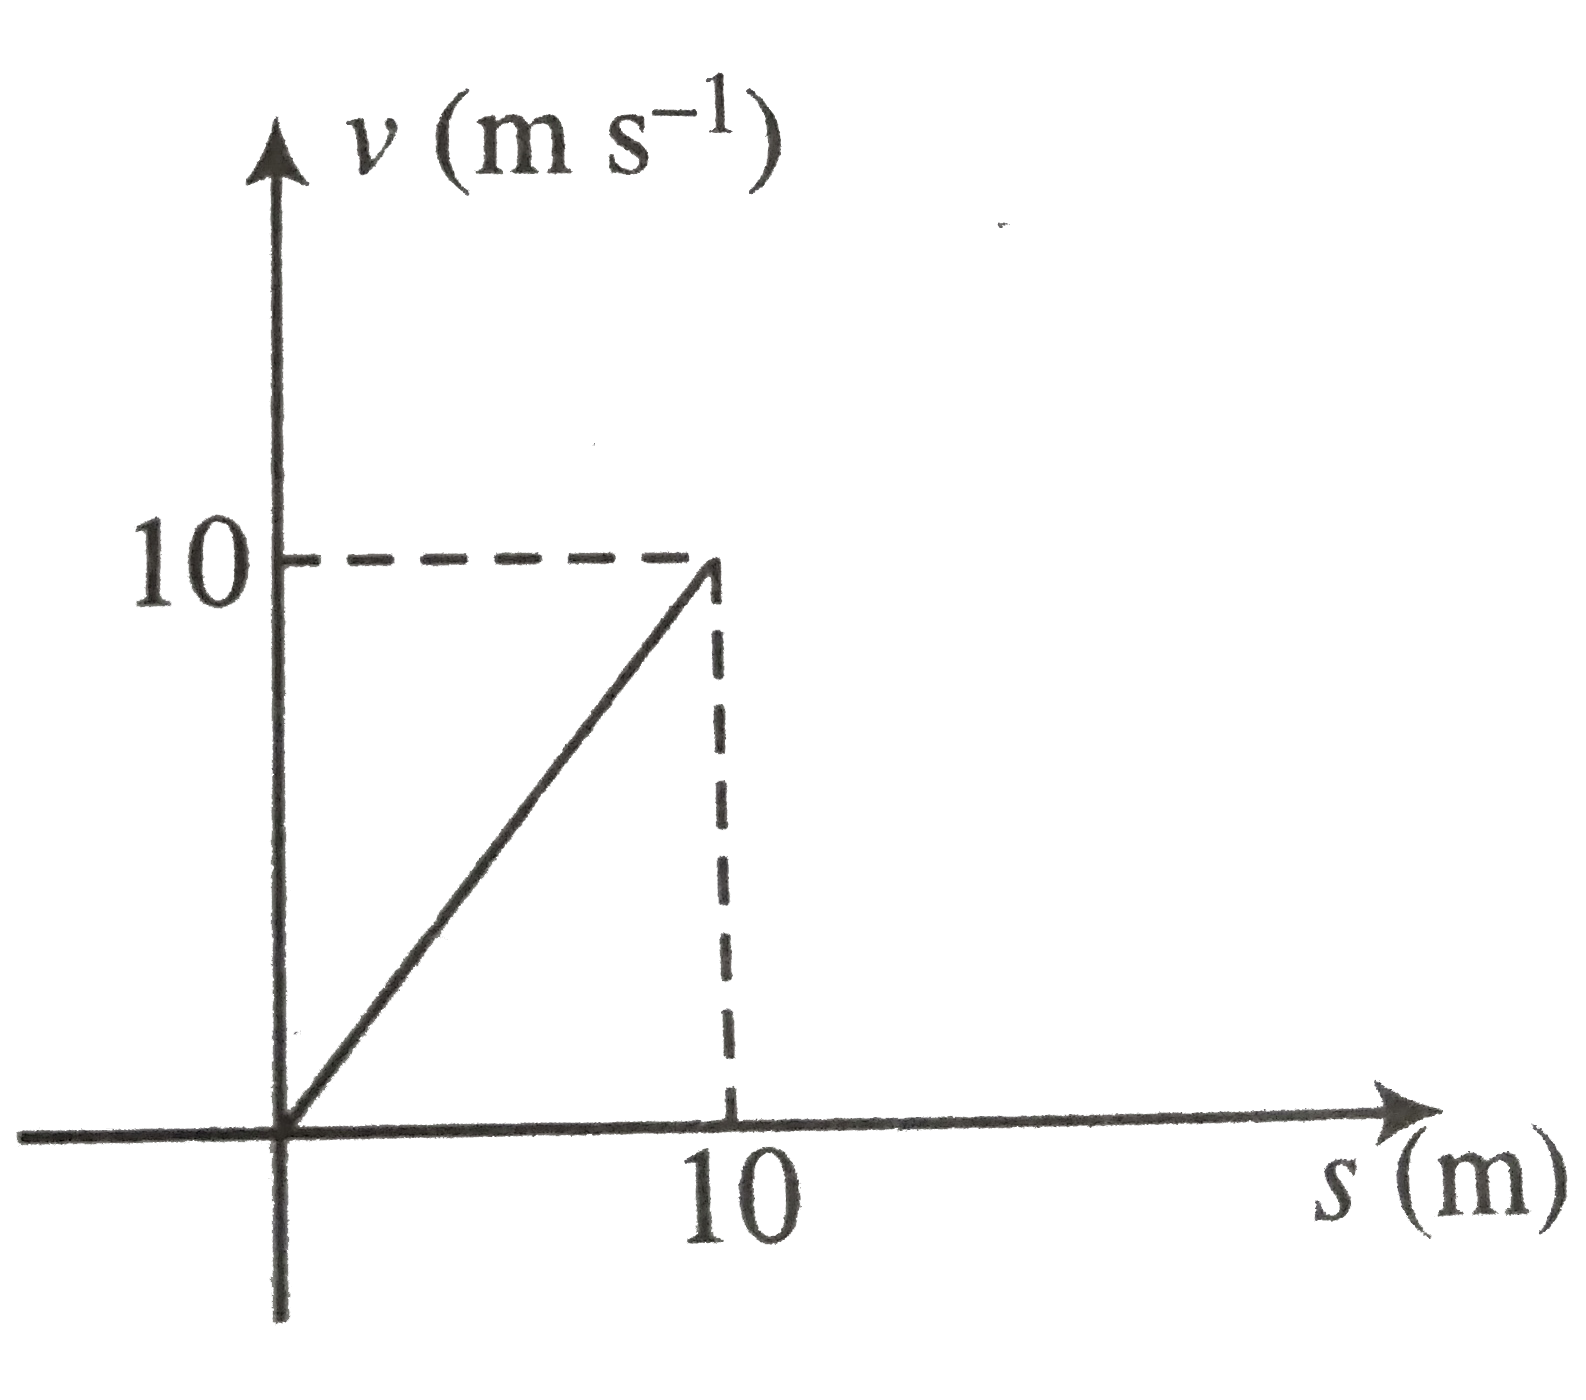
The corresponding acceleration versus velocity graph will be .08:31View Solution

