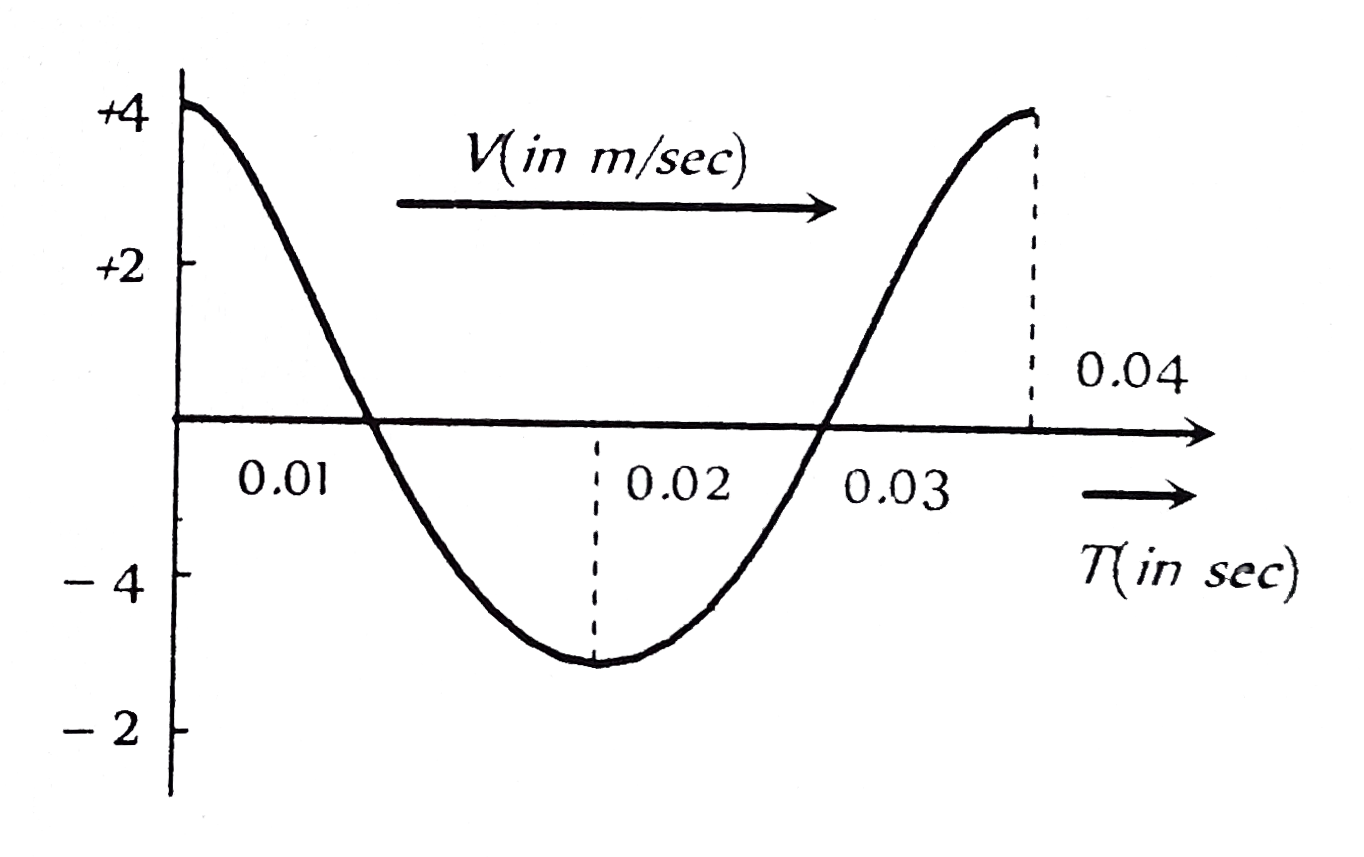
The velocity -time graph of harmonic oscillator is shown in the given figure. The frequency of oscillation is :

25 Hz
50 Hz
12.25 Hz
none of these.
The correct Answer is:A
Velocity becomes maximum to zero in time T/4.
∴ T4=0.01 s.
T=0.04 s.
v=1T=10.04=25 Hz
Hence correct choice is (a).
Topper's Solved these Questions
- OSCILLATIONSBook:MODERN PUBLICATIONChapter:OSCILLATIONSExercise:MCQ (LEVEL-II)
Explore 62 Videos
- OSCILLATIONSBook:MODERN PUBLICATIONChapter:OSCILLATIONSExercise:MCQ (LEVEL-III) Questions From AIEEE/JEE Examination
Explore 10 Videos
- MOCK TEST-3Book:MODERN PUBLICATIONChapter:MOCK TEST-3Exercise:MCQs
Explore 49 Videos
- PROPERTIES OF MATTERBook:MODERN PUBLICATIONChapter:PROPERTIES OF MATTERExercise:RECENT COMPETITIVE QUESTIONS
Explore 17 Videos
Similar Questions
Knowledge Check
The velocity-time diagram of a harmonic oscillator is shown in the adjoining figure. The frequency of oscillation is
 A25 HzB50 HzC12.25 HzD33.3 Hz
The frequency of LC oscillation is given by
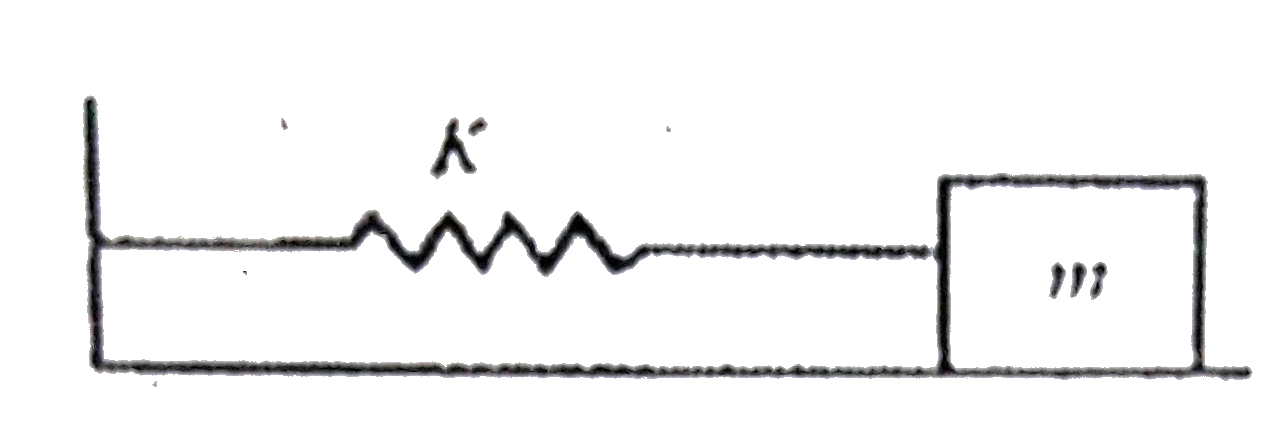
Af=12π√LCBf=2π√LCCf=1π√LCDf=14πε0√LCFrom the given figure find the frequency of oscillation of the mass m
 An=12π√KmBn=12π√K22mCn=2π√m2KDn=12n√K2m
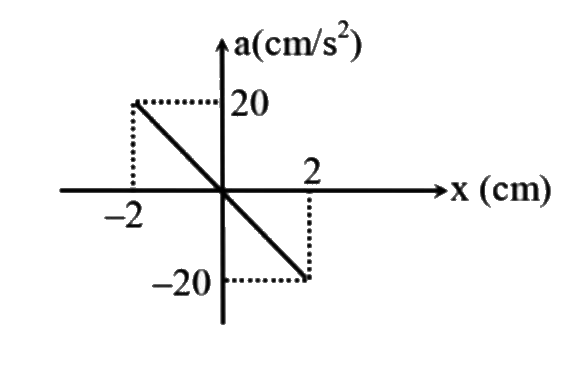
The acceleration-displacement graph of a particle executing simple harmonic motion is shown in the figure. The frequency of oscillation is

View SolutionThe acceleration-displacement graph of a particle executing simple harmonic motion is shown in the figure. The frequency of oscillation is

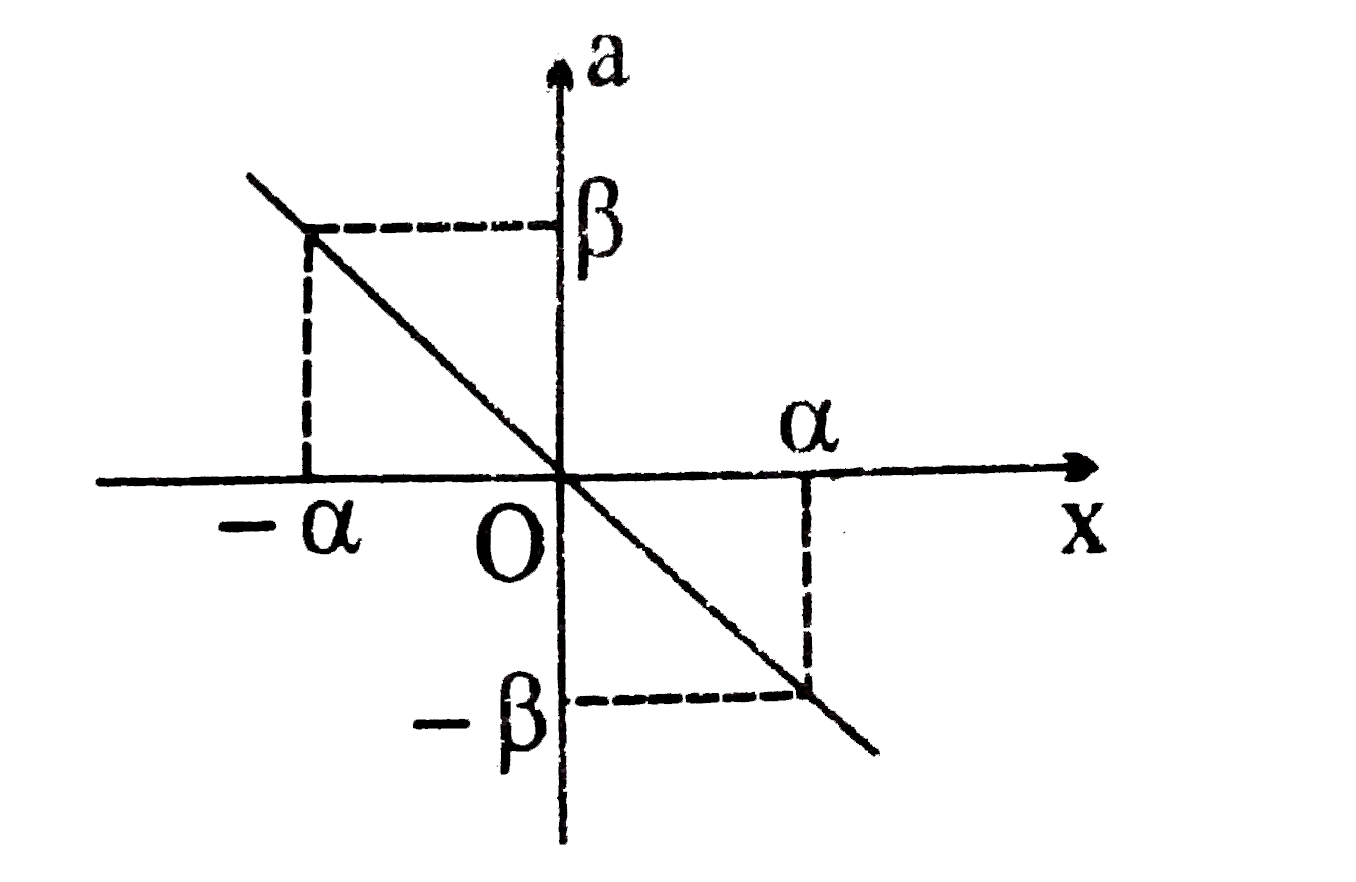
View SolutionAcceleration displacement (a-x) graph of a particle executing S.H.M. is shown in the figure. The frequency of oscillation is (tanθ=8)
View SolutionThe acceleration-displacement (a−X) graph of a particle executing simple harmonic motion is shown in the figure. Find the frequency of oscillation.

View SolutionThe acceleration-displacement (a−X) graph of a particle executing simple harmonic motion is shown in the figure. Find the frequency of oscillation.

View Solution
