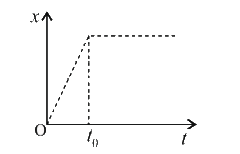
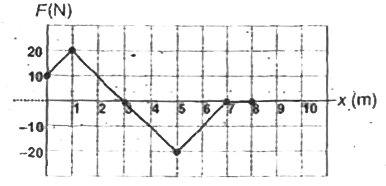
In the figure a graph is plotted which shows the variation of the x- component of a force that acts on a particle moving along the x-axis, with x. The particle starts from rest from the origin. Then
Step by step video & image solution for In the figure a graph is plotted which shows the variation of the x- component of a force that acts on a particle moving along the x-axis, with x. The particle starts from rest from the origin. Then by Physics experts to help you in doubts & scoring excellent marks in Class 11 exams.
Similar Questions
Knowledge Check
- Question 1 - Select One
Figure show the displacement - time graph of a particle moving on the x-axis
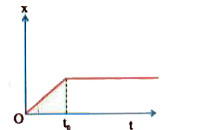 Athe particle is continuously going in positive X directionBthe particle is at restCthe velocity increases up to a time t0 and then becomes constant.Dthe particle moves at constant velocity up to a time t0 and then stops.
 - Question 2 - Select One
For a particle moving along x−axis, speed must be increasing for the following graph :
A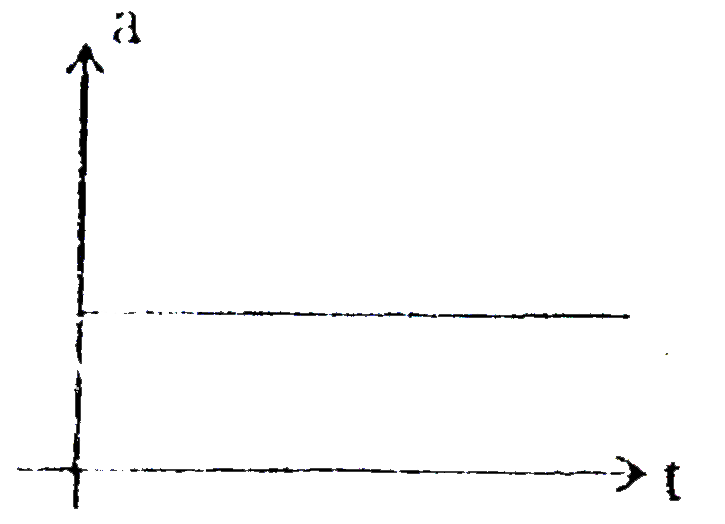 B
B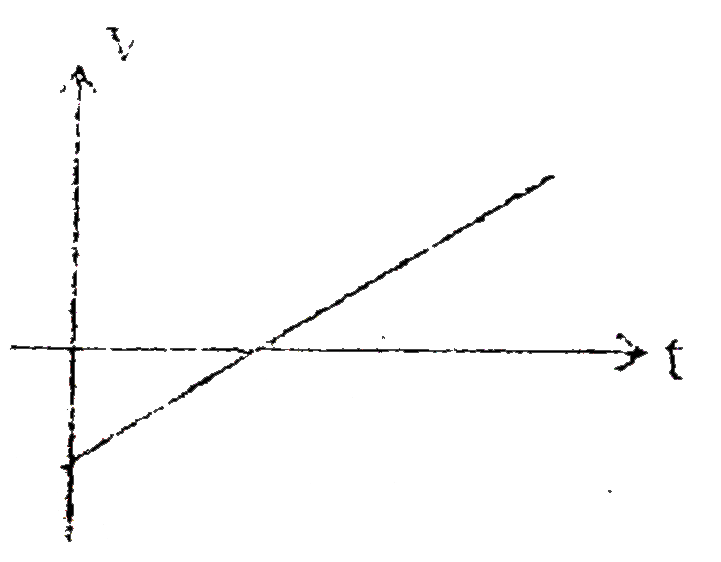 C
C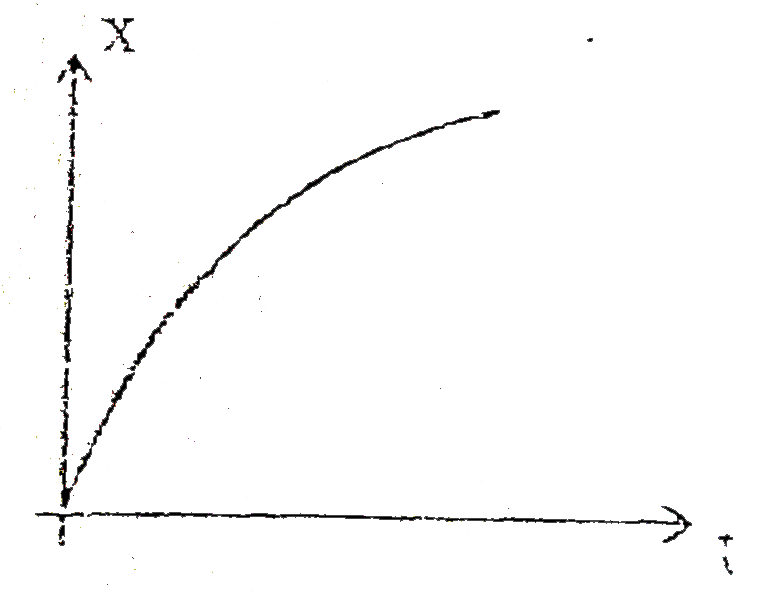 D
D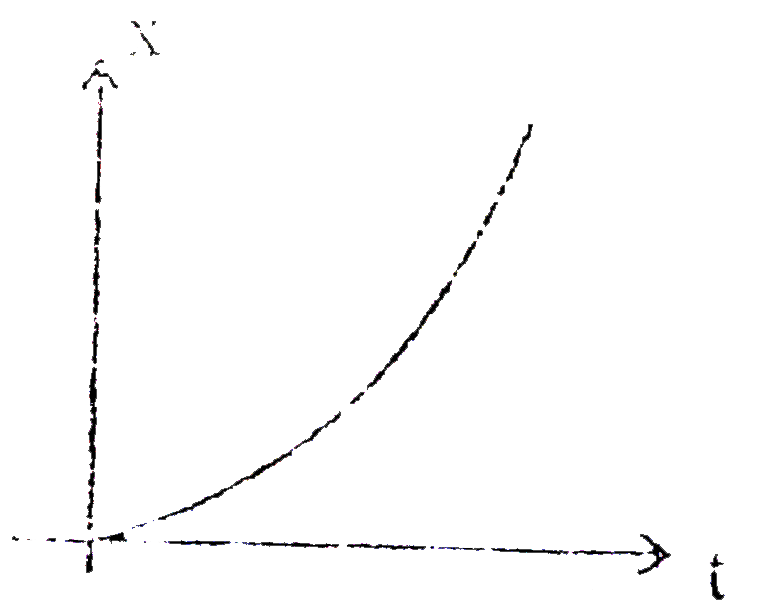
- Question 3 - Select One
Figure shows a plot of the potential energy as a function of x for a particle moving along the x-axis. Which of the following statement(s) is/are true?
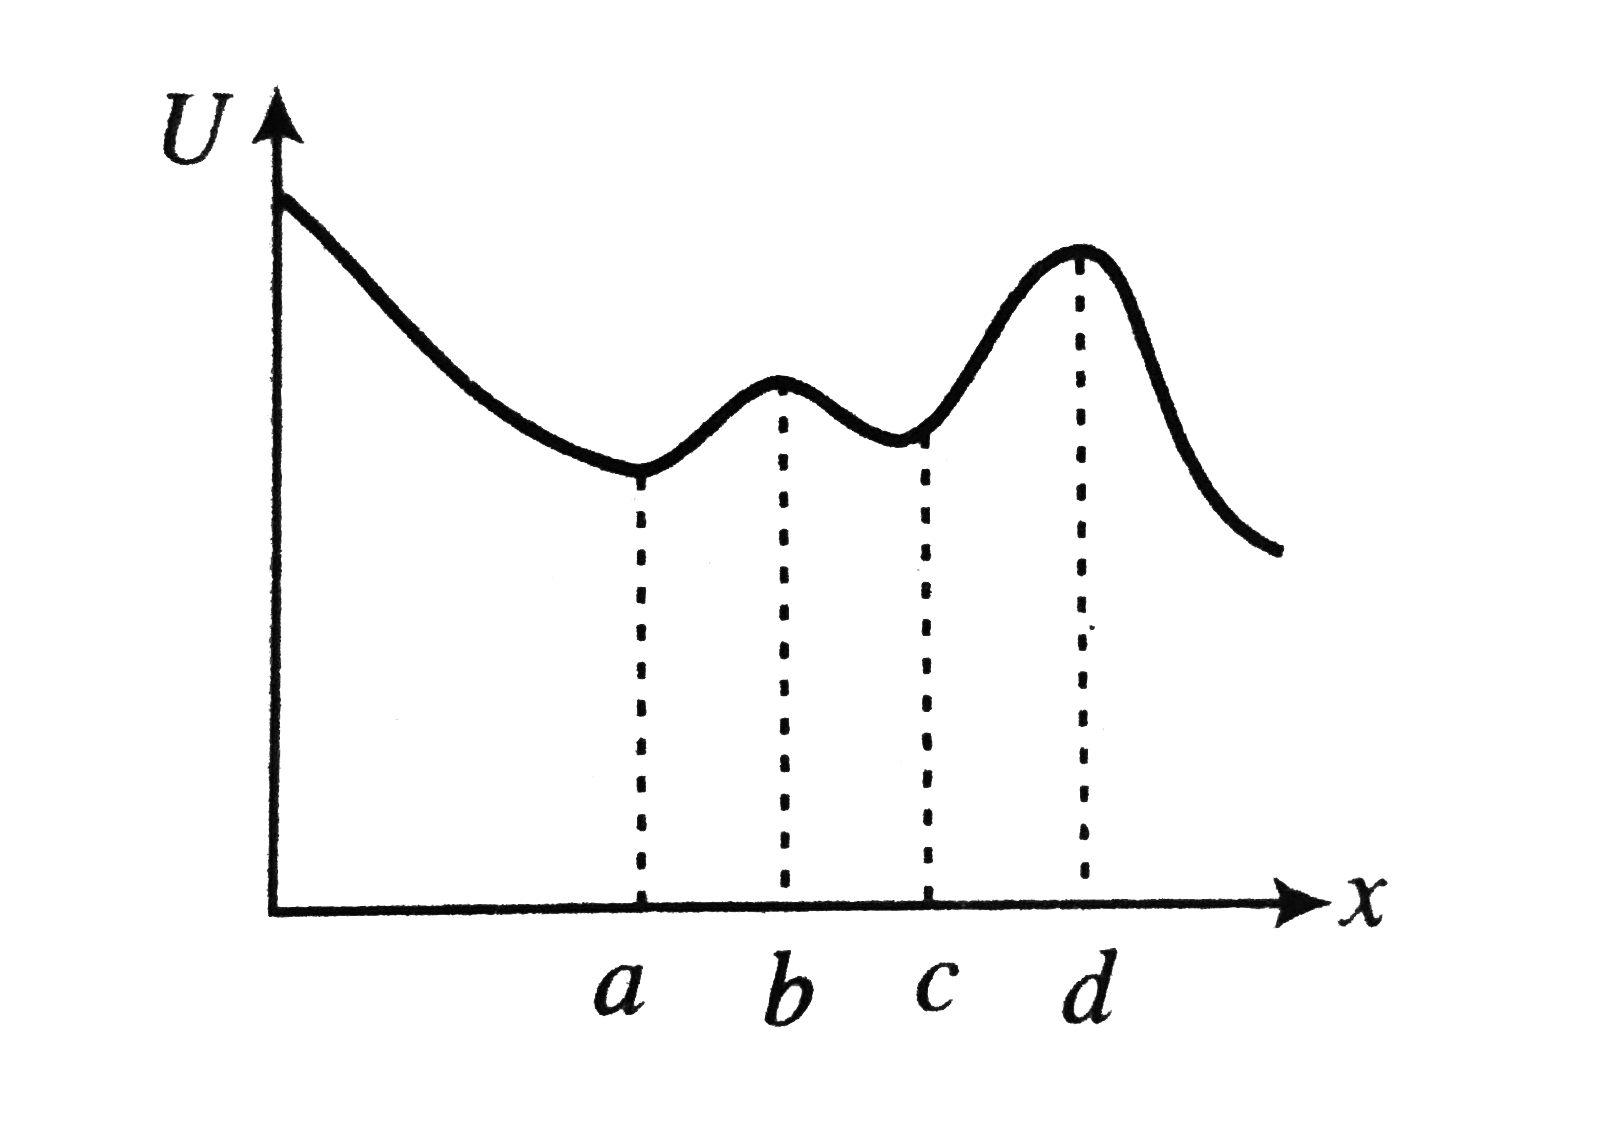 Aa, c, and d are points of equilibriumBa is a point of stable equilibriumCb is a unstable equilibrium pointDAll of the above
Find the equation of trajectory of a particle whose velocity components are
vx=2x+1,vy=2y+3
Given that particle starts from rest from origin.View SolutionThe given figure shows a plot of the time dependent force Fx acting on a particle in motion along the x-axis. What is the total impulse delivered by this force to the particle from time t = 0 to t = 2second?
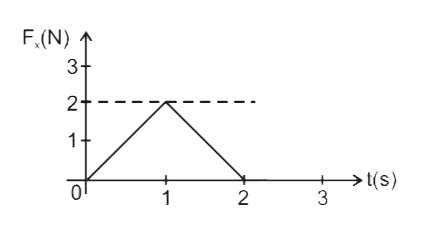 View Solution
Figure shows the variation of a force F acting on a particle along x-axis. If the particle begins at rest at x = 0, what is the particle's coordinate when it again has zero speed?
 View Solution
Velocity time graphs of particles A and B moving along x-axis are shown here. Both A and B start from origin:
 View Solution
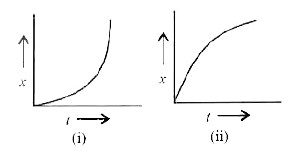
Figure (i) and (i) show the displacement-time graphs of two particles moving along the x-axis. We can say that
 View Solution


