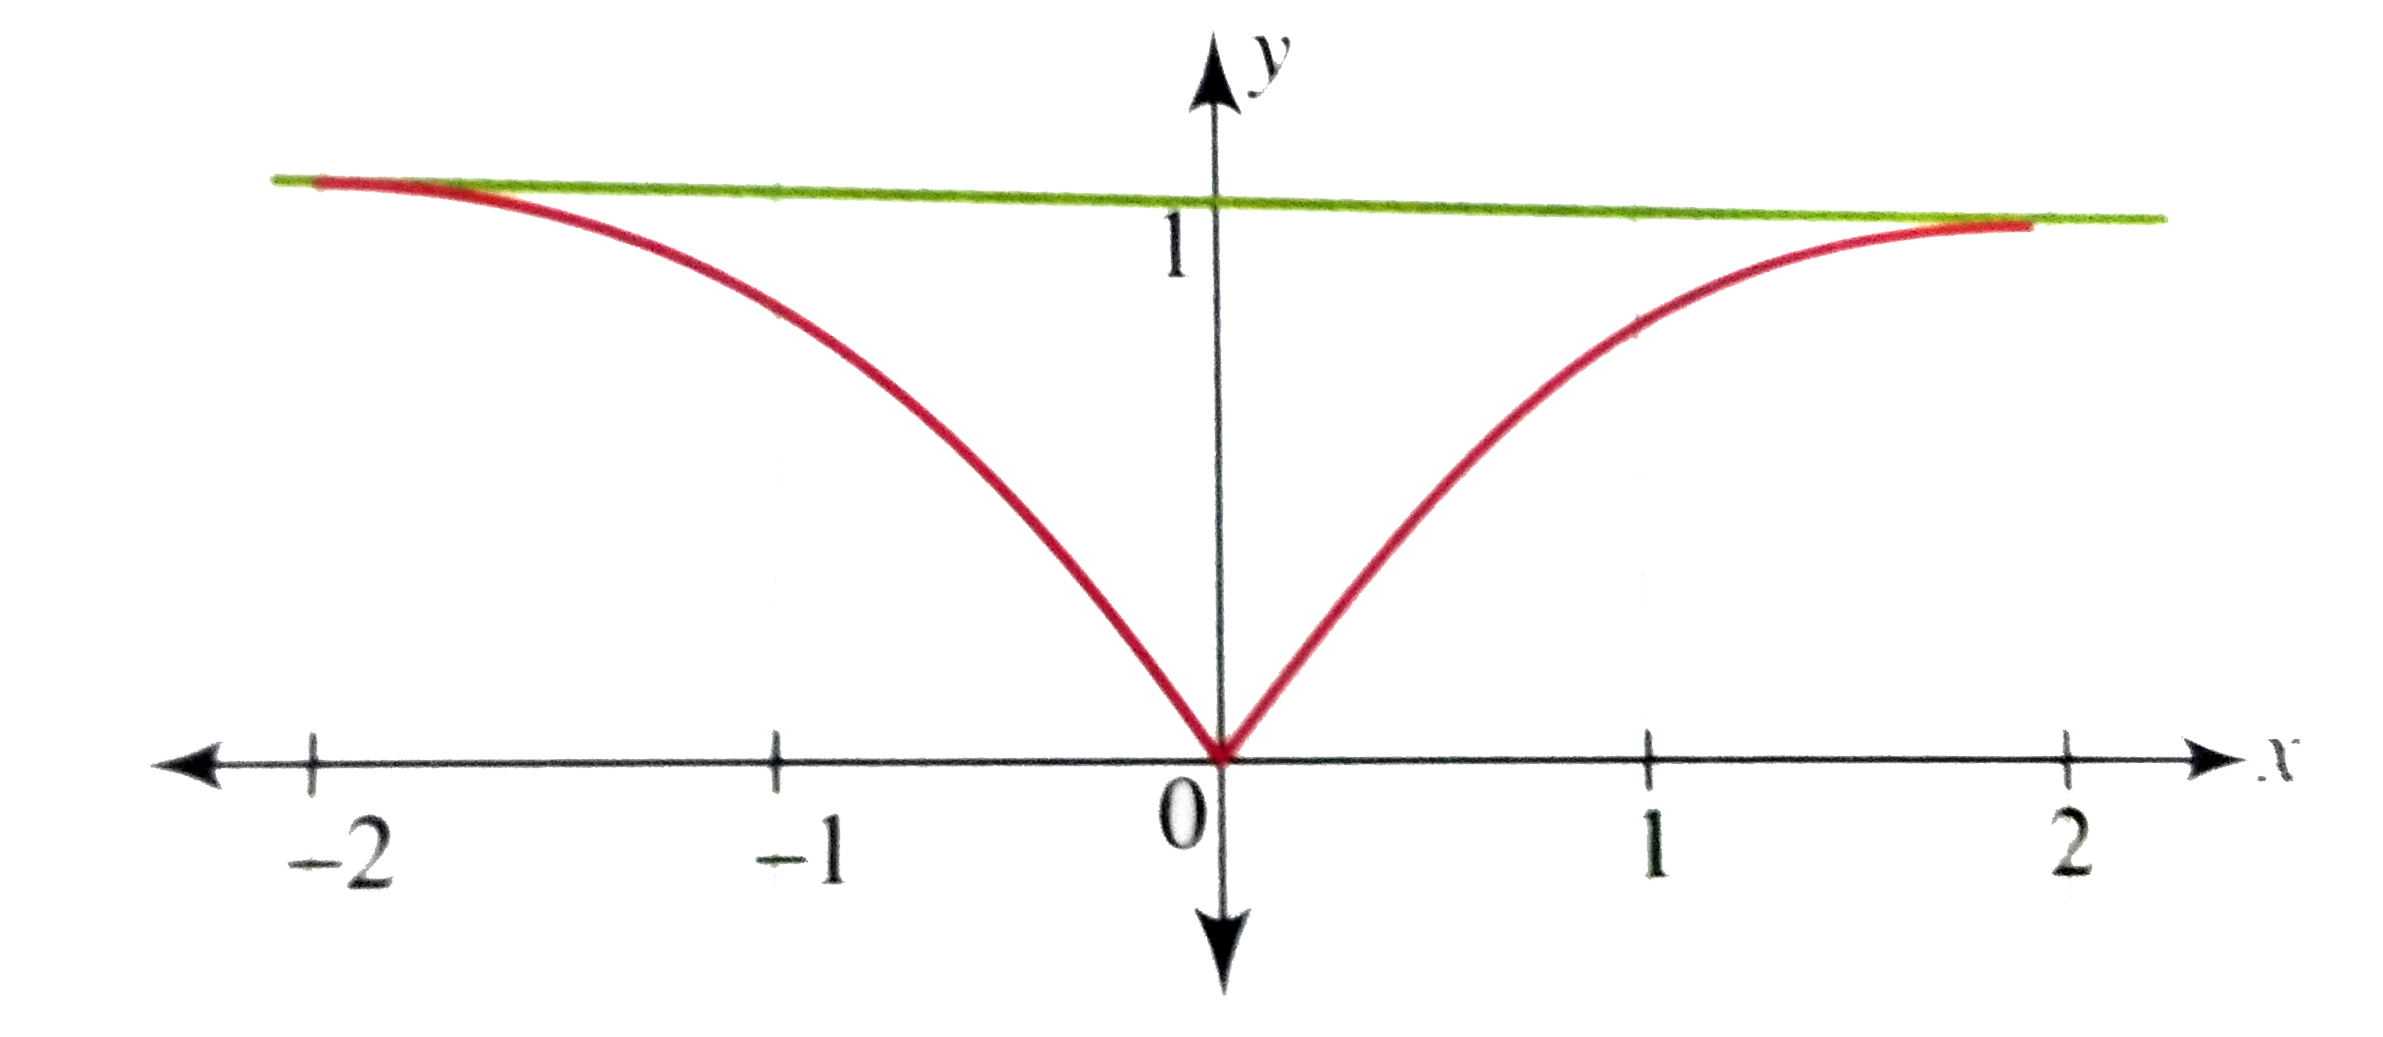
Draw the graph of f(x)=√1−e−x2
Video Solution
Text Solution
We have y=f(x)√1−e−x2
f(x) is defined if 1−e−x2≥0
or −x2≤0
x2≥0
Hence, the domain is R.
f′(x)=x.e−x2√1−e−x2
So, f(x) is increasing for x>0 and decreasing for x<0.
Also f′(0) does not exist, so f(x) is non-differentiable at x=0.
limx→±∞√1−e−x2=1
So y=1 is an asymptote.
Further √1−e−x2≥0,∀x∈R.
Thus, the graph of y=f(x) is as shown in the following figure.

|
Topper's Solved these Questions
Similar Questions
Draw the graph of f(x)=loge(√1−x2−x)
View SolutionDraw the graph of f(x)=loge(√1−x2).Find the range of the function .Also find the values of k if (x) has two distinct real roots.
View SolutionDraw the graph of f(x)=√sinx.
View SolutionDraw the graph of y=f(x)=√1−cosx
View SolutionDraw the graph of f(x)=x|x|.
View SolutionDraw the graph of f(x)=x3−xx2−1.
View SolutionDraw the graph of f(x)=esinx.
View SolutionDraw the graph of f(x)=x2−3
View SolutionDraw the graph of y=√xx−1
View SolutionDraw the graph of f(x)=sec−1(secx)
View Solution
