The graph shows the effect of liver and kidneys in dogs on the amount of urea in the blood. On the graph, two marks O and X shows the time when these two organs were removed . Which mark shows the removal of which organ ?
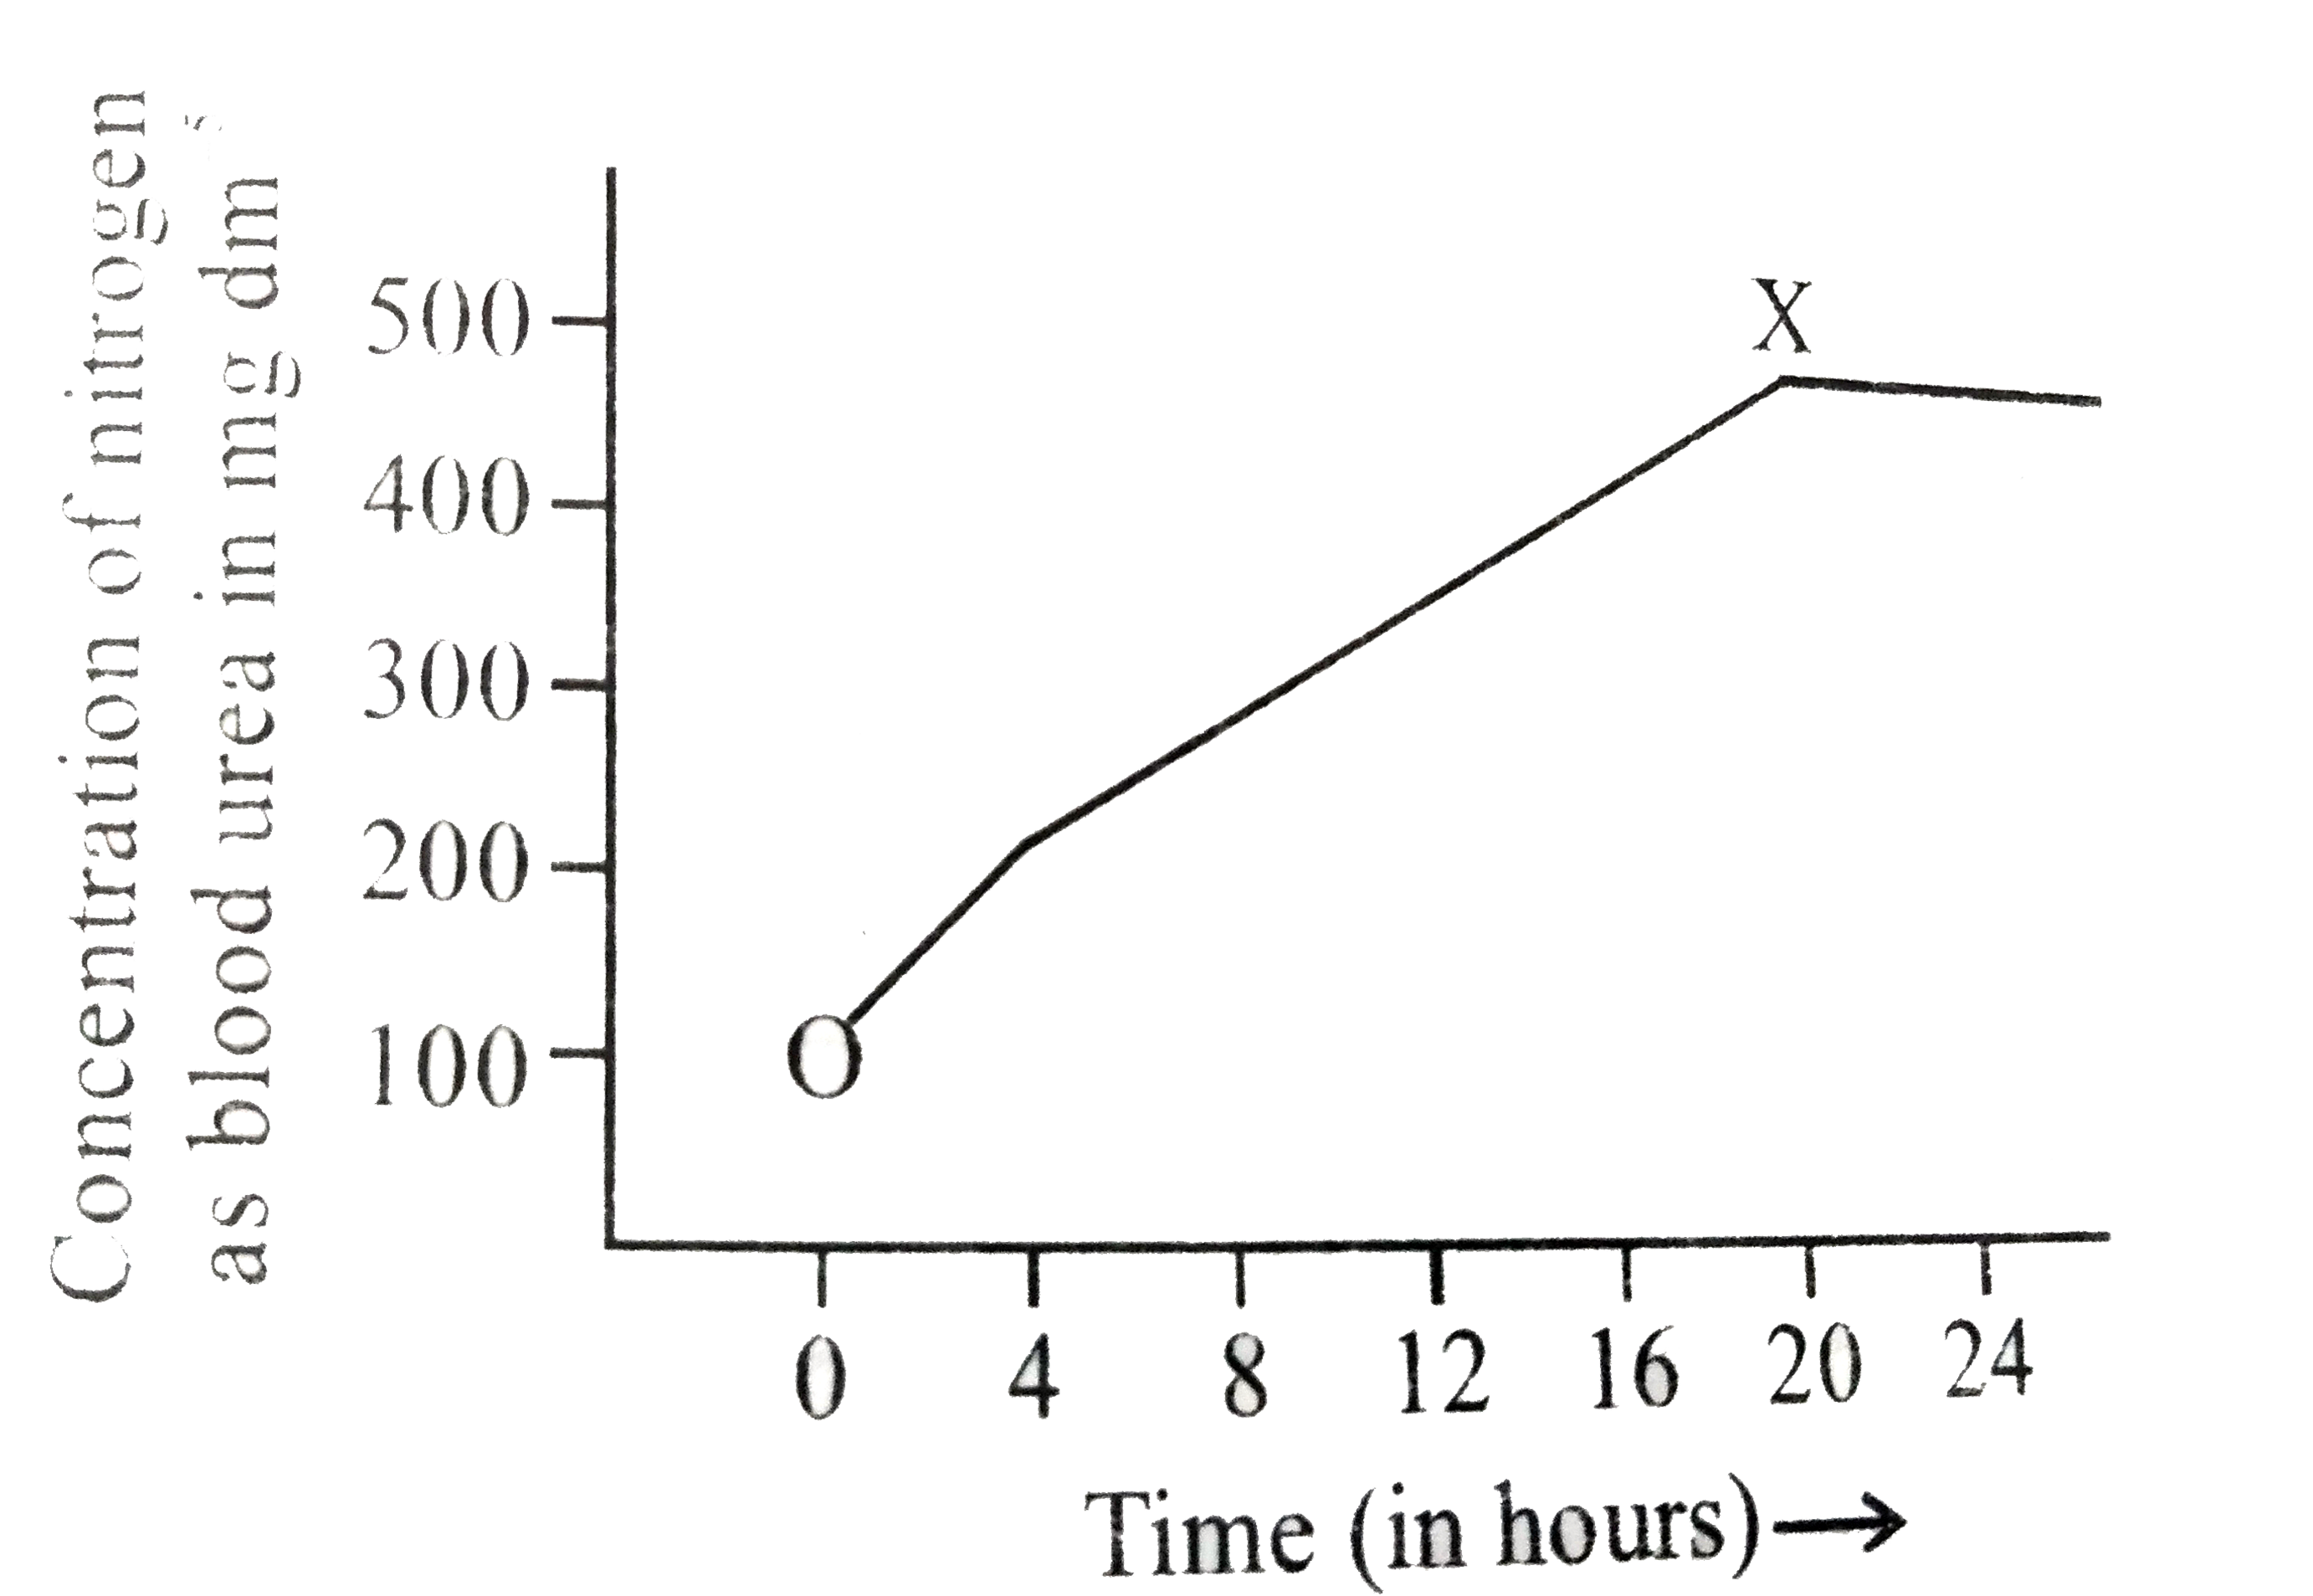
O' stands for removal of liver and 'X' for the removal of kidney
O' stands for the removal of kidney and 'X' for the removal of liver.
The given data is incomplete.
Any of the mark can be taken as the time of removal of kidney or the liver
The correct Answer is:1
Similar Questions
Knowledge Check
- Question 1 - Select One
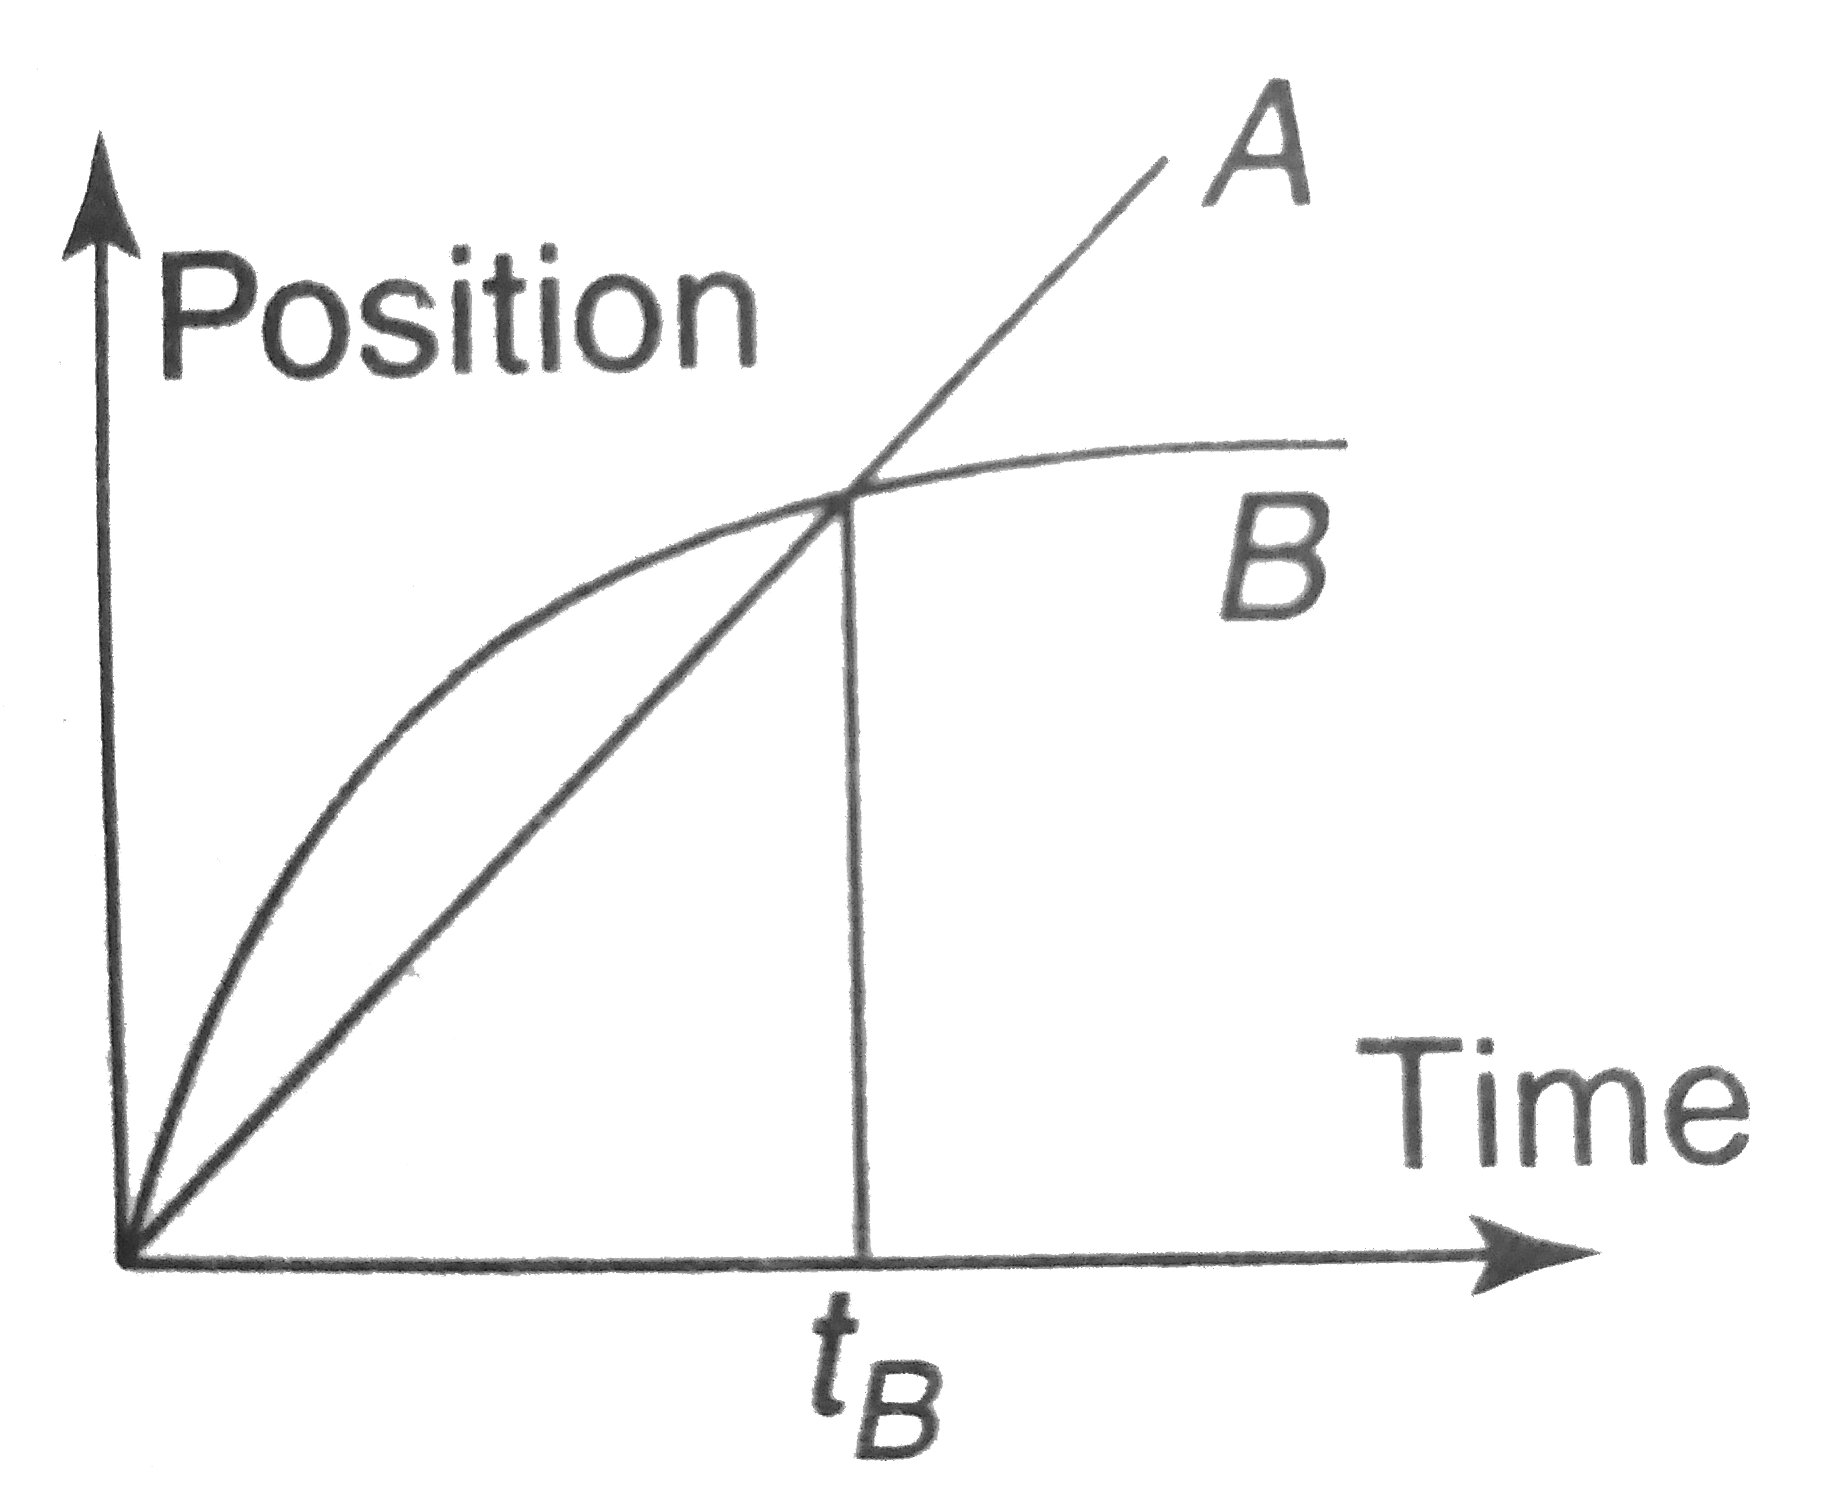
Figure shows position-time graph of two cars A and B.
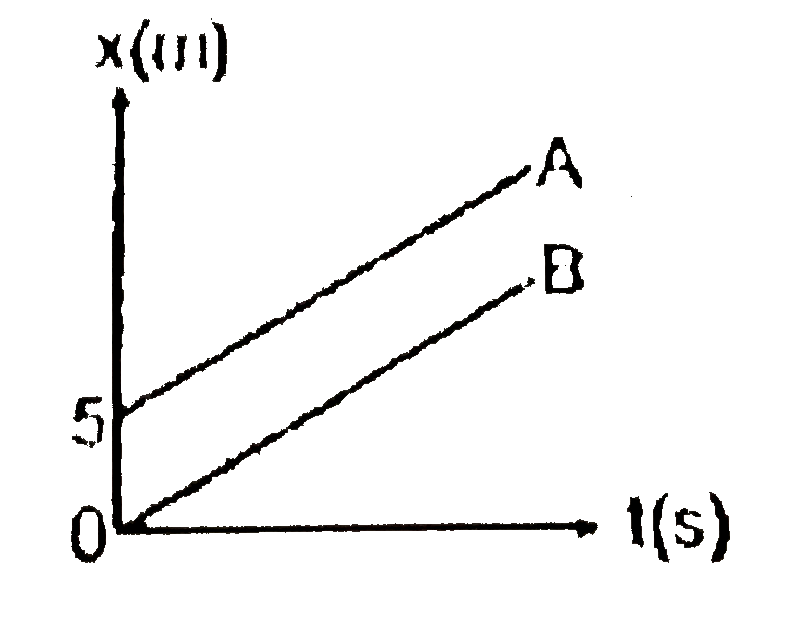 ACar A is faster than car B.BCar B is faster than car A.CBoth cars are moving with same velocity.DBoth cars have positive acceleration.
 - Question 2 - Select One
The graphs show the concentration of glucose and insulin in the blood of healthy person. Which graph show she changes expected after a meal containing starch?
A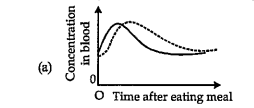 B
B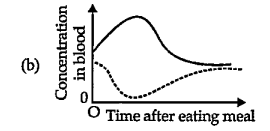 C
C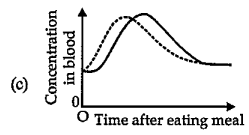 D
D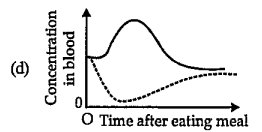
- Question 3 - Select One
Which one of the graphs show the effect of temperature on the velocity of a typical enzymatic reaction?
A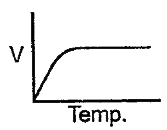 B
B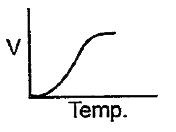 C
C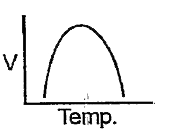 D
D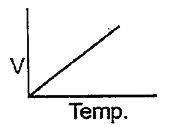
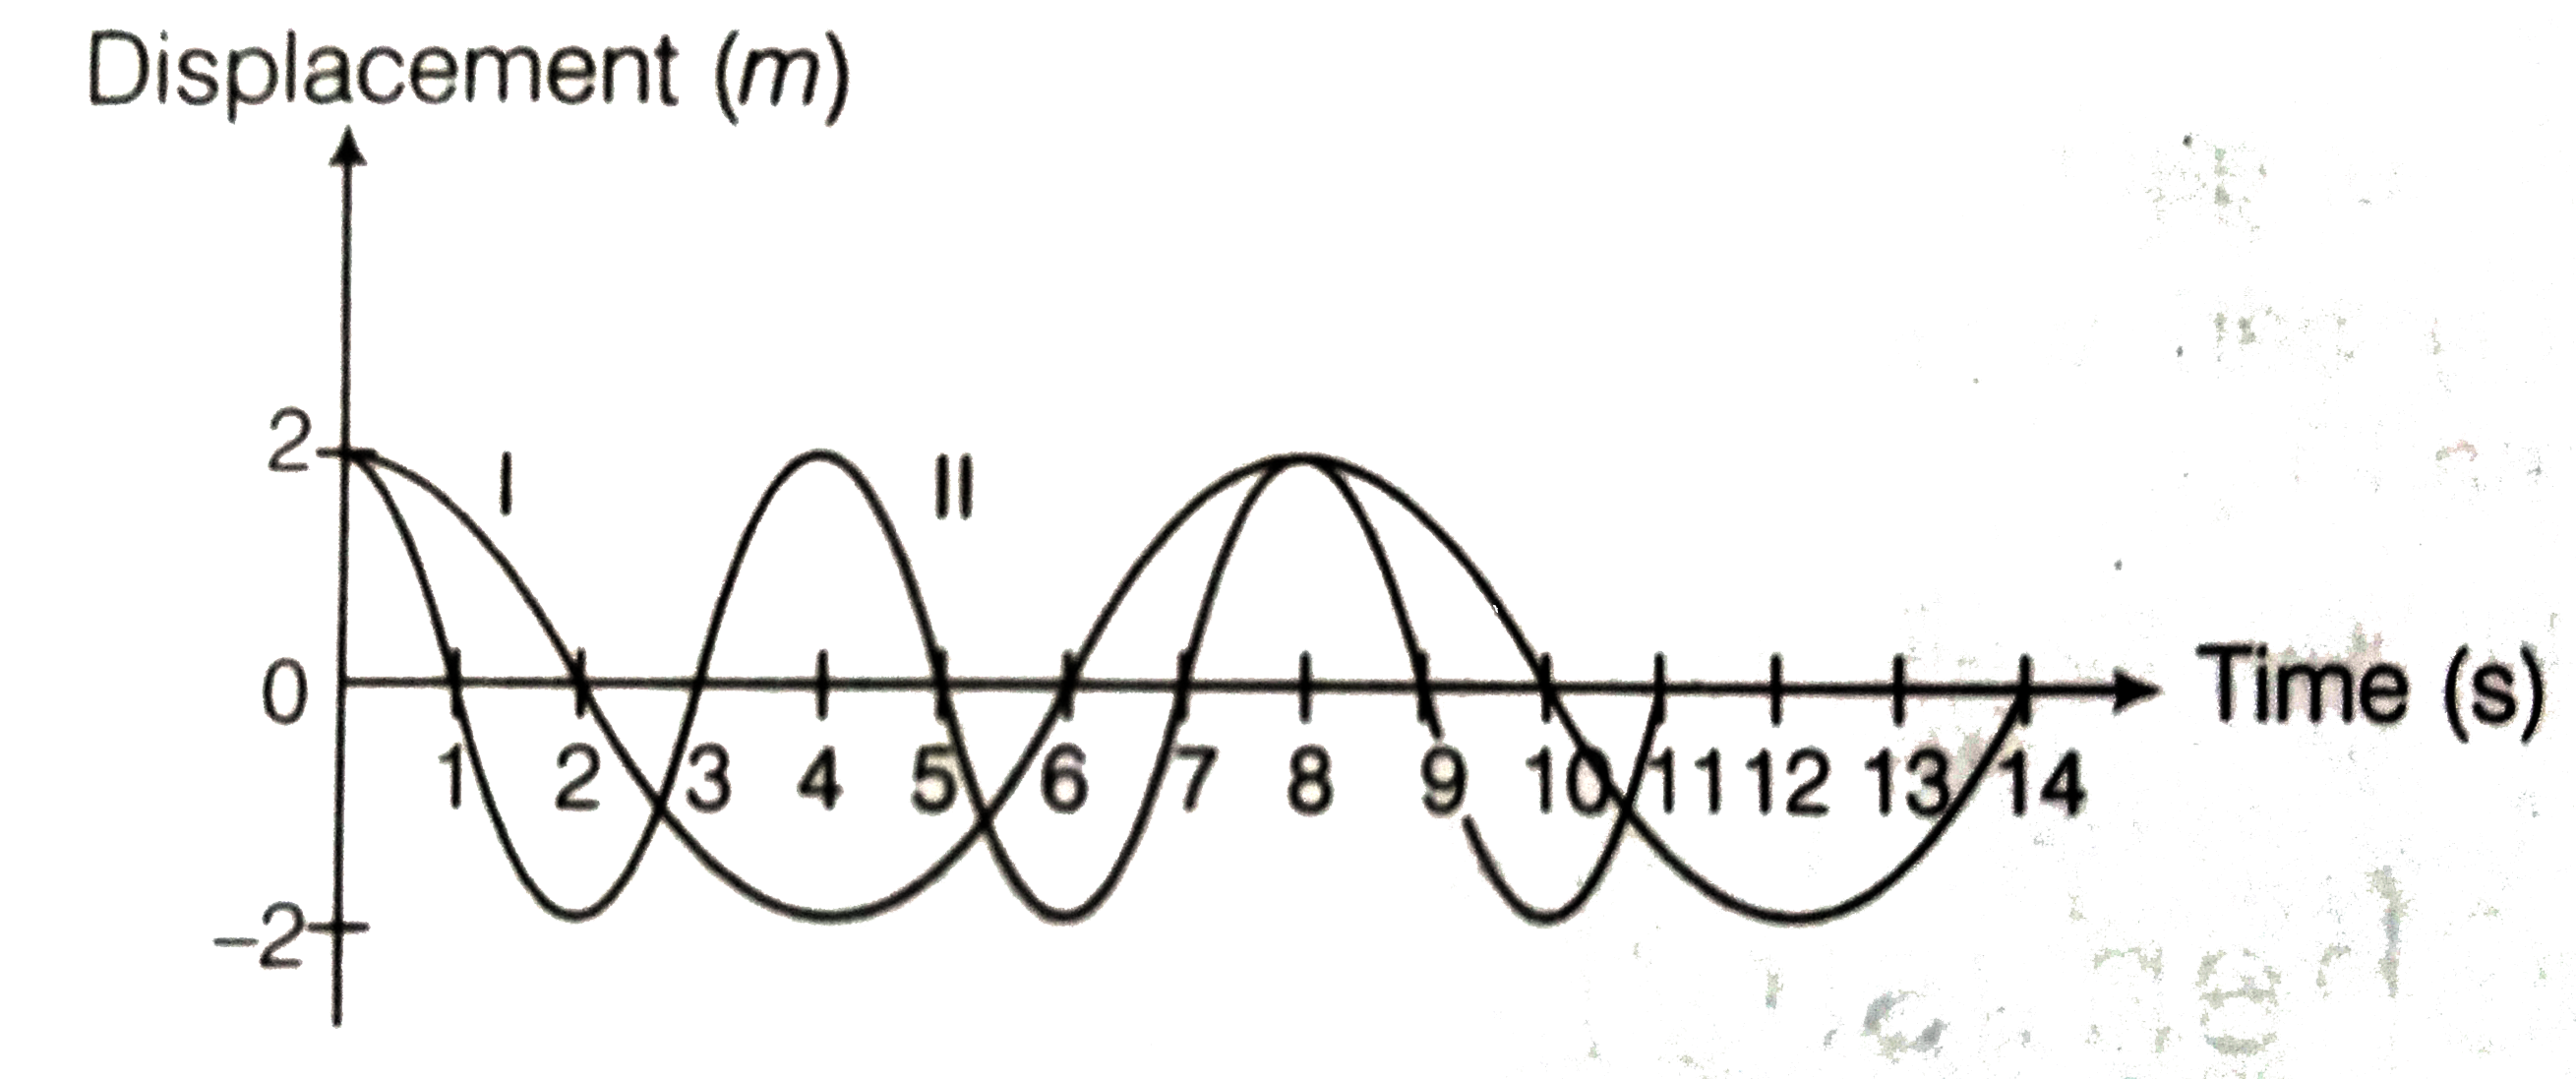
Figure shows the displacement time graphs of two simple harmonic motions I and II. From the graph it follows that
 View Solution
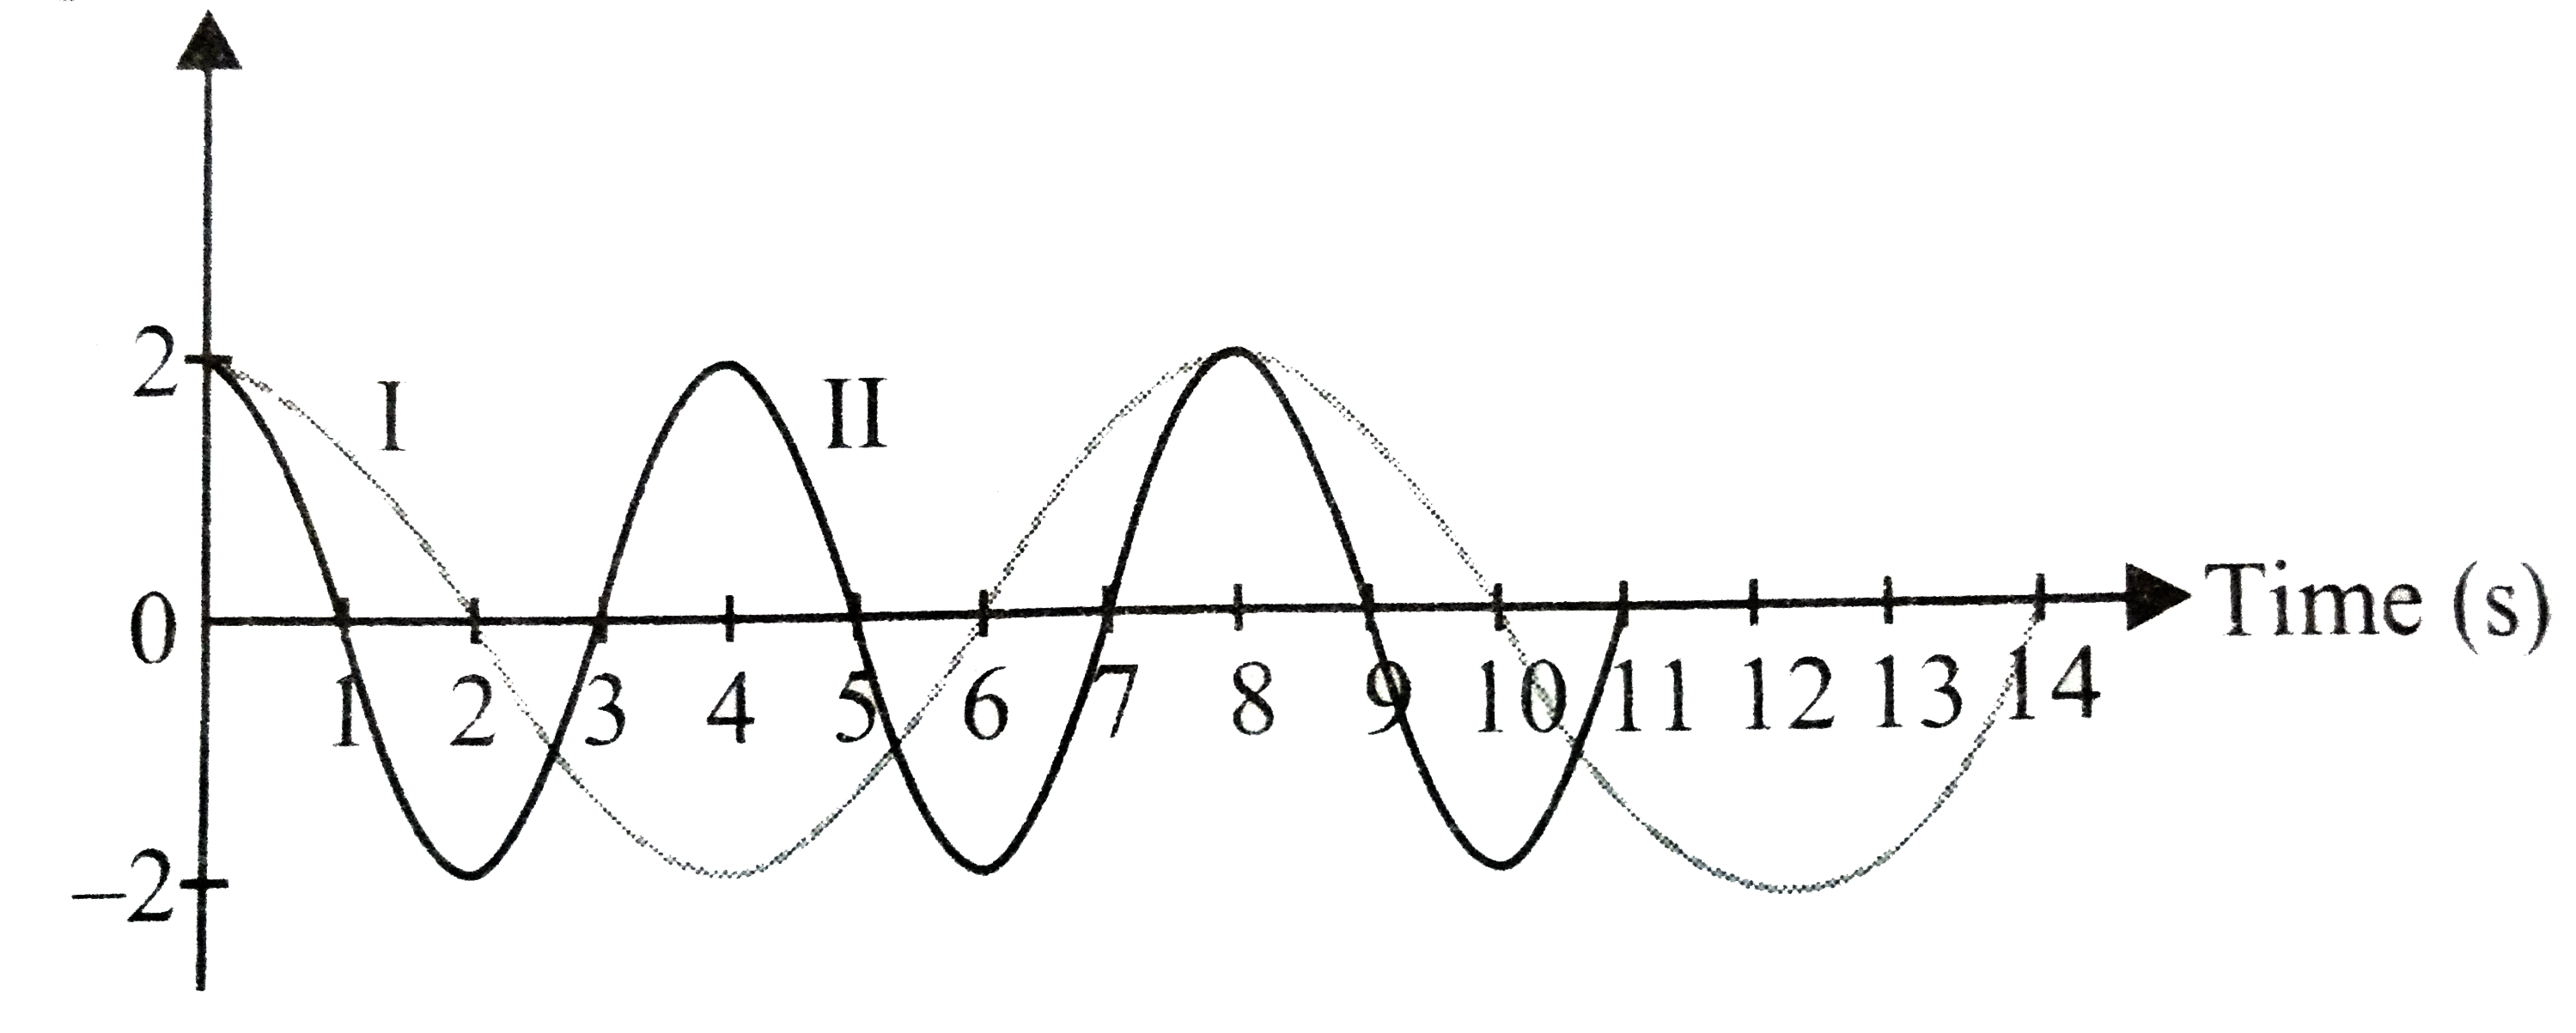
Figure shows the displacement-time graphs of two simple harmonic motions I and II. From the graph it follows that
 View Solution
The graph between the current and the time for an inductance coil is shown below. Which of the following graph show the voltage-time variation-
 View Solution
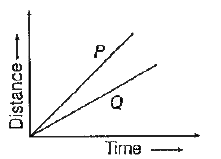
Figure shows that disatnce - time graph for the motion of two vehicles P and Q . Which one of them of moving faster ?
 View Solution
The graph shows position as a function of time for two trains running on parallel tracks. Which statement is true ?
 View Solution
