y-t graph of a projectile parabola is drawn in figure 1 and it's path is drawn in figure 2. (Y vertical up,x horizontal).

y1=y2
t1=2t2
x1=2x2
x1x2=t1t1
The correct Answer is:A, C, D
y1=y2
t1≠2t2,t2=2t1 max height
x1=ucosθT2,x2=ucosθT
x1x2=12,t1t2=12 ]
Topper's Solved these Questions
- TEST PAPERSBOOK - BANSALCHAPTER - TEST PAPERSEXERCISE - CHEMISTRY
133 Videos
- TEST PAPERSBOOK - BANSALCHAPTER - TEST PAPERSEXERCISE - MATHEMATICS
58 Videos
- TEST PAPERSBOOK - BANSALCHAPTER - TEST PAPERSEXERCISE - MATHS SECTION - 2 [MULTIPLE CORRECT CHOICE TYPE]
6 Videos
- PROBABILITYBOOK - BANSALCHAPTER - PROBABILITYEXERCISE - All Questions
1 Videos
- THERMODYNAMICSBOOK - BANSALCHAPTER - THERMODYNAMICSEXERCISE - Match the column
7 Videos
Similar Questions
Knowledge Check
A projectile is thrown horizontally forma height 'h' a shown in the figure.
vx: horizontal component of velocity
vy: vertical component of velocity
x: horizontal position
y: vertical position
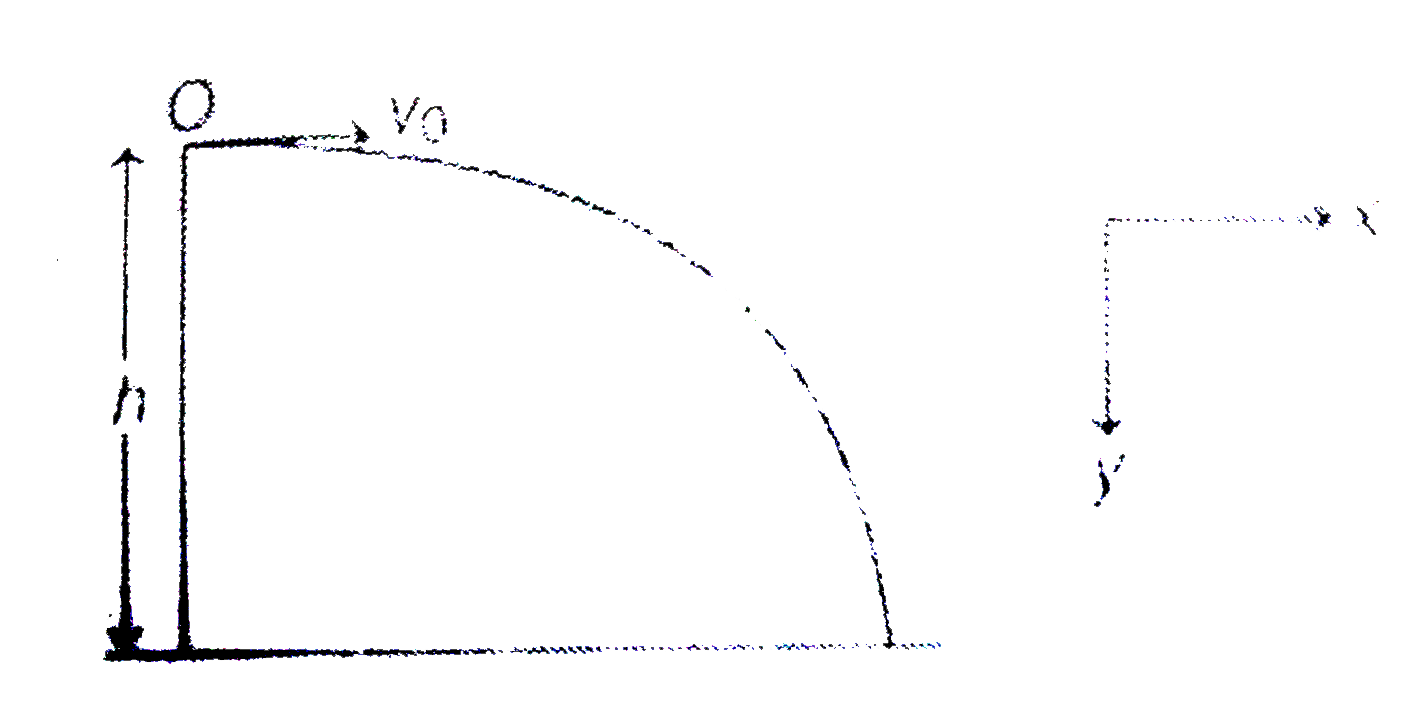
Which of the following graph is/are correct?A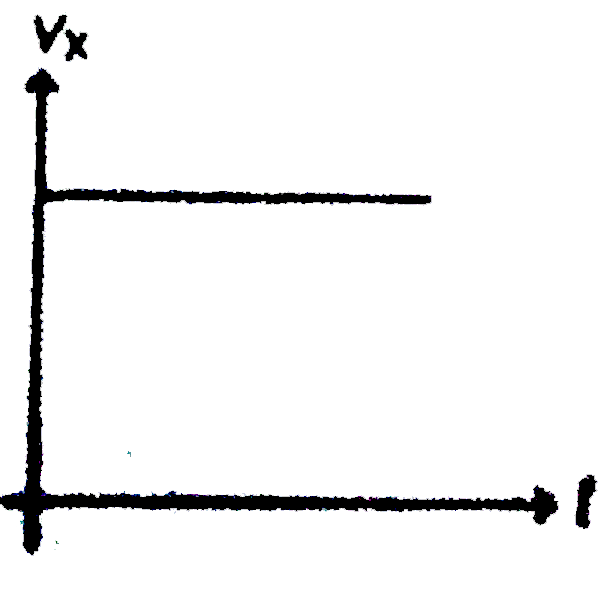 B
B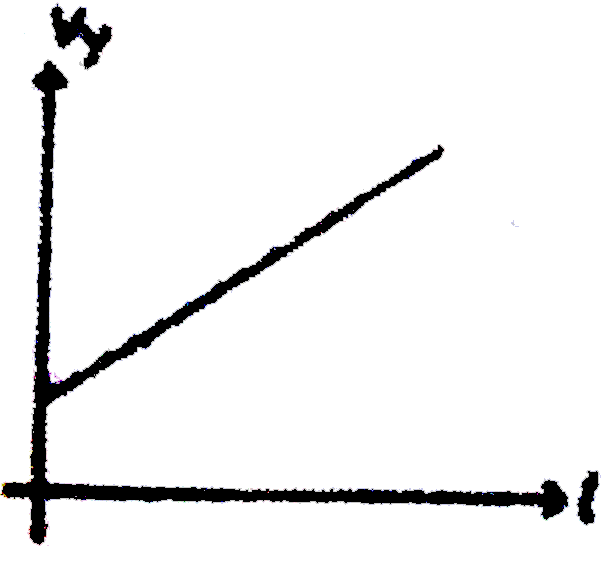 C
C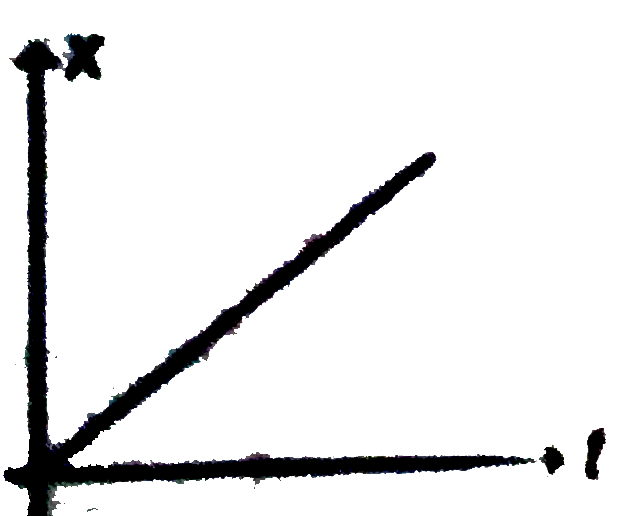 D
D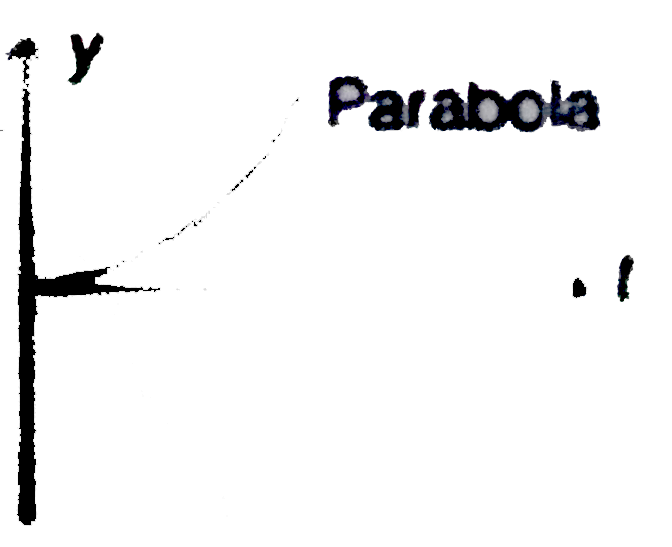
In the adjacent figure a parabola is drawn to pass through the vertices B,C and D of the square ABCD. If A(2,1),C(2,3), then focus of this parabola is
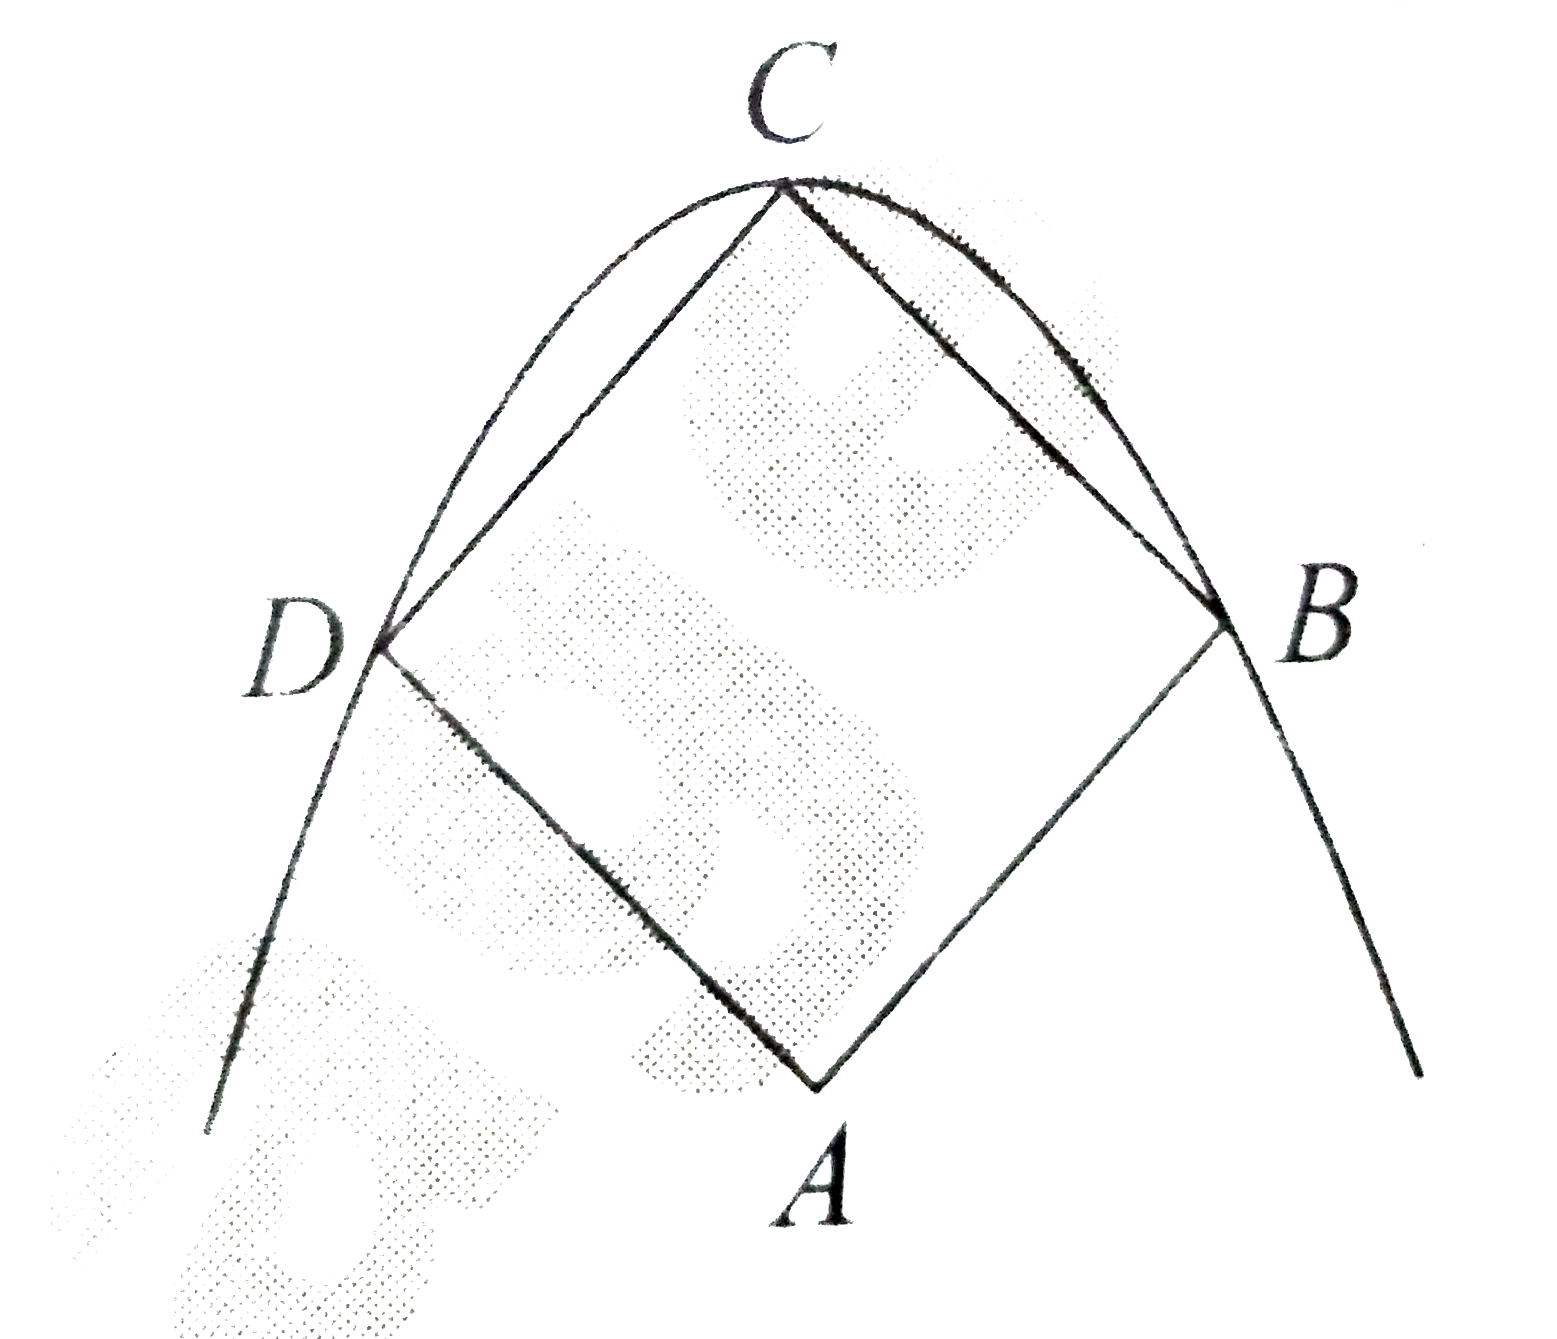 A(1,114)B(2,114)C(3,134)D(2,134)
The horizontal and vertical displacements x and y of a projectile at a given time t are given by x=6tandy=8t−5t2 meter.The range of the projectile in metre is:
A9.6B10.6C19.2D38.4
In a bar graph, ________ can be drawn horizontally or vertically.
View SolutionIn the adjacent figure a parabola is drawn to pass through the vertices B,C and D of the square ABCD. If A(2,1),C(2,3), then focus of this parabola is

View SolutionThe horizontal and vertical displacements x and y of a projectile at a given time t are given by x=6tandy=8t−5t2 meter.The range of the projectile in metre is:
View SolutionA normal is drawn to parabola y2=4x at (1,2) and tangent is drawn to y=ex at (c,ec). If tangent and normal intersect at x−aξs then find C.
View SolutionIn a projectile motion let vx and vy are the horizontal and vertical components of velocity at any time t and x and y are displacements along horizontal and vertical from the point of projection at any time t.Then
View Solution
