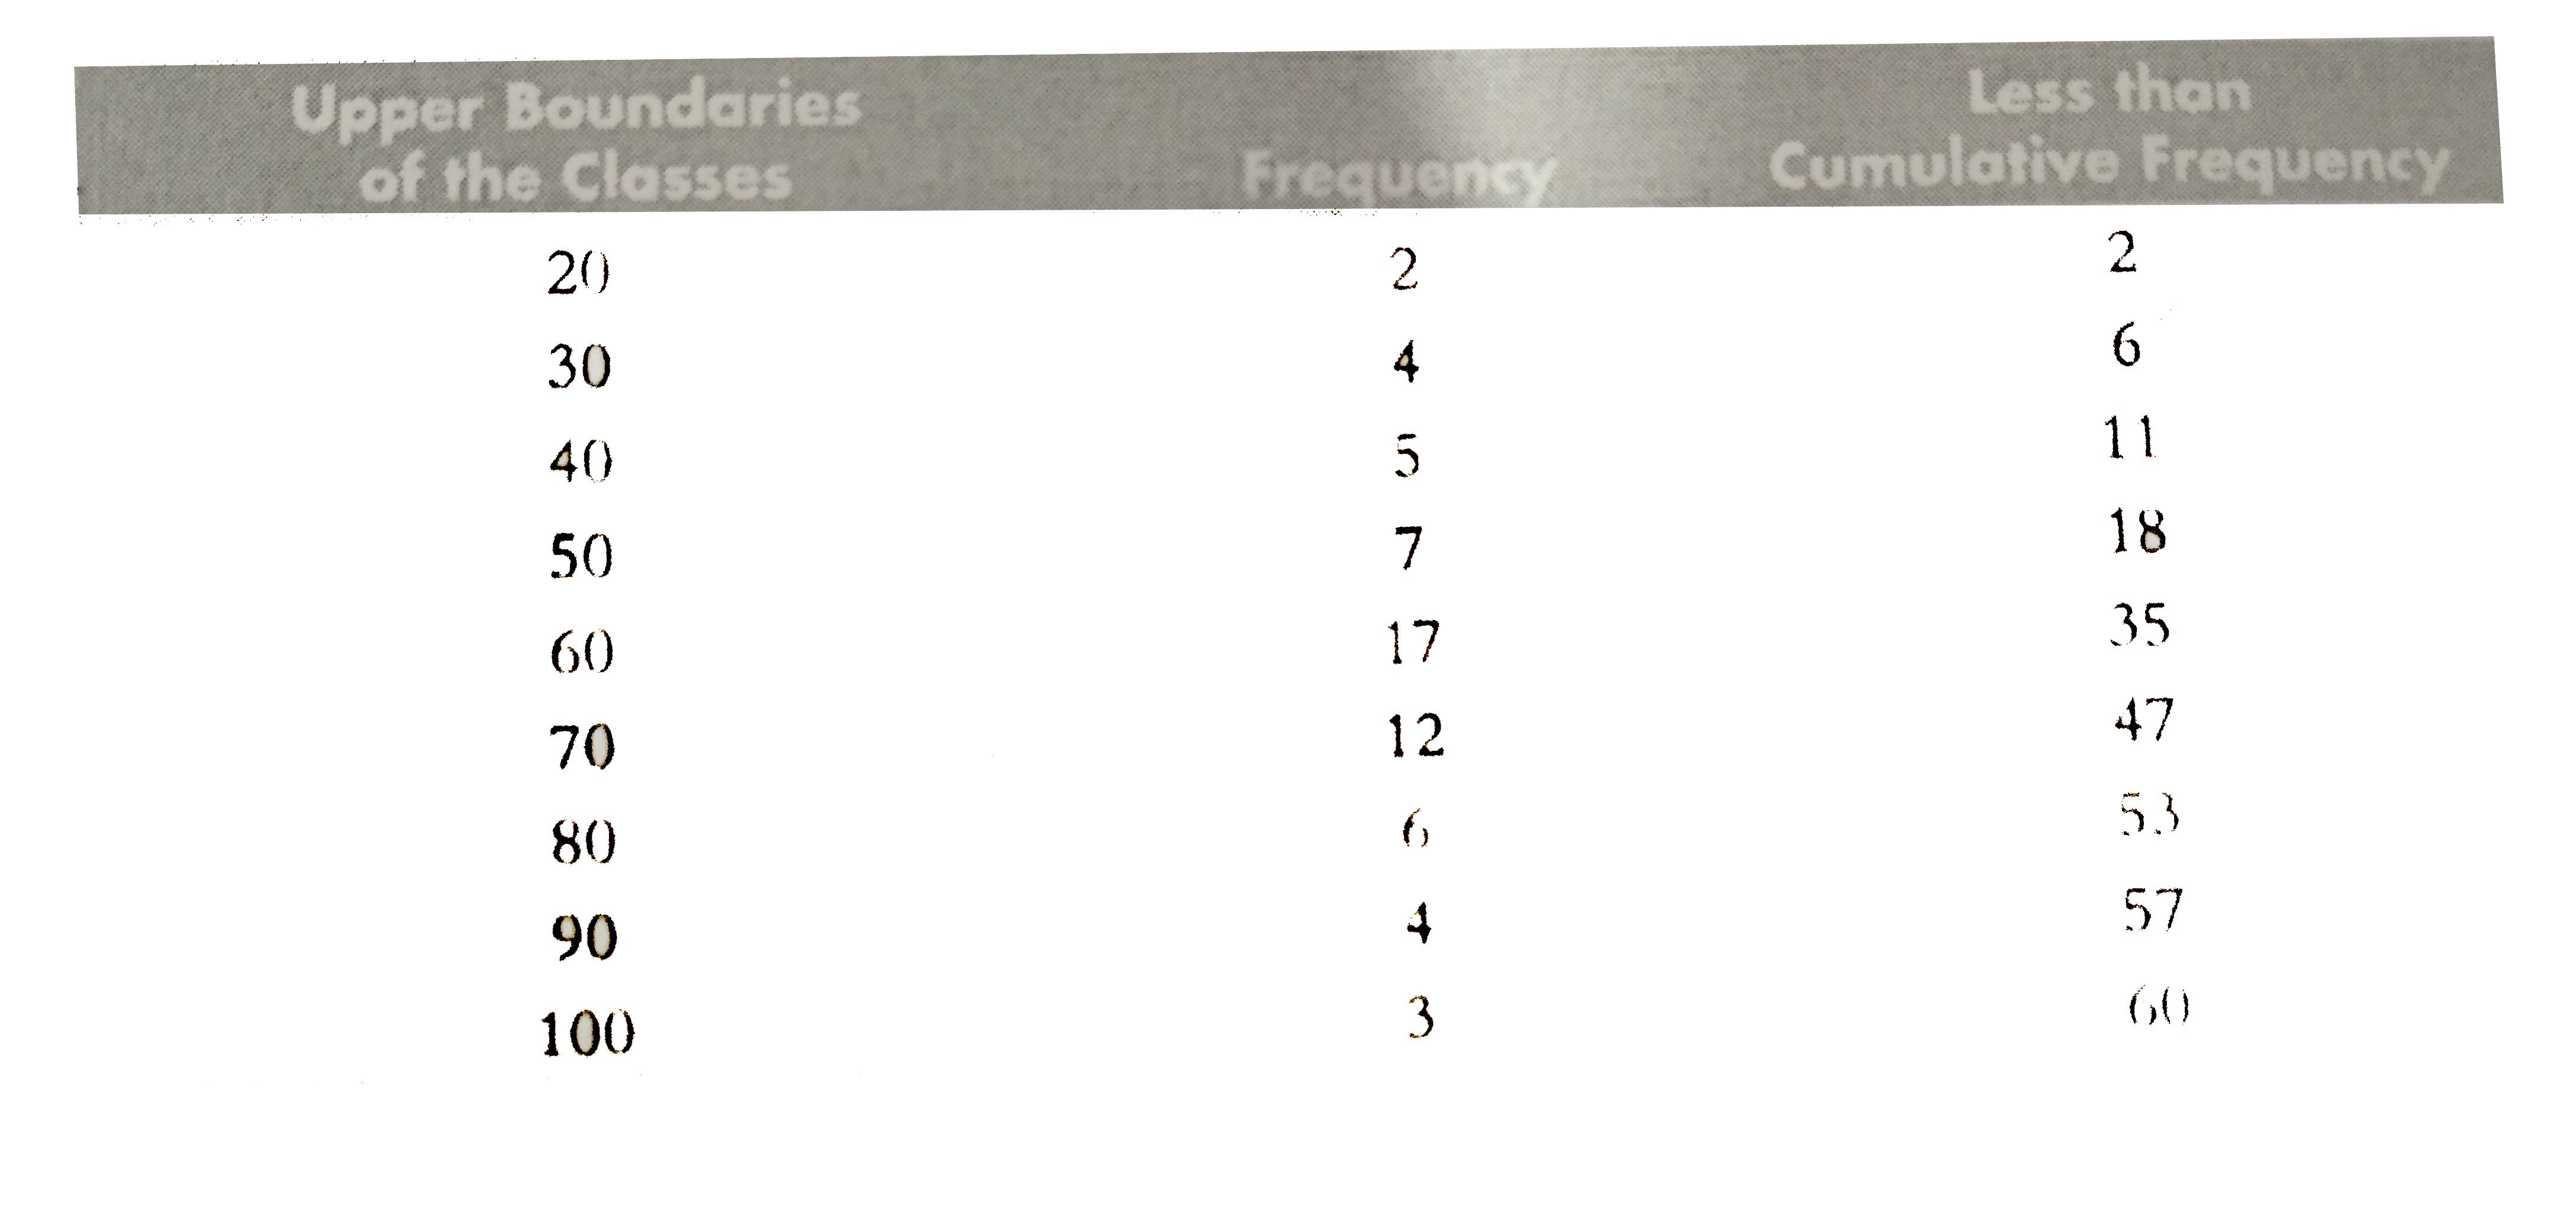
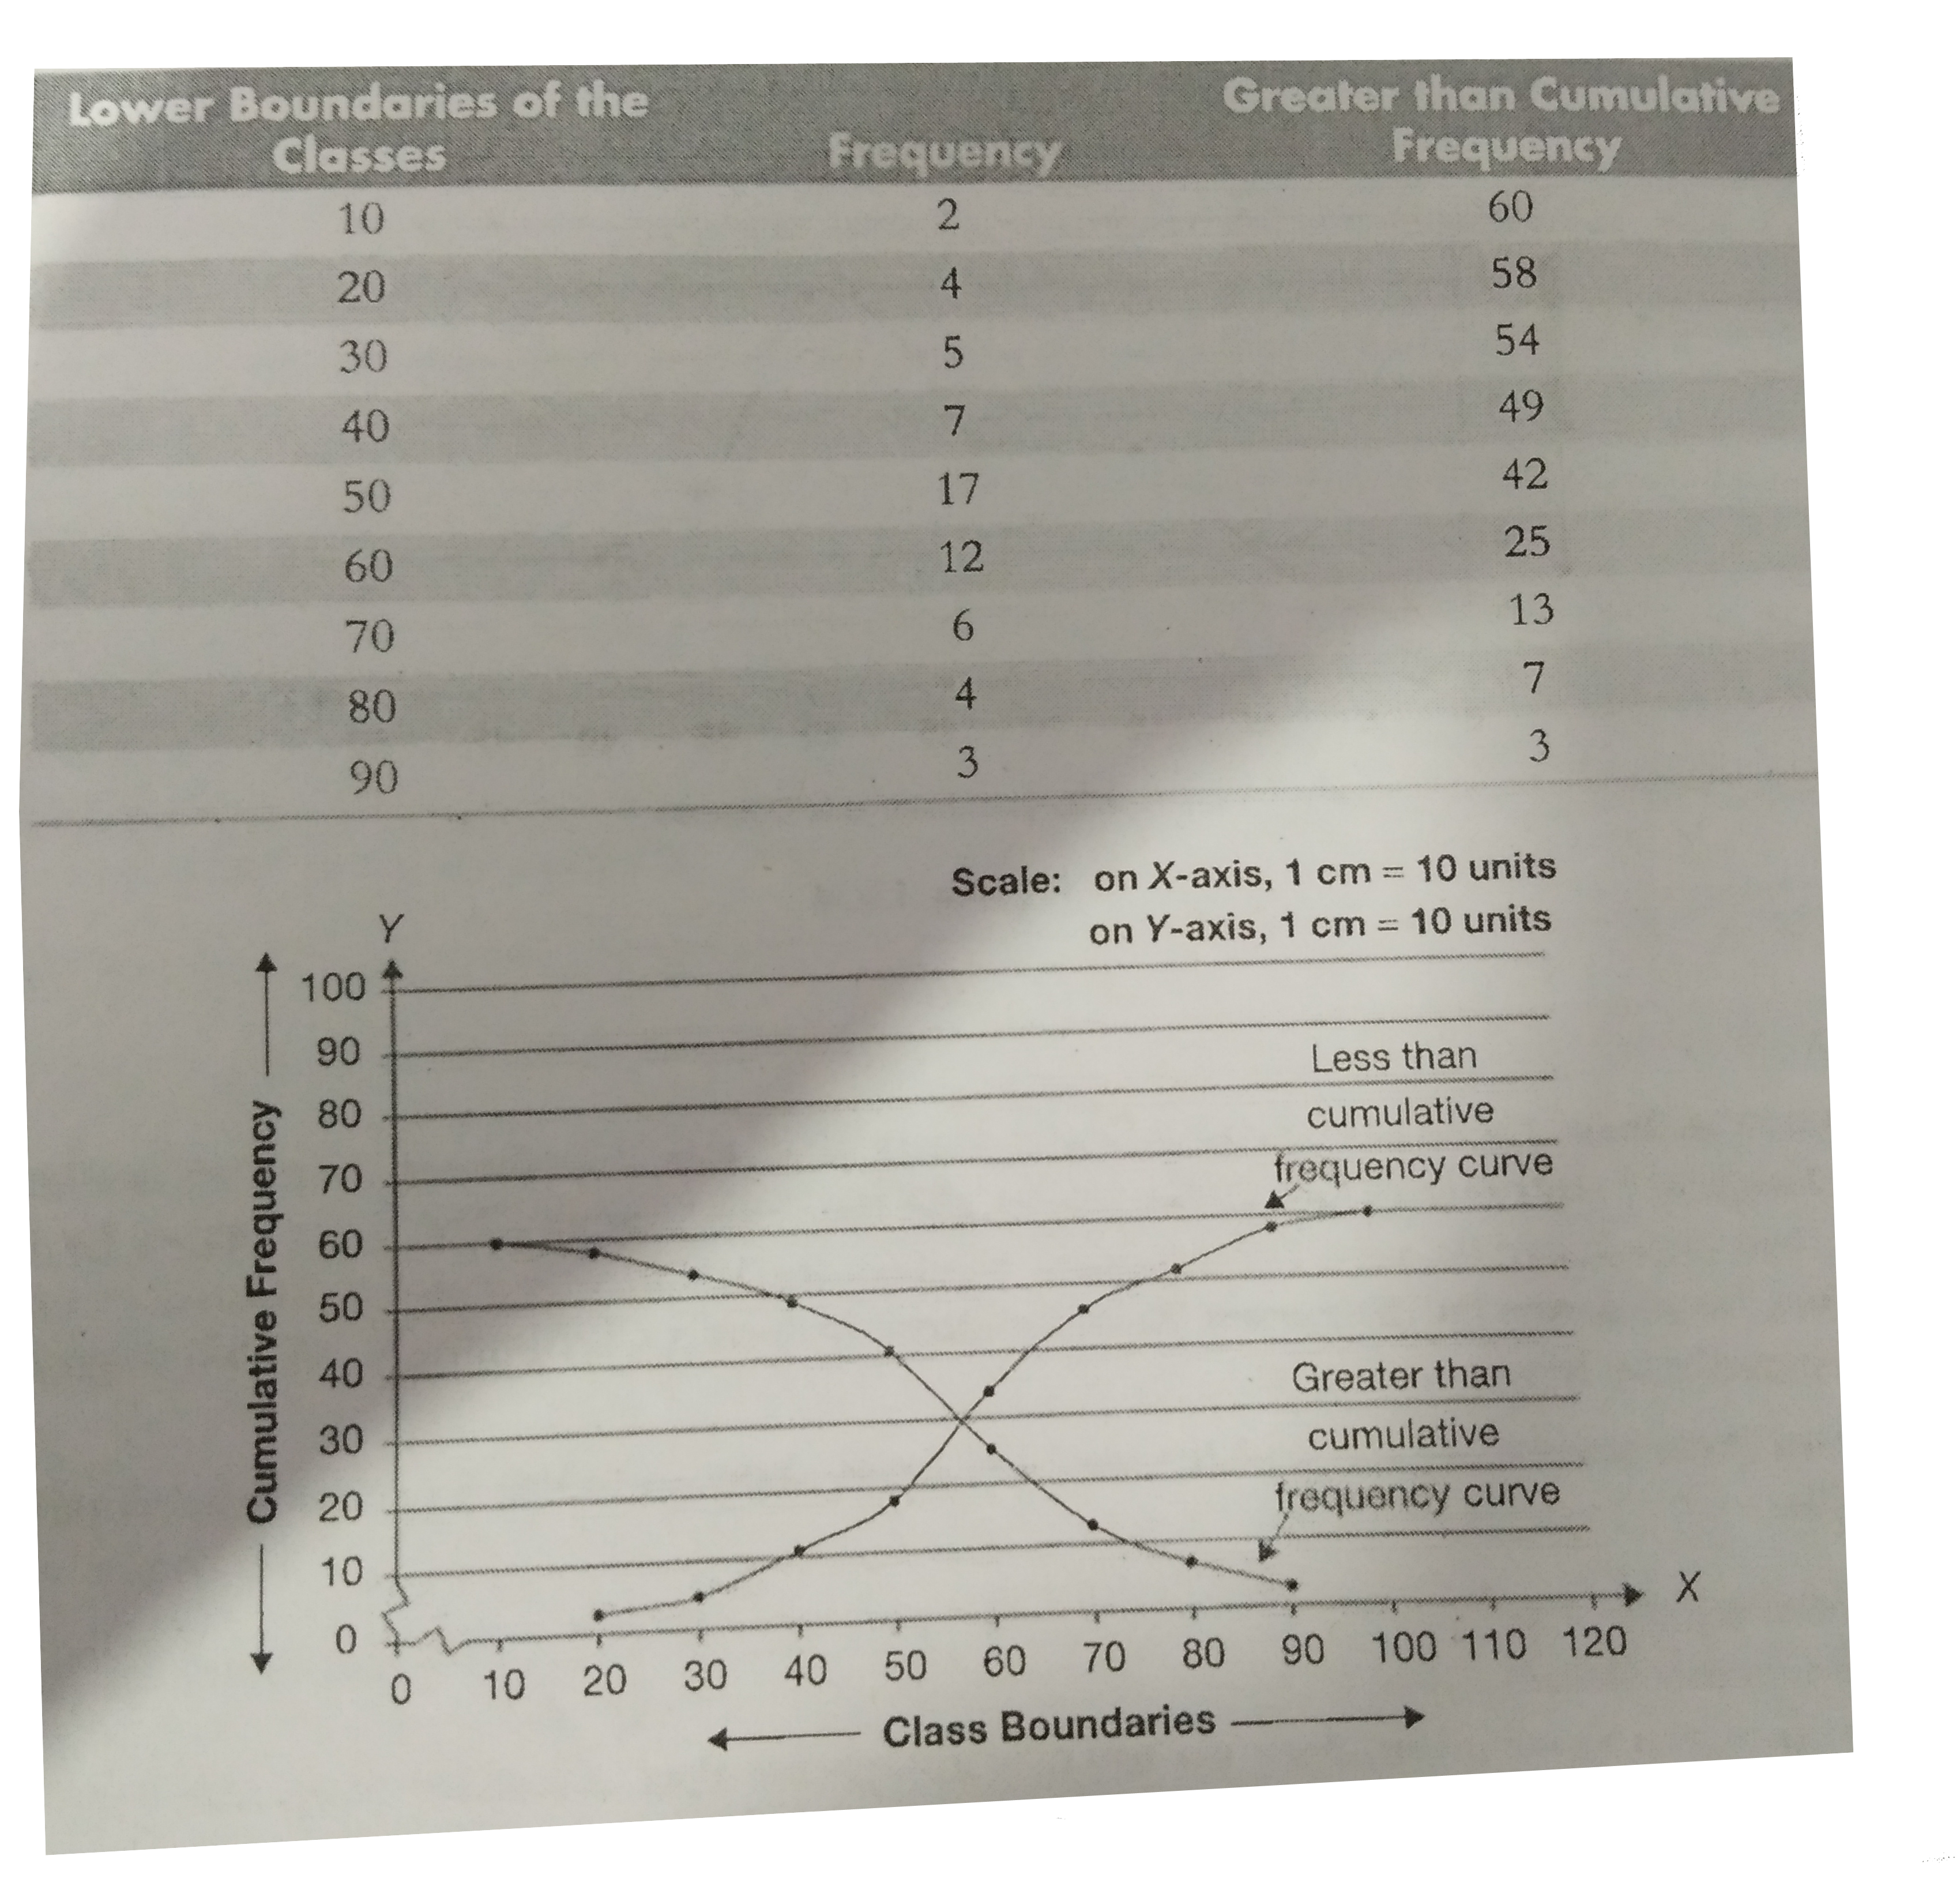
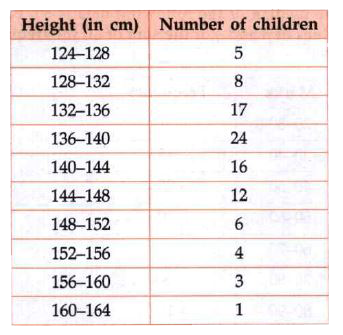
For the given distribution , draw the less than and greater than cumulative frequency curves .

Less than cumulative frequency distribution :
Greater than cumulative frequency distribution .
Topper's Solved these Questions
- STATISTICS BOOK - PEARSON IIT JEE FOUNDATIONCHAPTER - STATISTICS EXERCISE - Very short answer type questions
30 Videos
- STATISTICS BOOK - PEARSON IIT JEE FOUNDATIONCHAPTER - STATISTICS EXERCISE - Short Answer Type Questions
13 Videos
- SHARES AND DIVIDENDSBOOK - PEARSON IIT JEE FOUNDATIONCHAPTER - SHARES AND DIVIDENDSEXERCISE - Level 3
15 Videos
- TAXATION BOOK - PEARSON IIT JEE FOUNDATIONCHAPTER - TAXATION EXERCISE - LEVEL 3
10 Videos
Similar Questions
The abscissa of the point of intersection of the Less Than Type and of the More Than Type cumulative frequency curves of a grouped data gives its
View SolutionThe abscissa of the point of intersection of the less that type of the more than type cumulative frequency curves of a grouped data gives its
View Solution
Knowledge Check
The abscissa of the point of intersection of the less that type of the more than type cumulative frequency curves of a grouped data gives its
AmeanBmedianCmodeDAll of these
In Case Of Less Than Cumulative Frequency Series
View SolutionExplain the exclusive method by less than and more than cumulative frequencies.
View SolutionFor the following frequency distribution, draw a cumulative frequency curve of more than type and hence obtain the median value:

View SolutionThe marks obtained by 100 students of class is an examination are given below:
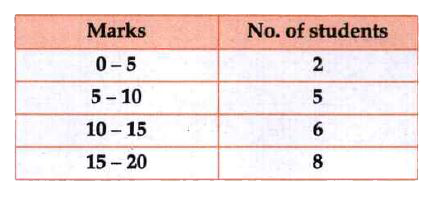
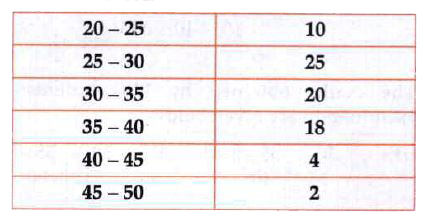
Draw 'a less than' type cumulative frequency curves (ogive). Hence, find median.
View SolutionWhat is cumulative frequency of marks less than 15
View SolutionThe distribution of heights (in cm) of 96 children is given below:
Draw a less than type cumulative frequency curve for this data and use it to compute median height of the children.
View SolutionThe following distribution gives the daily income of 60 workers of a factory. Convert the distribution above to a less than type cumulative frequency distribution, and draw its ogive.
View Solution
