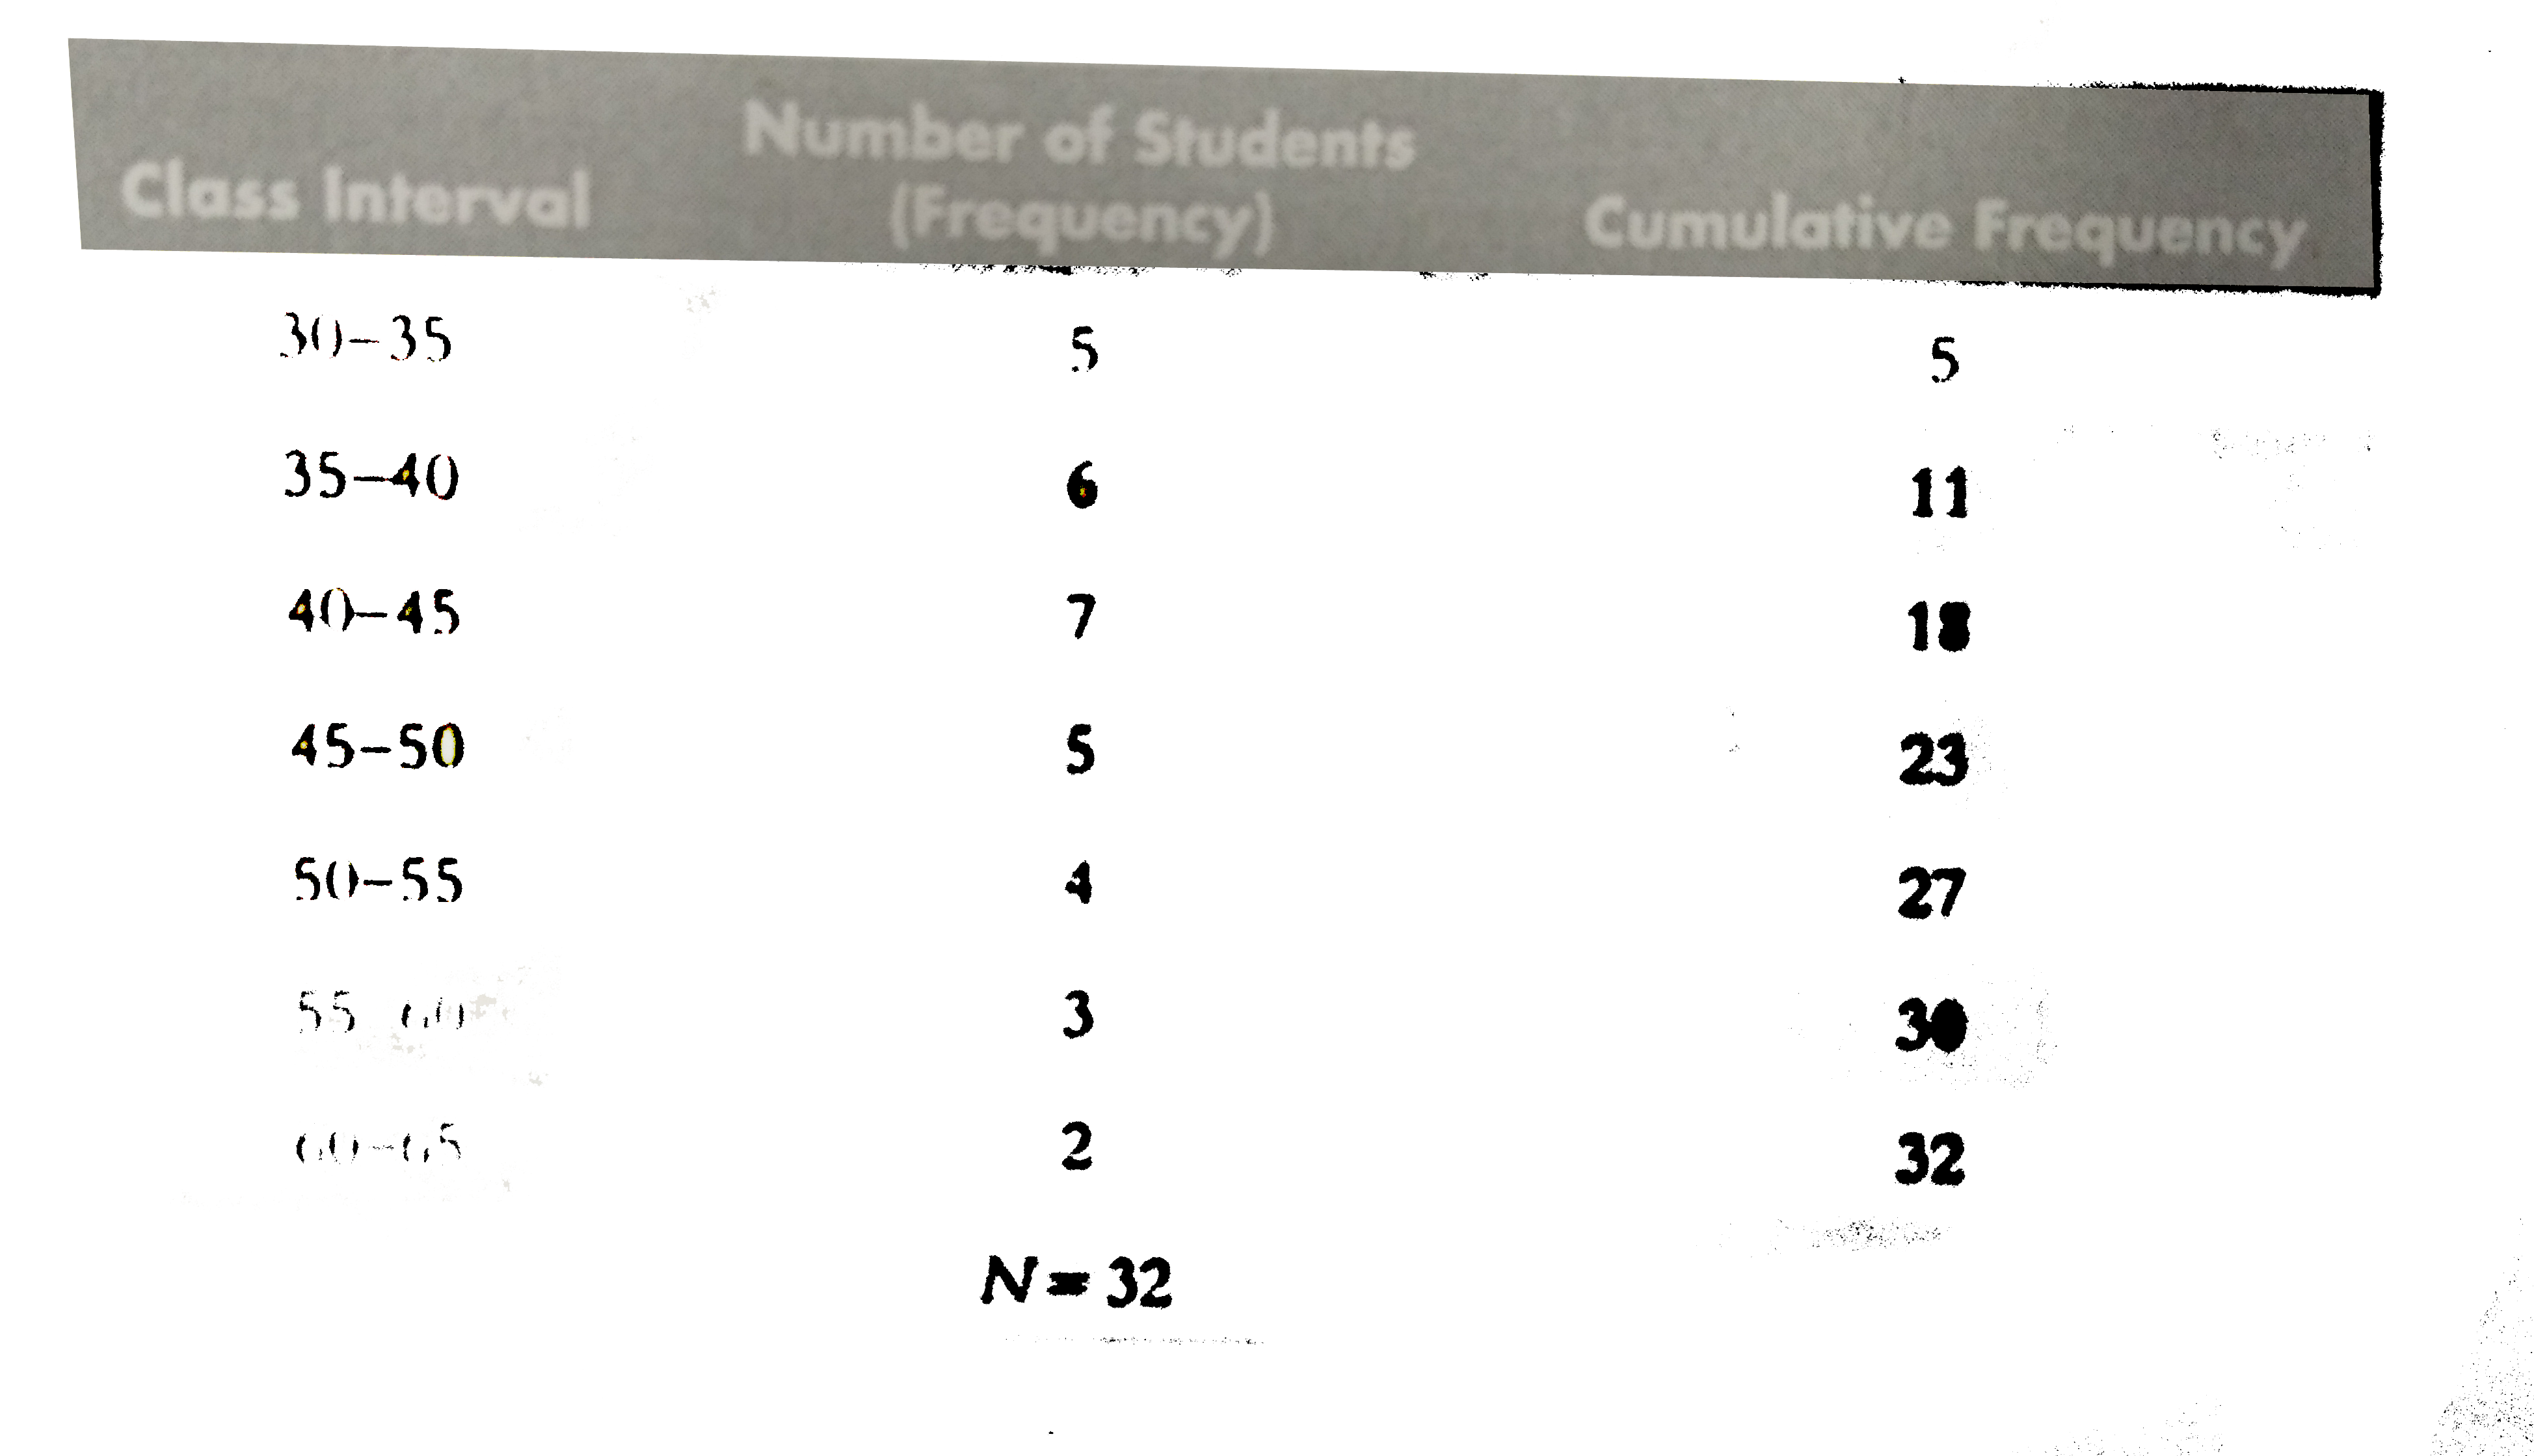
The following table shows the distribution of the weight of a group of students :


N = 32
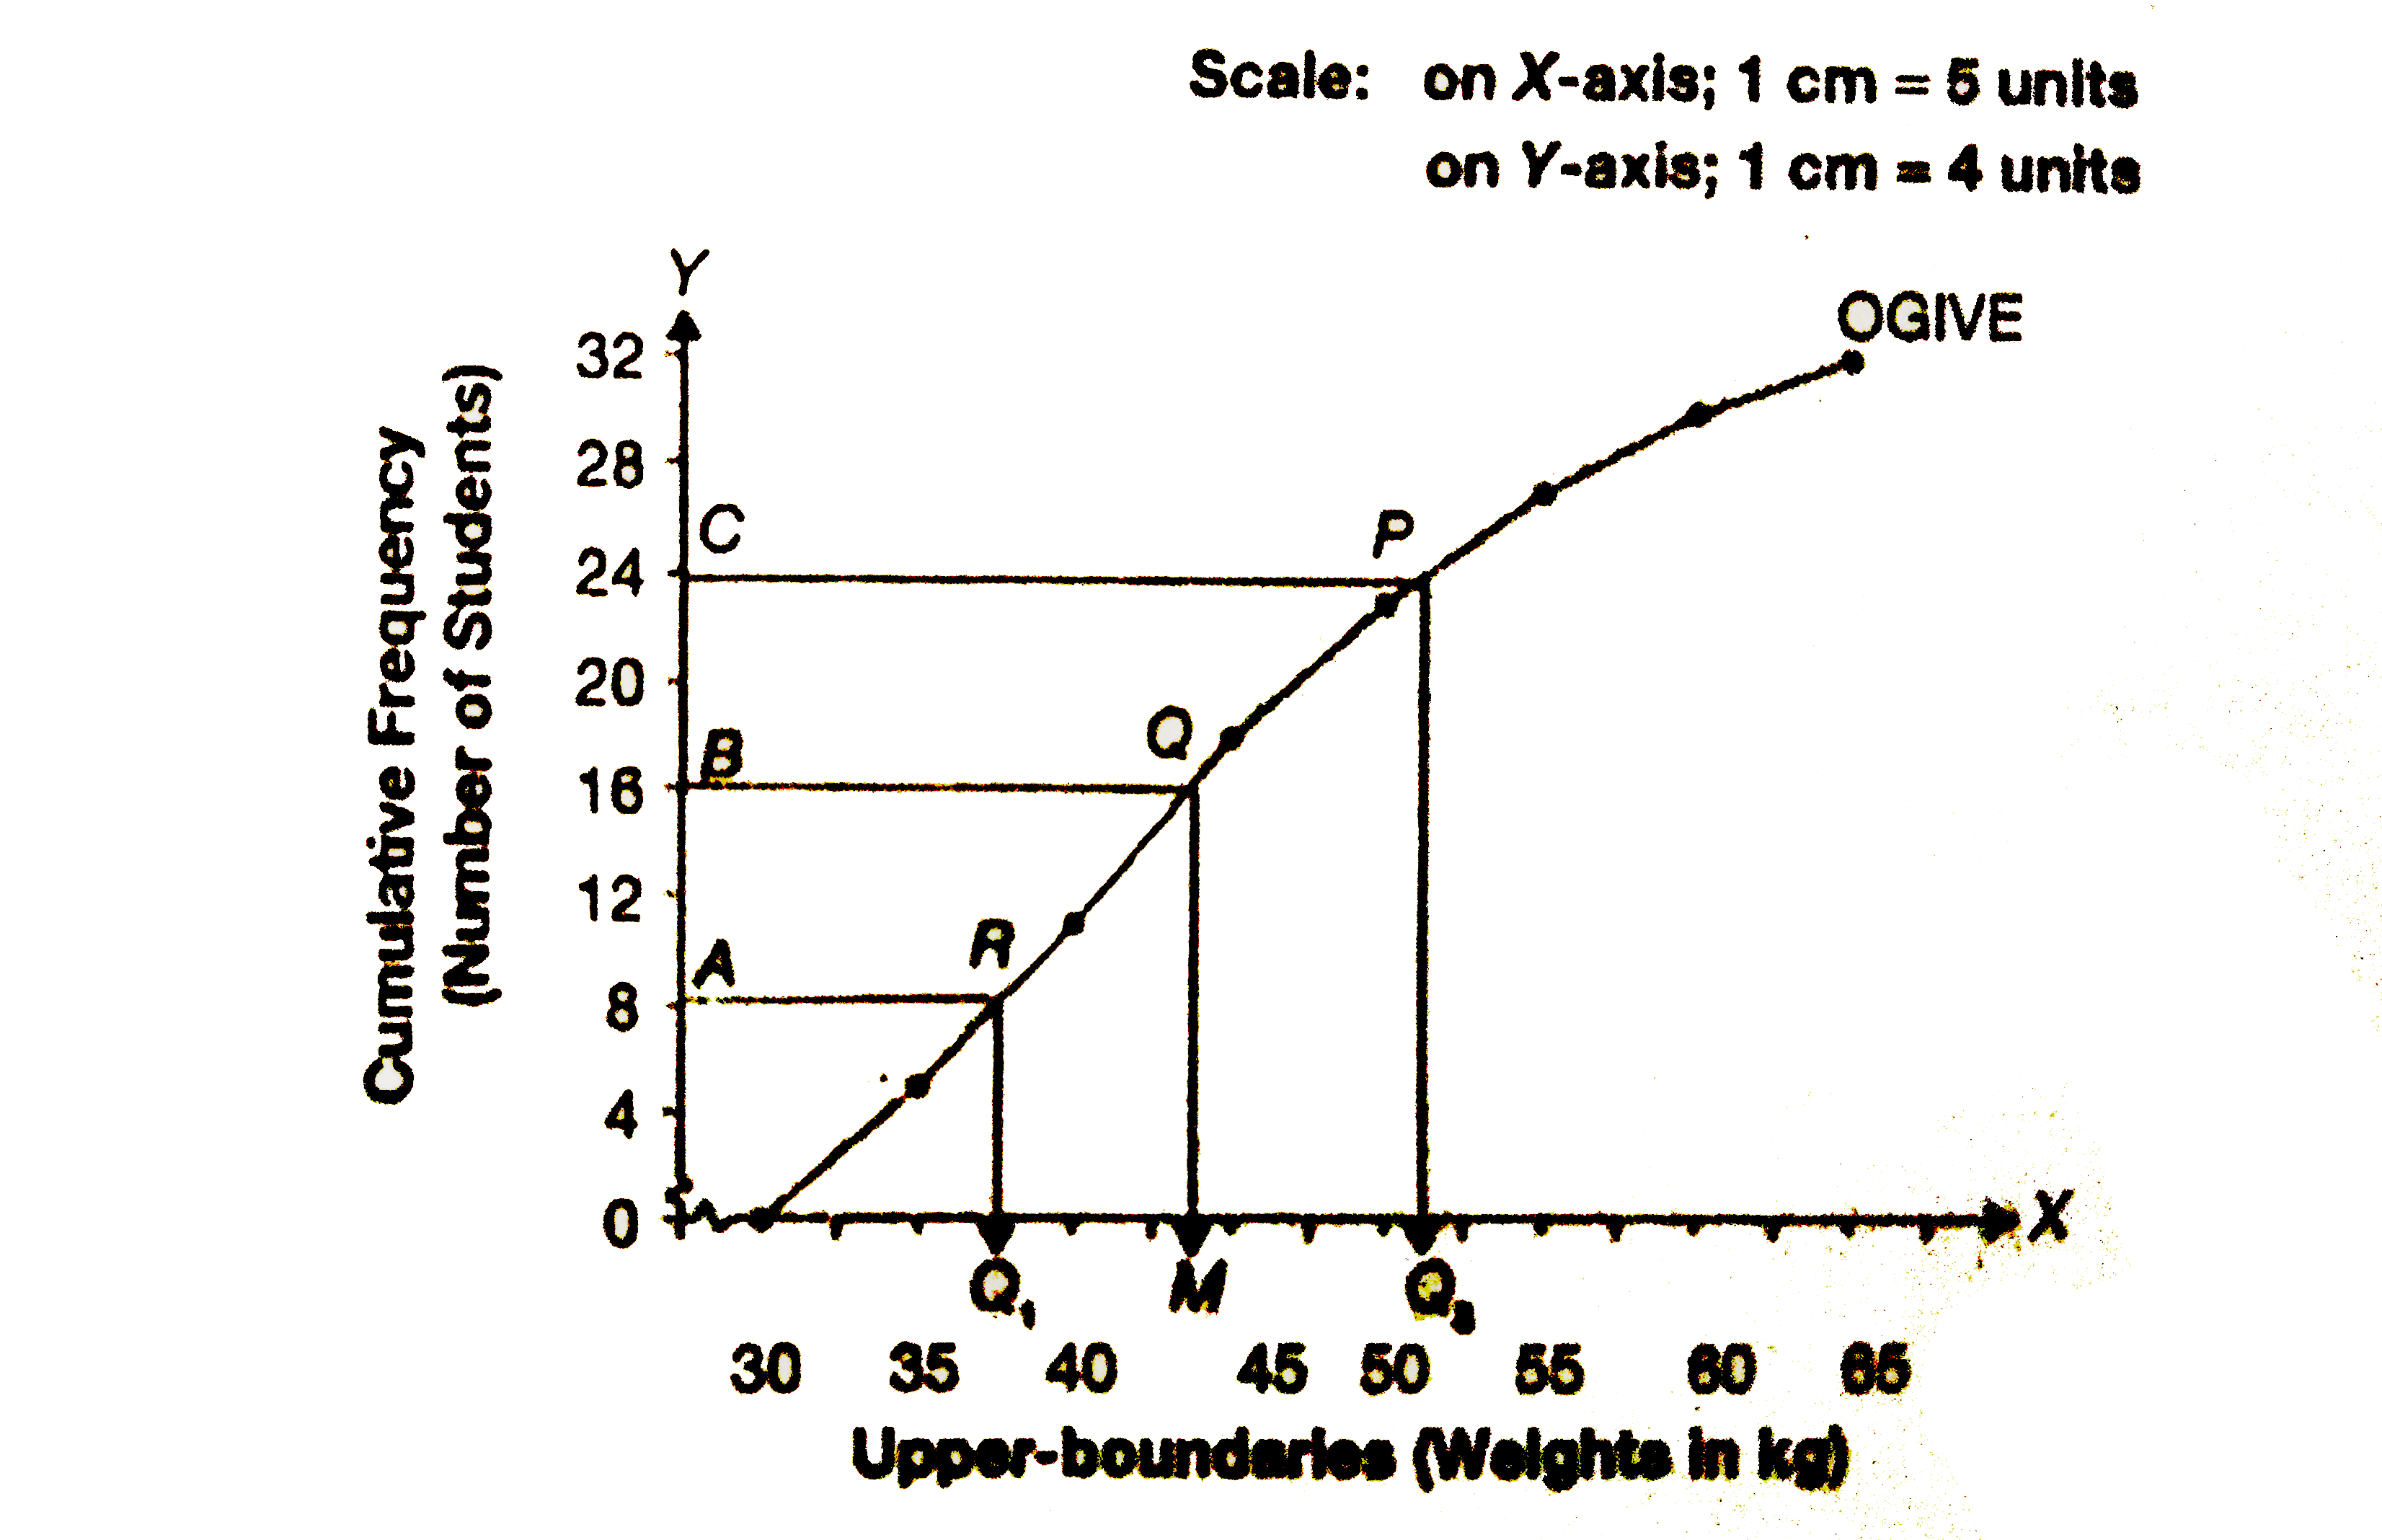
⇒N4=8,N2=16 and 3N2=24
From the graph :
Lower quartile (Q1)=38
Upper quartile (Q3) = 52
Median (M) = 44

Topper's Solved these Questions
- STATISTICS BOOK - PEARSON IIT JEE FOUNDATIONCHAPTER - STATISTICS EXERCISE - Very short answer type questions
30 Videos
- STATISTICS BOOK - PEARSON IIT JEE FOUNDATIONCHAPTER - STATISTICS EXERCISE - Short Answer Type Questions
13 Videos
- SHARES AND DIVIDENDSBOOK - PEARSON IIT JEE FOUNDATIONCHAPTER - SHARES AND DIVIDENDSEXERCISE - Level 3
15 Videos
- TAXATION BOOK - PEARSON IIT JEE FOUNDATIONCHAPTER - TAXATION EXERCISE - LEVEL 3
10 Videos
Similar Questions
The following table shows the distribution of the heights of a group of students:

Use a graph sheet to draw an Ogive for the distribution. Use the Ogive to find:
the inter quartile range
View SolutionThe following table shows the distribution of the heights of a group of students:

Use a graph sheet to draw an Ogive for the distribution. Use the Ogive to find:
the number of students whose height is more than 168 cm
View Solution
Knowledge Check
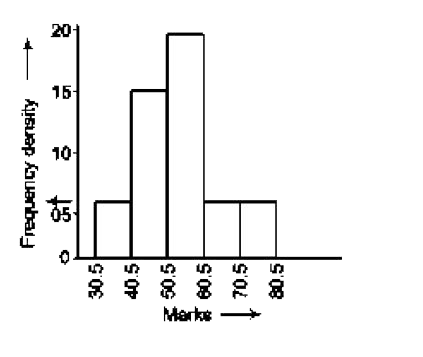
The following histogram shows the distribution of marks of 50 students in a collegeThe average marks of the students, number is
 A43.5B44.5C45.5D74.7
The following table shows the distribution of the heights of a group of students:

Use a graph sheet to draw an Ogive for the distribution. Use the Ogive to find:
the number of students whose height is less than 148 cm.
View SolutionThe following table shows the distribution of heights of a group of factory workers.

Determine the cumulative frequencies.
View SolutionThe following table shows the distribution of weights of seeds. Draw a frequency polygon.

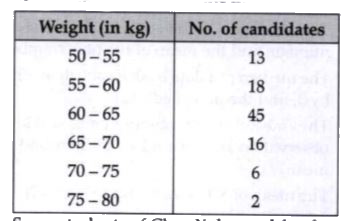
View SolutionThe following table shows the distribution of weights of 100 candiates appearing for a competition . Determine the modal weight .

View SolutionThe following table shows the classification of percentages of marks of students and the number of students. Draw a frequency polygon from the table.

View SolutionThe following table shows the classification of percentages of marks of students and the number of students.Draw a frequency polygen from the table.

View SolutionThe following table shows frequency distribution of marks of 100 students of 10th class which they obtianed in a practice examination. Find the median of the marks.

View Solution
