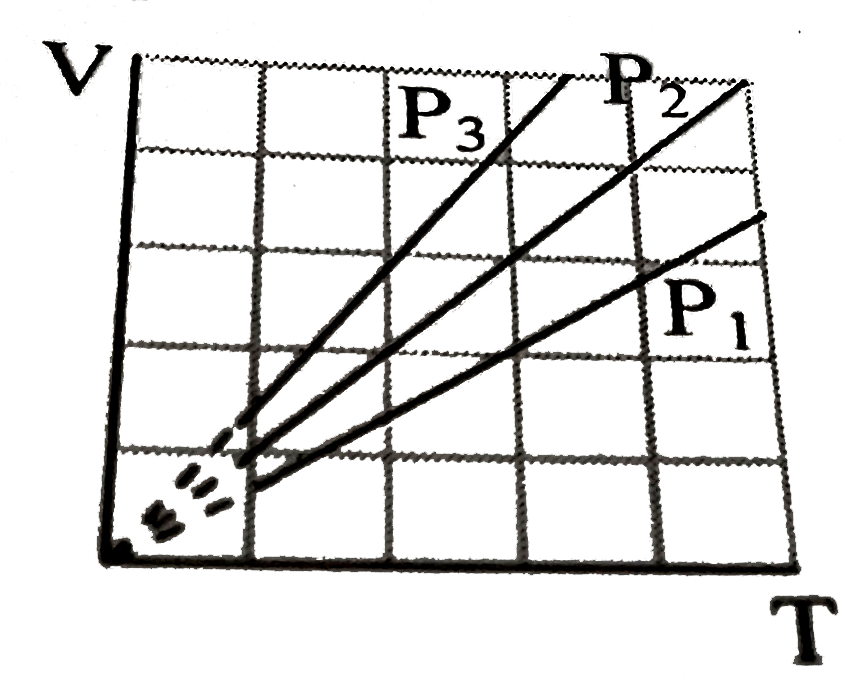
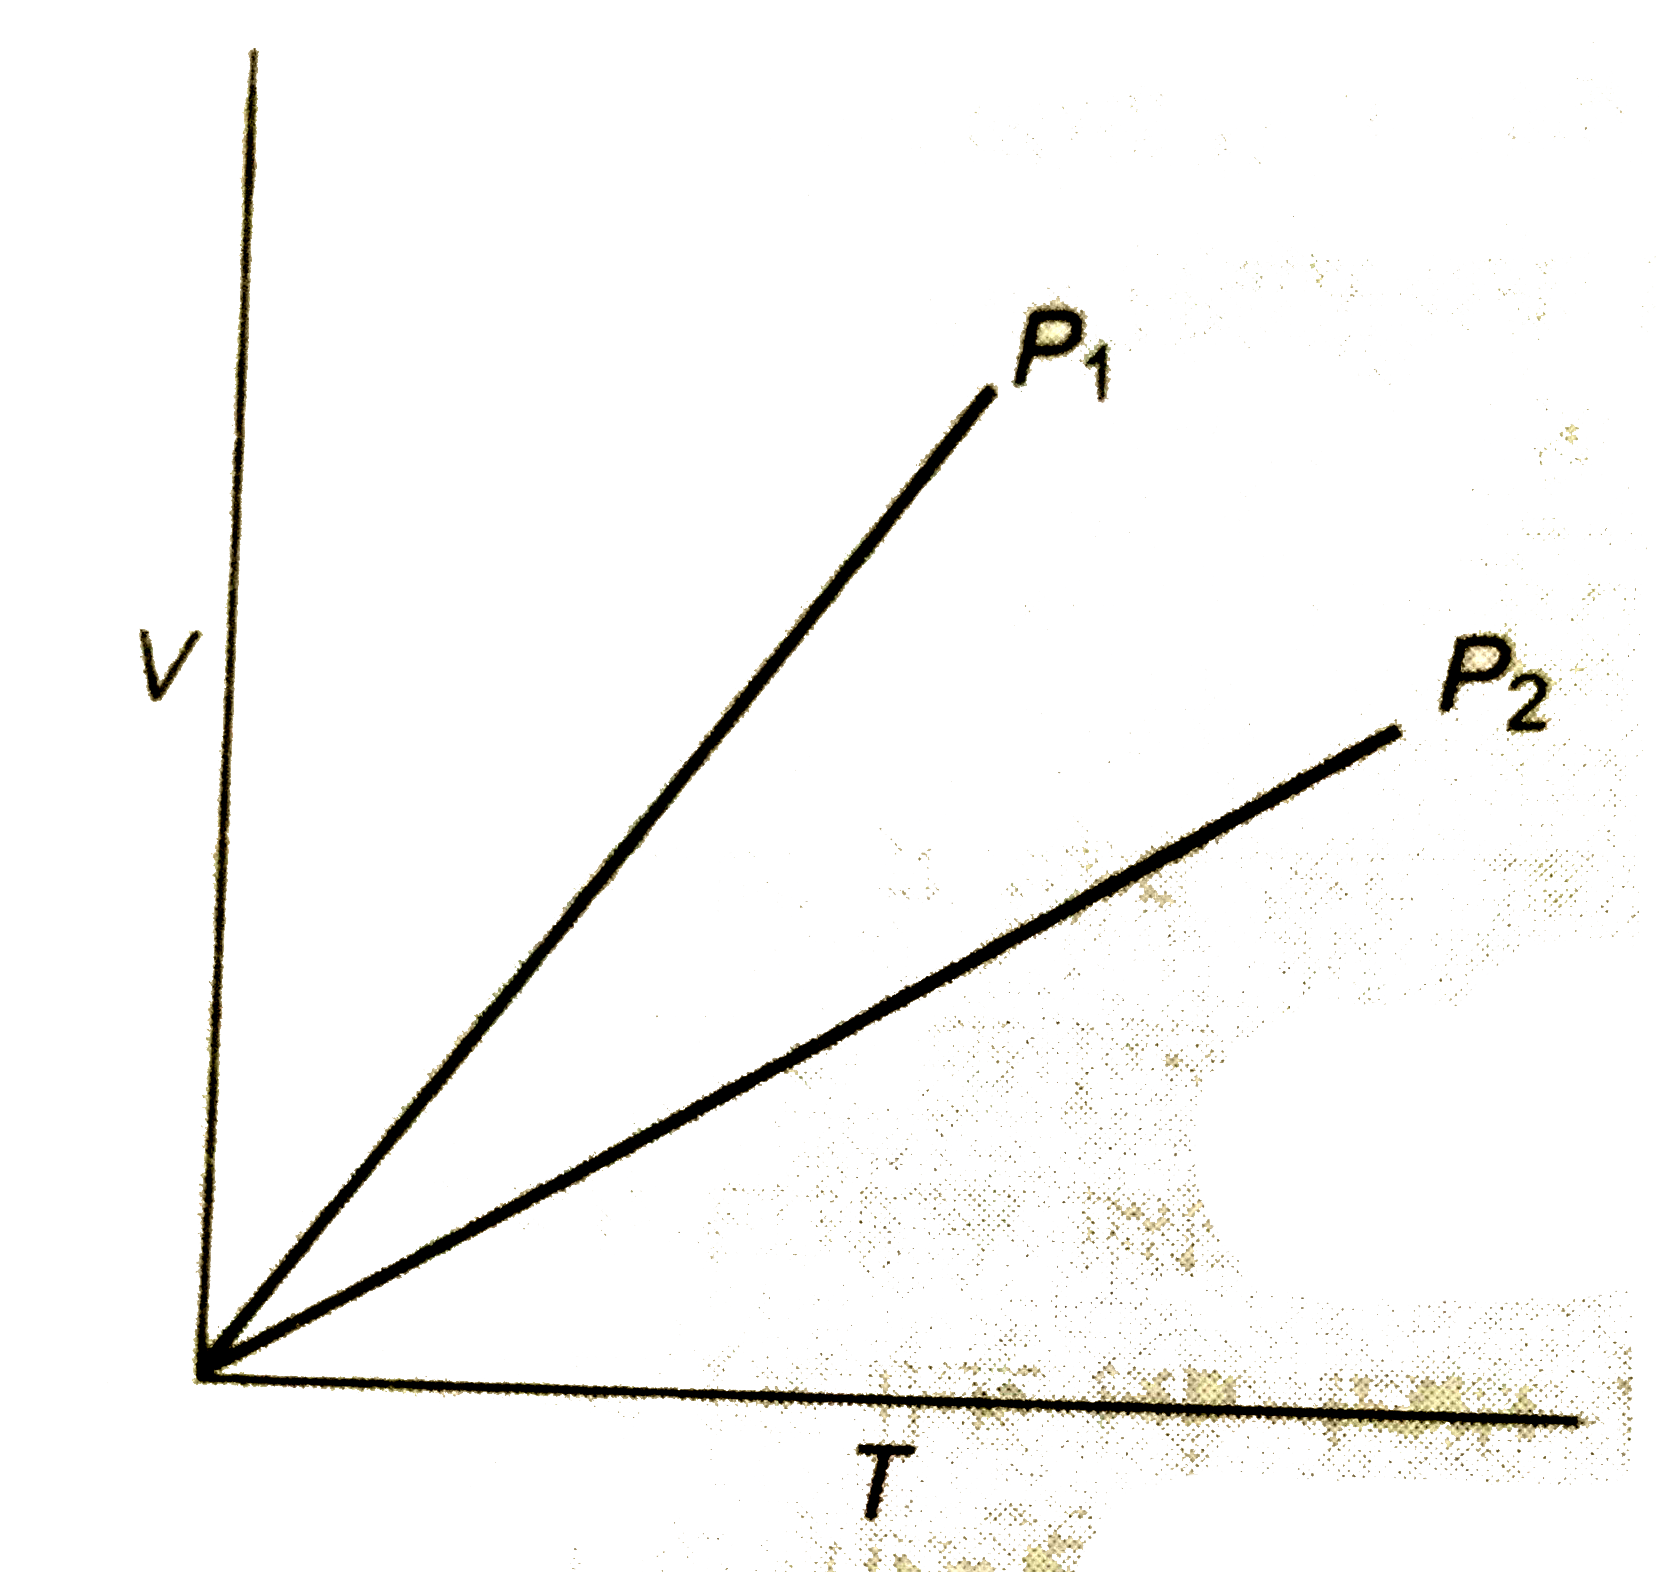
The following graph shows a V-T graph for isobaric processes at two different pressures. Identify which one occurs at higher pressure.Solution in Tamil
From the ideal gas equation, V=μRPT
V−T graph is inversely proportional to the pressure. If the slope is greater, lower is the pressure.
The slope =μRP
Here P1 has larger slope than P2. So P2>P1.

Topper's Solved these Questions
- BOOK - FULL MARKSCHAPTER - HEAT AND THERMODYNAMICSEXERCISE - TEXTUAL EVALUATION SOLVED (I. Multiple Choice Questions)13videos
HEAT AND THERMODYNAMICS
- BOOK - FULL MARKSCHAPTER - HEAT AND THERMODYNAMICSEXERCISE - TEXTUAL EVALUATION SOLVED (II. Short Answer Questions)48videos
HEAT AND THERMODYNAMICS
- BOOK - FULL MARKSCHAPTER - GRAVITATIONEXERCISE - ADDITIONAL QUESTIONS SOLVED (Numerical Problems)18videos
GRAVITATION
- BOOK - FULL MARKSCHAPTER - KINEMATICSEXERCISE - ADDITIONAL QUESTIONS SOLVED (LONG ANSWER QUESTIONS)10videos
KINEMATICS
Similar Questions
In hot summer after a both the body 's
02:13View SolutionAn object contains more heat -Is it a right statement ? If not why ?
01:55View SolutionA geo-stationary satellite is orbiting the Earth of a height of 6R above the surface of Earth R being the radius of the Earth calculate the time period of another satellite at a height of 2.5R from the surface of Earth.
01:56View SolutionExplain the types of motion with example
02:47View SolutionThe pressure v//s volume graph of an ideal gas is given different thermodynamics process which of the following option relevant in order : (Isochoric, isobaric, isothermal, adiabatic)
02:28View SolutionWhich of the following graphs show the v - t graph of a ball thrown upwards ?
02:10View SolutionThe state of an ideal gas was changed isobarically. The graph depicts three such isobaric lines. Which of the following is true about the pressures of the gas ?
 02:26View Solution
In the given isobaric process shown by graph between T and V.
03:12View SolutionAssertion Straight line on V-T graph represents isobaric process. Reason If V prop T, then p= constant i.e., orocess is isobaric.
05:32View Solutionसंलग्न चित्र में गैस के दाब P1 व P2 पर समदाबी ग्राफ प्रदर्शित है। कौन सा दाब अधिक है?
 View Solution
Which one of the following graph is correct at constant pressure?
04:15View SolutionThe given P-U graph shows the variation of internal energy of an ideal gas with increase in pressure. Which of the following pressure-volume graph is equivalent to this graph?
03:48View Solutionनिम्न में से कौन - सा आयतन (V), ताप (T) ग्राफ ( आलेख ) , एक वायुमंडलीय दाब पर आदर्श गैस के एक मोल के व्यवहार को प्रदर्शित करता है ?
View SolutionStatement I: If V-T graph is rectangular hyperbola,with increase in T, volume will decrease and hence,pressure will increase
Statement II: IF V-T graph is rectangular hyperbola,with increase in T,volume will decrease and hence,pressure will increase.02:44View Solutionनिम्न में से कौन-सा आयतन (V), ताप (T) ग्राफ, एक वायुमण्डलीय दाब पर आदर्श गैस के एक मोल के व्यवहार को प्रदर्शित करता है ?
03:32View Solution
