Figure shows the graph of pressure (P) versus temperature (T) (which is parabola) for a gas corresponding to a certain process. The equation of the curve is
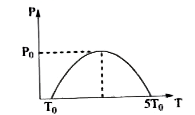
P0(T−3T0)2=4T20(P0−P)
P20(T−3T0)=4T0(P0−P)2
P0(T−3T0)2=9T20(P−P0)
P20(T−3T0)=T0(P−P0)2
The correct Answer is:A
Topper's Solved these Questions
- THERMAL PROPERTIES OF MATTERBOOK - AAKASH SERIESCHAPTER - THERMAL PROPERTIES OF MATTEREXERCISE - ADDITIONAL PRACTICE EXERCISE (LEVEL - II) PRACTICE SHEET (ADVANCED) More than One correct answer Type Questions
7 Videos
- THERMAL PROPERTIES OF MATTERBOOK - AAKASH SERIESCHAPTER - THERMAL PROPERTIES OF MATTEREXERCISE - ADDITIONAL PRACTICE EXERCISE (LEVEL - II) PRACTICE SHEET (ADVANCED) Linked Comprehension Type Questions
11 Videos
- THERMAL PROPERTIES OF MATTERBOOK - AAKASH SERIESCHAPTER - THERMAL PROPERTIES OF MATTEREXERCISE - ADDITIONAL PRACTICE EXERCISE (LEVEL - II) PRACTICE SHEET (ADVANCED) Straight Objective Type Questions (Expansion of Liquids :)
6 Videos
- SYSTEM OF PARTICLES AND ROTATIONAL MOTIONBOOK - AAKASH SERIESCHAPTER - SYSTEM OF PARTICLES AND ROTATIONAL MOTIONEXERCISE - PRACTICE EXERCISE
99 Videos
- THERMODYNAMICSBOOK - AAKASH SERIESCHAPTER - THERMODYNAMICSEXERCISE - EXERCISE - 3
33 Videos
Similar Questions
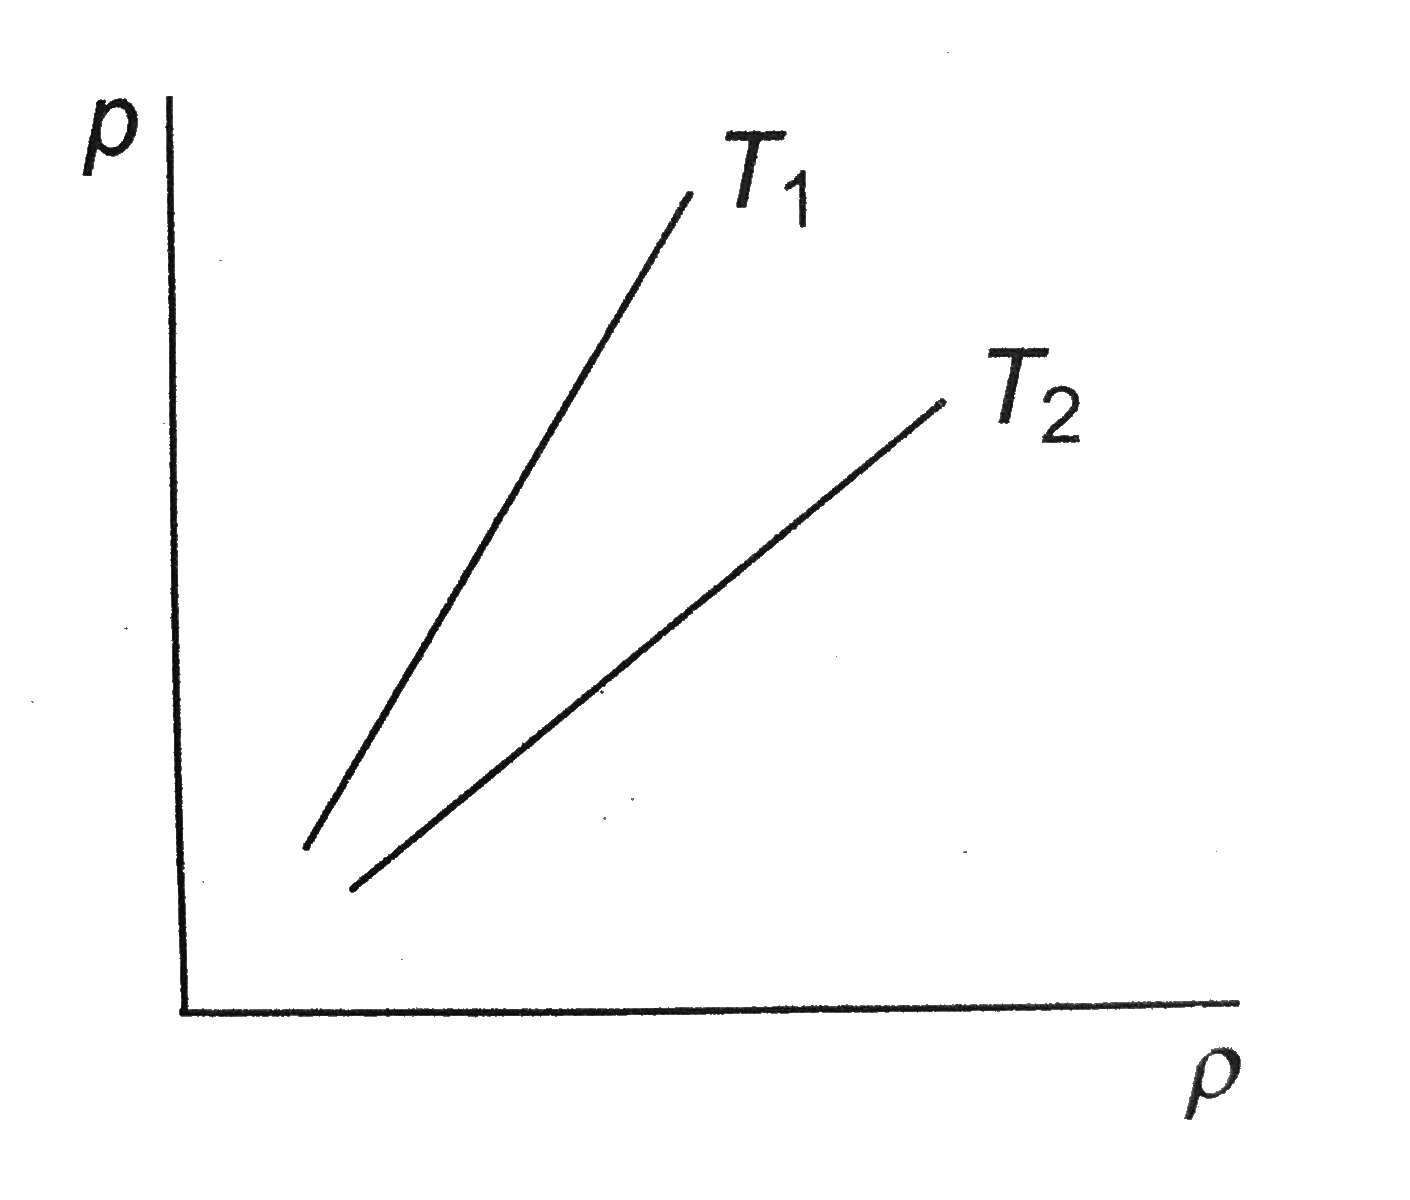
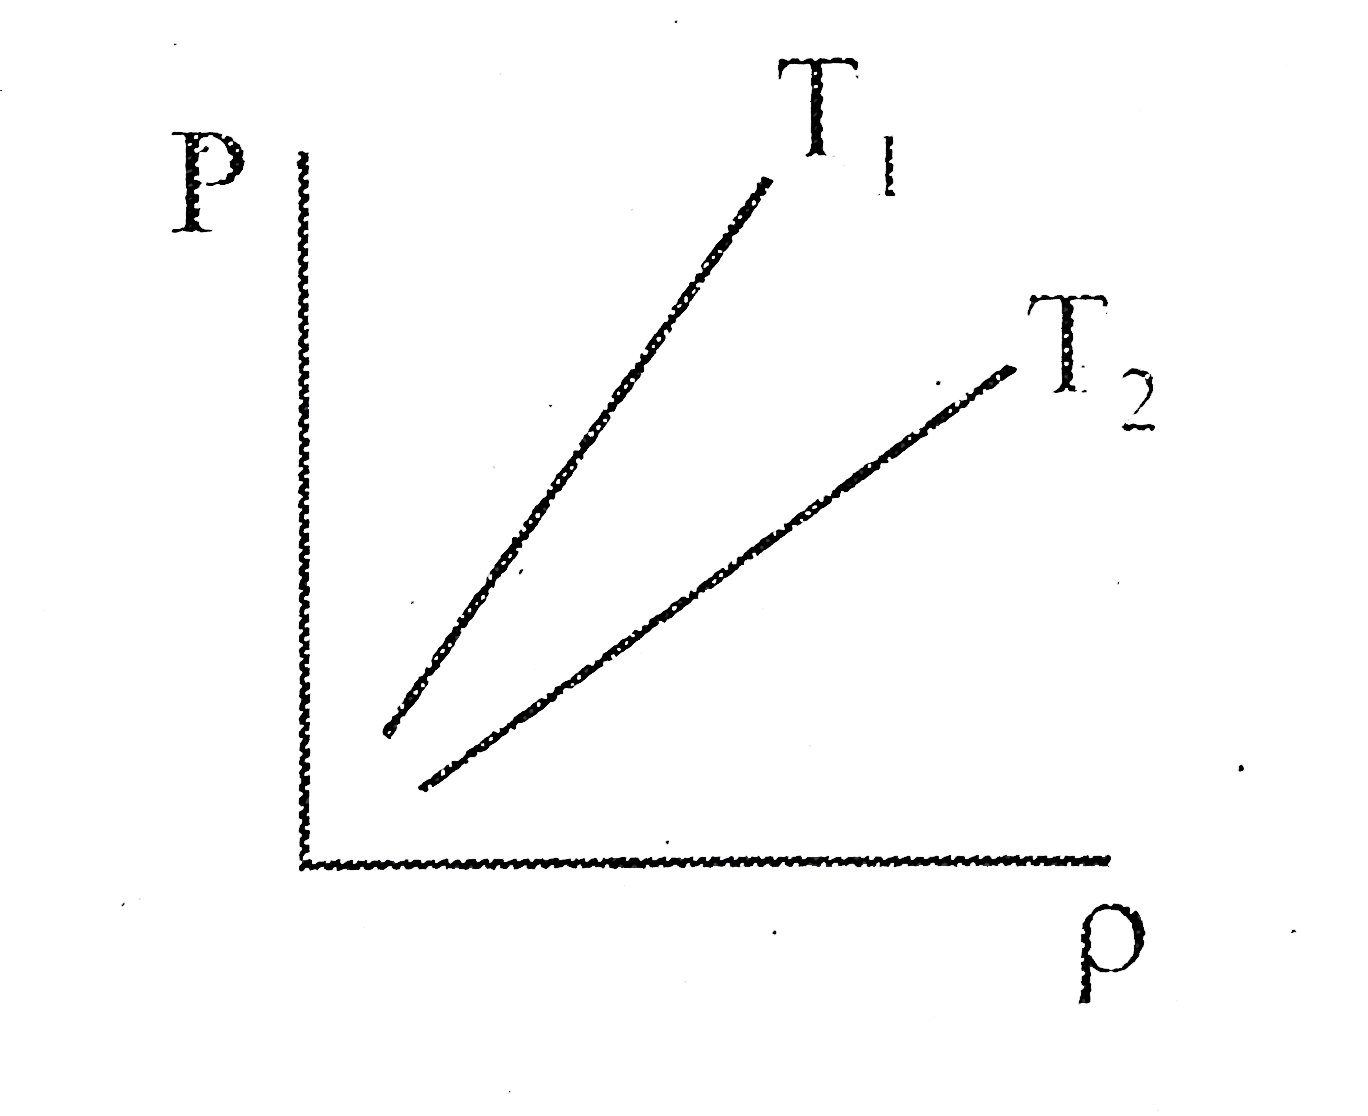
Figure shows graphs of pressure versus density for an ideal gas at two temperatures T1 and T2 Which is correct ?
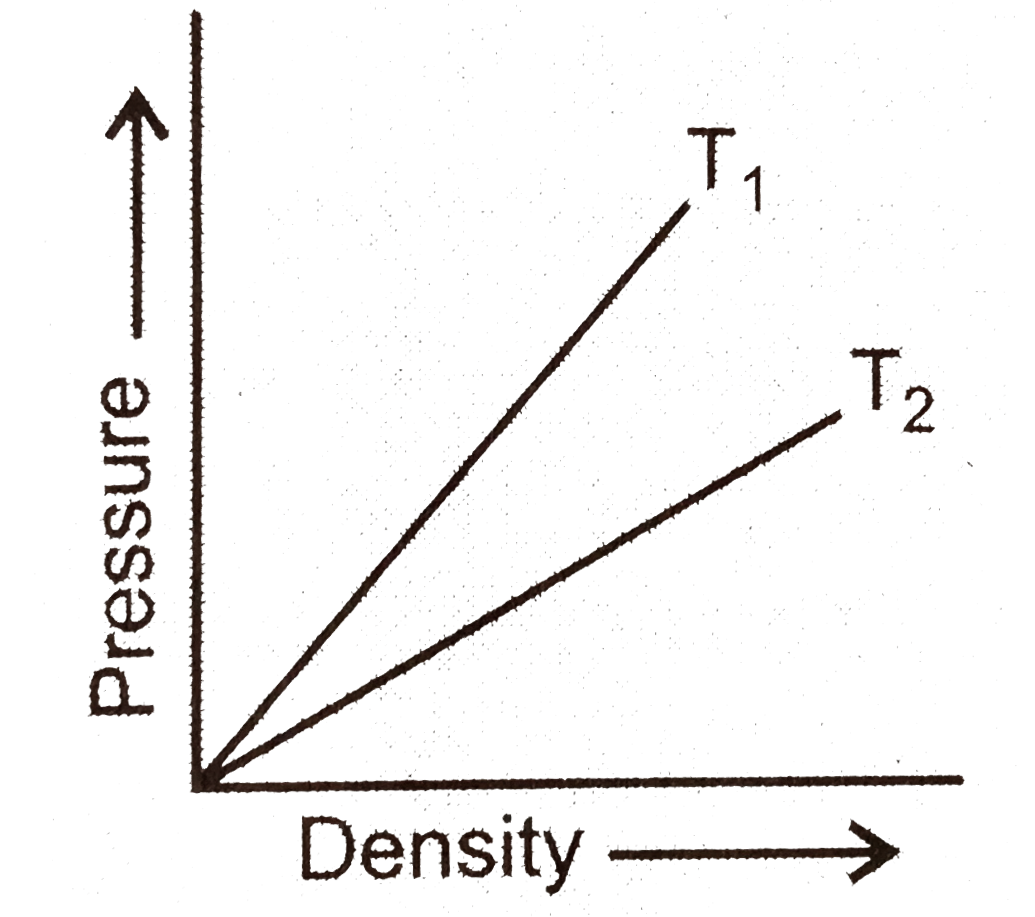 .
.
View SolutionThe given figure shows the pressure-temperature (P-T) diagram for a fixed mass of an ideal gas undergoing cyclic process ABCA. The corresponding pressure-volume (P-V) graph for the given cyclic process will be
_PHY_E06_003.png)
View Solution
Knowledge Check
Figure shows graphs of pressure versus density for an ideal gas at two temperatures T1 and T2 Which is correct ?
 .AT1>T2BT2>T1CBothDNone of these
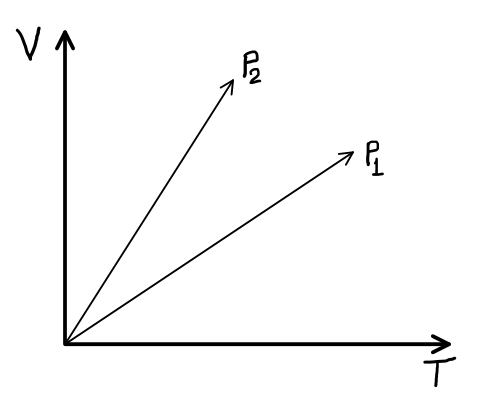
Figure shows the volume versus temperature graph for the same mass of a gas (assumed ideal) corresponding to two different pressure P1andP2. Then
AP1>P2BP1<P2CP1=P2DThe information is insufficientFigure shows graphs of pressure vs density for an ideal gas at two temperatures Tt and T2
AT1>T2BT1=T2CT1<T2Dany of the three is possible
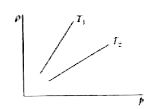
Figure shows graphs of pressure versus density for an ideal gas at two temperatures T1 and T2 Then
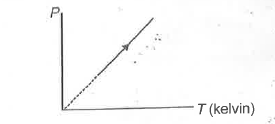
View SolutionThe graph of pressure and temperature for an ideal gas is as shown in figure. The given process is
View SolutionFigure shows graphs of pressure vs density for an ideal gas at two temperature T1andT2. Which of the following is correct?
View SolutionFigure shows graphs of pressure vs density for an ideal gas at two temperature T1 and T2 . Which of the following is correct ?
View SolutionFigure shows graphs of pressure vs density for an ideal gas at two temperature T1andT2. Which of the following is correct?

View Solution

