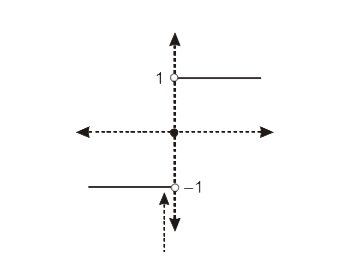
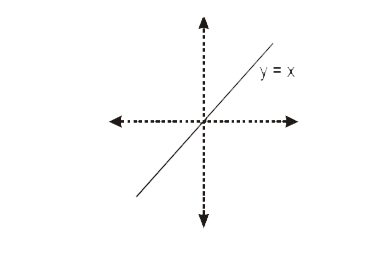
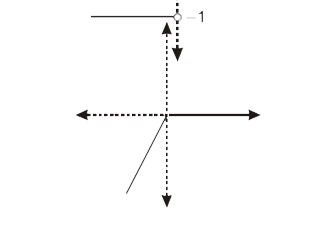
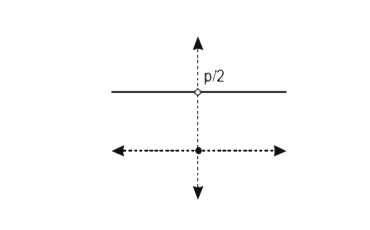
The graph of function f1(x)={1,ifx≤0x2+1,if0<x<2,f2(x)=(log)12(x−3),f3(x)=23−xandf4(x)=e{x}where5,ifx≥2 {.} denote the fractional part function are given (not in order) as: The correct order of graph of function f1(x),f2(x),f3(x)andf4(x) is ABCD (B) ACBD (C) CBDA (D) ADCB
Step by step video & image solution for The graph of function f_1(x)={1,ifxlt=0x^2+1,if0<x<2,f_2(x)=(log)_(1/2)(x-3),f_3(x)=2^(3-x)a n df_4(x)=e^({x})w h e r e5,ifxgeq2 {.} denote the fractional part function are given (not in order) as: The correct order of graph of function f_1(x),f_2(x),f_3(x)a n df_4(x) is ABCD (B) ACBD (C) CBDA (D) ADCB by Maths experts to help you in doubts & scoring excellent marks in Class 12 exams.
Updated on:21/07/2023Topper's Solved these Questions
Similar Questions
Knowledge Check
The function f(x)=⎧⎪ ⎪⎨⎪ ⎪⎩x+2ifx<−1x2if−1≤x≤1(x−2)2ifx≥1
Ais continuos for all x∈RBis continuos but not differentiable, ∀ax∈RCis such that f'(x) change its sign exactly twiceDhas two local maxima and two local minimaThe graph of the function f(x)=Limt→0(2xπcot−1xt2), is
A B
B C
C D
D
Draw the graph of the function f(x)=⎧⎪⎨⎪⎩x2, when x<0x, when 0≤x≤11/x, when 1≤x<∞.
View SolutionDraw the graph of the function f(x)=x−∣∣x−x2∣∣,−1≤x≤1 and discuss the continuity or discontinuity of f in the interval −1≤x≤1
View SolutionPlot the graph of the function f(x)=limt→0(2xπtan−1xt2)
View SolutionDraw the graph of the function: f(x)=−|x−1|12
View SolutionExamine the continuity of the function f(x)=
{3x−2x≤0x+1x>0
a t x=0
Also sketch the graph of this function.
View SolutionDiscuss the continuity of the function f, where f is defined byf(x)=⎧⎪⎨⎪⎩−2ifx≤−12xif−1<x≤12ifx>1
View Solution
