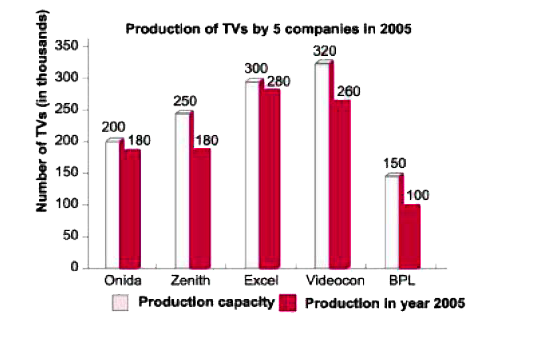
The TVs produced by Excel form what percentage of the total production?
Step by step video & image solution for The TVs produced by Excel form what percentage of the total production? by Maths experts to help you in doubts & scoring excellent marks in Class 14 exams.
Updated on:21/07/2023Topper's Solved these Questions
- BAR CHARTBOOK - ARIHANT SSCCHAPTER - BAR CHARTEXERCISE - Base Level Questions
22 Videos
- BAR CHARTBOOK - ARIHANT SSCCHAPTER - BAR CHARTEXERCISE - Higher Skill Level Questions
20 Videos
- AVERAGESBOOK - ARIHANT SSCCHAPTER - AVERAGESEXERCISE - Final Round
27 Videos
- BOATS AND STREAMS BOOK - ARIHANT SSCCHAPTER - BOATS AND STREAMS EXERCISE - EXERCISE HIGHER SKILL LEVEL QUESTIONS
9 Videos
Similar Questions
out of Total production of 6450 tonnes of coal mine A quantity of 645 tonnes was lost during extraction what percentage of the total production was the net coal extracted
View Solution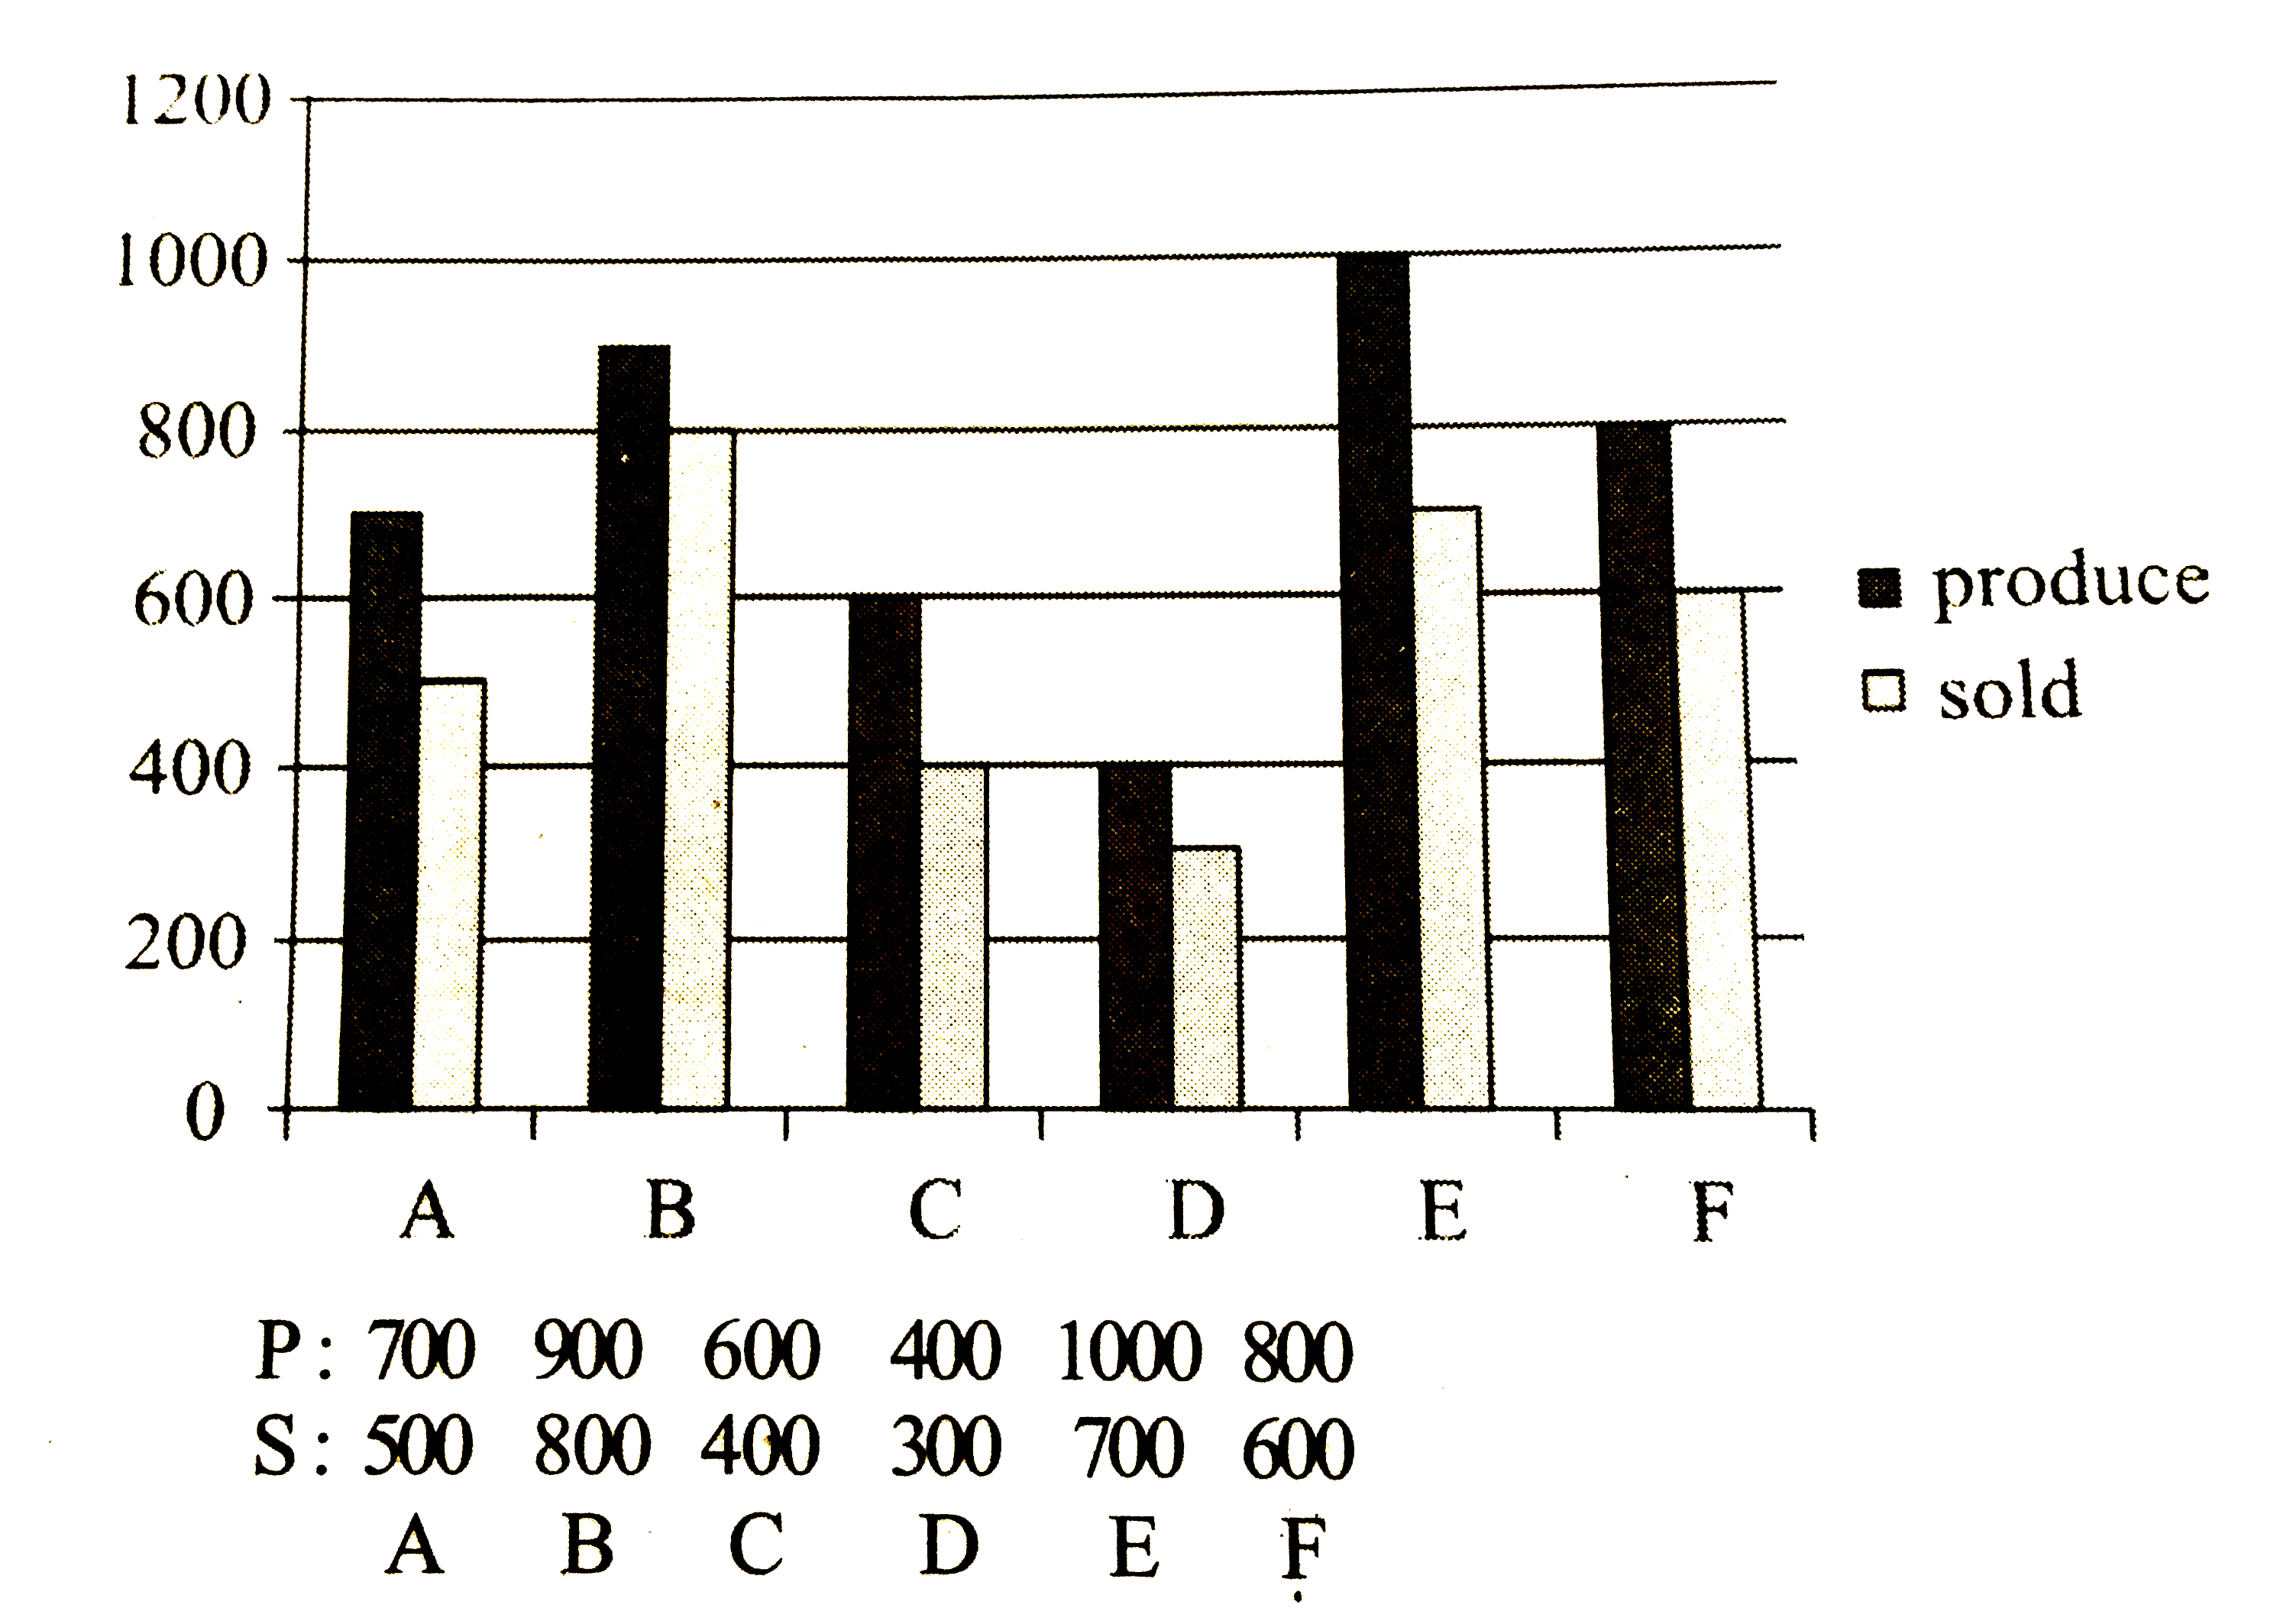
The total unit sold by D,E,F together is approximately what percentage of the total units produced by theses companies ?
View Solution
Knowledge Check
The production of rice in 2001-02 forms what percentage of total production out of the given years?
A15.2%B3.23%C4.128%D6.45%Simplify:- 36 + 451 ÷ 11 = ?
Aa. 65Bb. 44.27Cc. 77Dd. 454.27In India there were only three bicycle making companies in the given period. The following table shows the production of units (in 000)
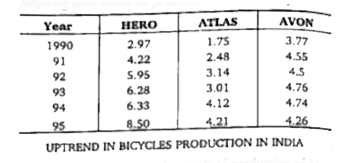
Atlas cycles on an average account for what percentage of the total bicycles production :A15%B23.4%C34.5%D29%
Study the table graph carefully to answer the questions that follows
Production of main crops in India (in million tonnes)
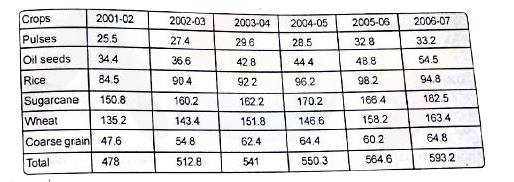
Production of rice was what percentage of the total crops produced in the year 2001-02 ?
View SolutionThe pie chart shows the annual car production (percentage wise) of six countries A,B,C,D,E and F.
Study the pie chart and answer the question.
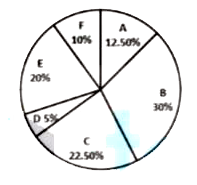
Total number of cars produced =40,00,000
The number of cars produced by country B is what percent more than that produced by country E?
View SolutionIn the following table year wise ratio of number of taxable and non-taxable products produced by a company has been shown. The total production of the company increases by 10% every year.
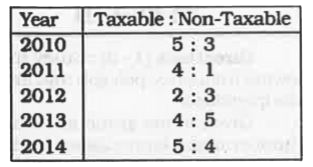
Find the ratio of taxable products produced in year 2011 and 2012 and non-taxable products in years 2011 and 2012.
View SolutionThe table given below shows the production of maize by 5 different states as a percenatge of total production. Each state produces only maizw and rice. There are three types of rice - R1,R2andR3. The table also shows the R1 type of rice produced as a percentage of total rice production and the ratio of R2andR3 type of rice. Total production by each state is 625000 tonnes.
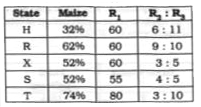
Production of R3 type of rice by state X is what percentage of production of R1 type of rice by state S?
View SolutionThe table given below shows the production of maize by 5 different states as a percenatge of total production. Each state produces only maizw and rice. There are three types of rice - R1,R2andR3. The table also shows the R1 type of rice produced as a percentage of total rice production and the ratio of R2andR3 type of rice. Total production by each state is 625000 tonnes.
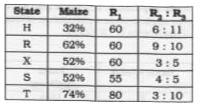
F = Total production of R2 type of rice by all the states.
K = Average of the total production of R1 type of rice by all the states.
What is the value of KF?
View Solution
