Under constant temperature, graph between P and 1/V is a :
parabola
straight line
hyperbola
circle.
The correct Answer is:B
Topper's Solved these Questions
Similar Questions
Knowledge Check
Under constant pressure, graph between p and 1V is a
AparabolaBhyperbolaCstraight lineDcircleAt constant temperature if a graph plotted between logP and log(1V) has an intercept of unity then what will be the value of constant (k)
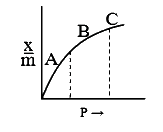
A1B10C100D1000A graph is plotted between extent of adsorption vs pressure (P) at constant temperature, the Frendlich equation at points A, B, C respectively are:
 Axm=kp,xm=kp1/n,xm=kpoBxm=kp,xm=kpn,xm=kp1/nC(x)/(m)=kp^(1//n),(x)/(m)=kp^(n),(x)/(m)=kp^(1//n)Dxm=kp∞,xm=kp1/n,xm=kpn
At constant temperature, the effect of change of pressure on volume of a gas was as given below

Plot the following graphs :
P vs V
View SolutionAt constant temperature for given amount of an ideal gas the correct graph between PV vs P is
View SolutionWhich one of the following relationships when graphed does not give a straight line for helium gas?
I. K.E. and T at constant pressure and volume
II. P v/s V at constant temperature for a constant mass
III. V v/s 1/T at constant pressure for a constant mass
View SolutionThe slope of the graph between log P and log V at constant temperature for a given mass of gas is
View SolutionWhich one of the following relationships when graphed does not give a straight line for helium gas?
I. K.E. and T at constant pressure and volume
II. P v/s V at constant temperature for a constant mass
III. V v/s 1/T at constant pressure for a constant mass
View Solution
