The following pie chart shows the performance in an examination in a particular year for 360 students. The number of students who passed in 2nd division is more than those in 1st division by
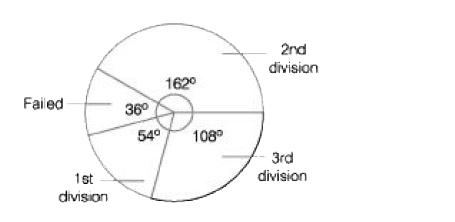
111
112
109
108
The correct Answer is:A, B
Step by step video, text & image solution for The following pie chart shows the performance in an examination in a particular year for 360 students. The number of students who passed in 2nd division is more than those in 1st division by by Maths experts to help you in doubts & scoring excellent marks in Class 14 exams.
Topper's Solved these Questions
- BOOK - ARIHANT SSCCHAPTER - PIE CHART EXERCISE - Exercise Higher Skill Level Questions15videos
PIE CHART
- BOOK - ARIHANT SSCCHAPTER - PIE CHART EXERCISE - Exercise Higher Skill Level Questions15videos
PIE CHART
- BOOK - ARIHANT SSCCHAPTER - PERMUTATIONS AND COMBINATIONSEXERCISE - HIGHER SKILL LEVEL QUESTIONS19videos
PERMUTATIONS AND COMBINATIONS
- BOOK - ARIHANT SSCCHAPTER - PIPES AND CISTERNS EXERCISE - EXERCISE HIGHER SKILL LEVEL QUESTION17videos
PIPES AND CISTERNS
Similar Questions
The following piechart shows the number of students who failed in different subjects in an examination. Examine the chart and answer the questions 5 to the total number of students who have failed is 500.

Number of students who failed in Mathema tics is less than the students who did not qualify in language is -View SolutionThe following piechart shows the number of students who failed in different subjects in an examination. Examine the chart and answer the questions 5 to the total number of students who have failed is 500.
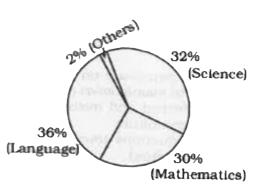
Total number of students who did not qualify in Mathematics or Language or Science, isView Solution
Knowledge Check
- Question 1 - Select One
The following pie chart shows the performance in an examination in a particular year for 360 students. The number of students who passed in 1st division is
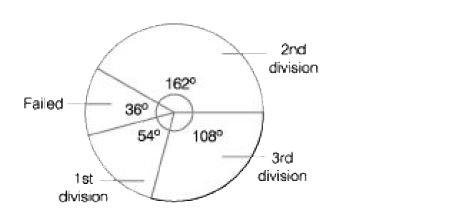 A45B54C64D74
 - Question 2 - Select One
The following pie chart shows the performance in an examination in a particular year for 360 students.The total number of students who have passed in 2nd and 3rd division is
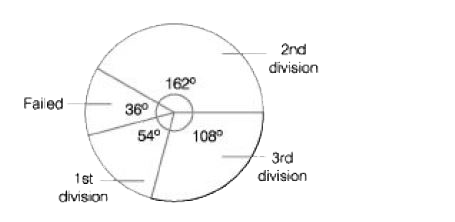 A162B270C108DNone of these
 - Question 3 - Select One
The following pie chart shows the performance in an examination in a particular year for 360 students. The percentage of students who have failed in the examination is
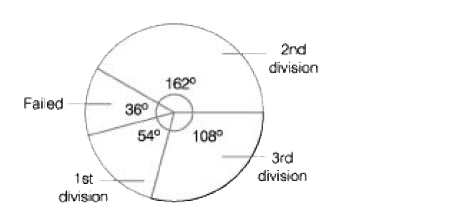 A0.2B0.36C0.1D0.3
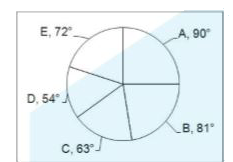
The pie chart given below shows the number of students in 5 sections .The number of students is 7200.
The number of students in section A is what percent of that of section B?
 View Solution
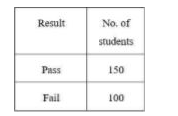
The following table shows the results of the students who have attended an examination . What percentage of students passed
 View Solution
The following bar graph shows the number of students in a particular class of school. Then, answer the following questions.
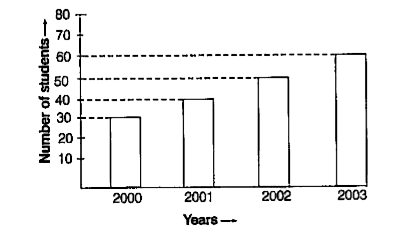
Is the number of students in the year 2002 is twice that in the year 2000?View SolutionThe line chart given below shows the number of students in 2 sections X and Y from year 2009 to 2016.
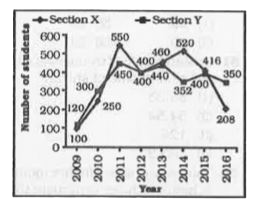
For how many years was the number of students in section Y was more than that of section X?View SolutionStudy the given histogram that shows the marks obtained by students in an examination and answer the question that follows .
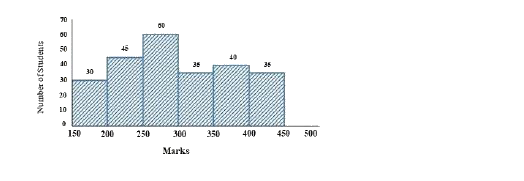
The number of students who obtained less than 250 marks is :View Solution

