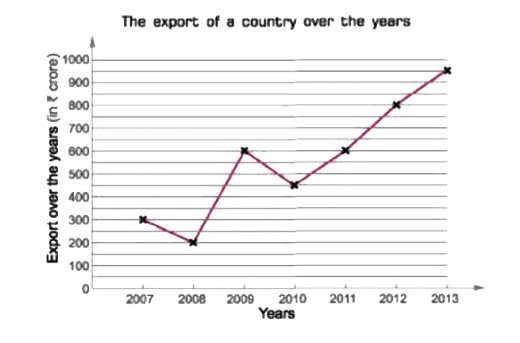
Study the following graph carefully and answer the given questions.
Exports in 2009 is approximately what per cent of that of year 2010 ?
Step by step video & image solution for Study the following graph carefully and answer the given questions. Exports in 2009 is approximately what per cent of that of year 2010 ? by Maths experts to help you in doubts & scoring excellent marks in Class 14 exams.
Updated on:21/07/2023Topper's Solved these Questions
- LINE GRAPHBOOK - ARIHANT SSCCHAPTER - LINE GRAPHEXERCISE - FAST TRACK PRACTICE
43 Videos
- INDICES AND SURDSBOOK - ARIHANT SSCCHAPTER - INDICES AND SURDSEXERCISE - HIGHER SKILL LEVEL QUESTIONS
17 Videos
- LINEAR EQUATIONSBOOK - ARIHANT SSCCHAPTER - LINEAR EQUATIONSEXERCISE - Higher Skill Level Questions
7 Videos
Similar Questions
Knowledge Check
Study the following graph carefully and answer the given questions.
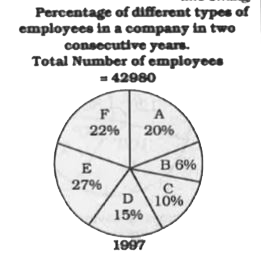
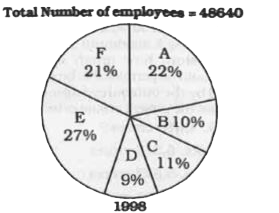
If the number of A type employees in 1998 was approximately what percent of the number of A type employees in 1997 ?A140B115C95D125Study the following graph carefully and answer the questions -----
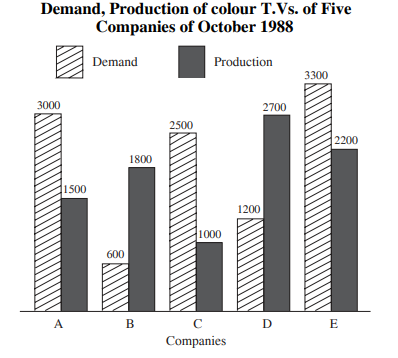
The demand for company 'B' is approximately what percent of the demand for company 'C' ?A4B24C20D60Study the graph carefully and answer the questions below it -----
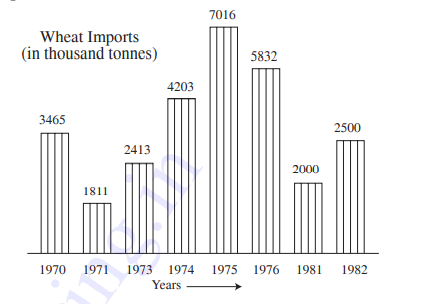
The imports in 1974 is approximately what percent of the average imports for the given years ?A125B115C190D85
Study the following table and the answer the questions based on it : (in lakhs of Rs.)
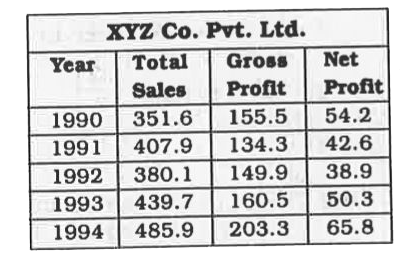
The total sales in 1993 is approximately what percent of the total sales of 1990 ?
View SolutionStudy the graph carefully and answer the questions below it -----
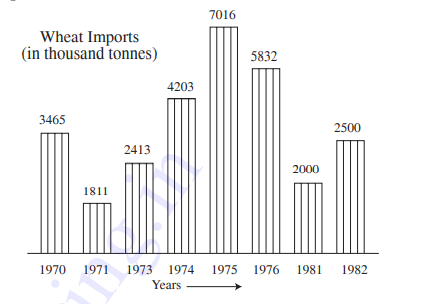
The imports in 1976 was approximately how many times that of the year 1971 ?
View SolutionStudy the following graph carefully and answer the given questions.
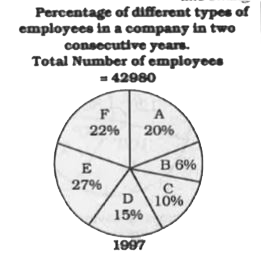
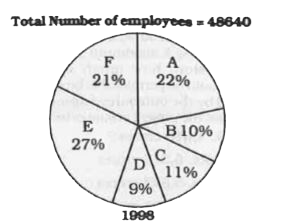
What was the approximate difference in the number of B type of employees during 1997 and 1998 ?
View SolutionThe following graph shows production (in thousands) of two types (P and Q) of vehicles by a factory over the years 2009 to 2014. Study the graph and answer the given questions.
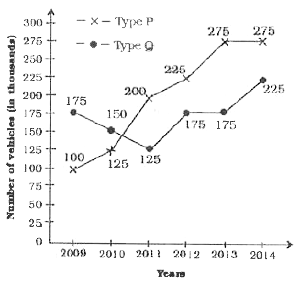
The production of type Q vehicles in 2010 was approximately what percent of Type P vehicles in 2014?
View SolutionStudy the following graph carefully and answer the following questions -----
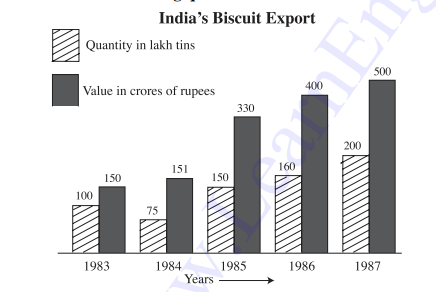
What was the approximate per cent increase in export value from 1983 to 1987 ?
View Solution

