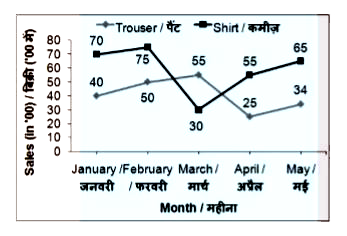
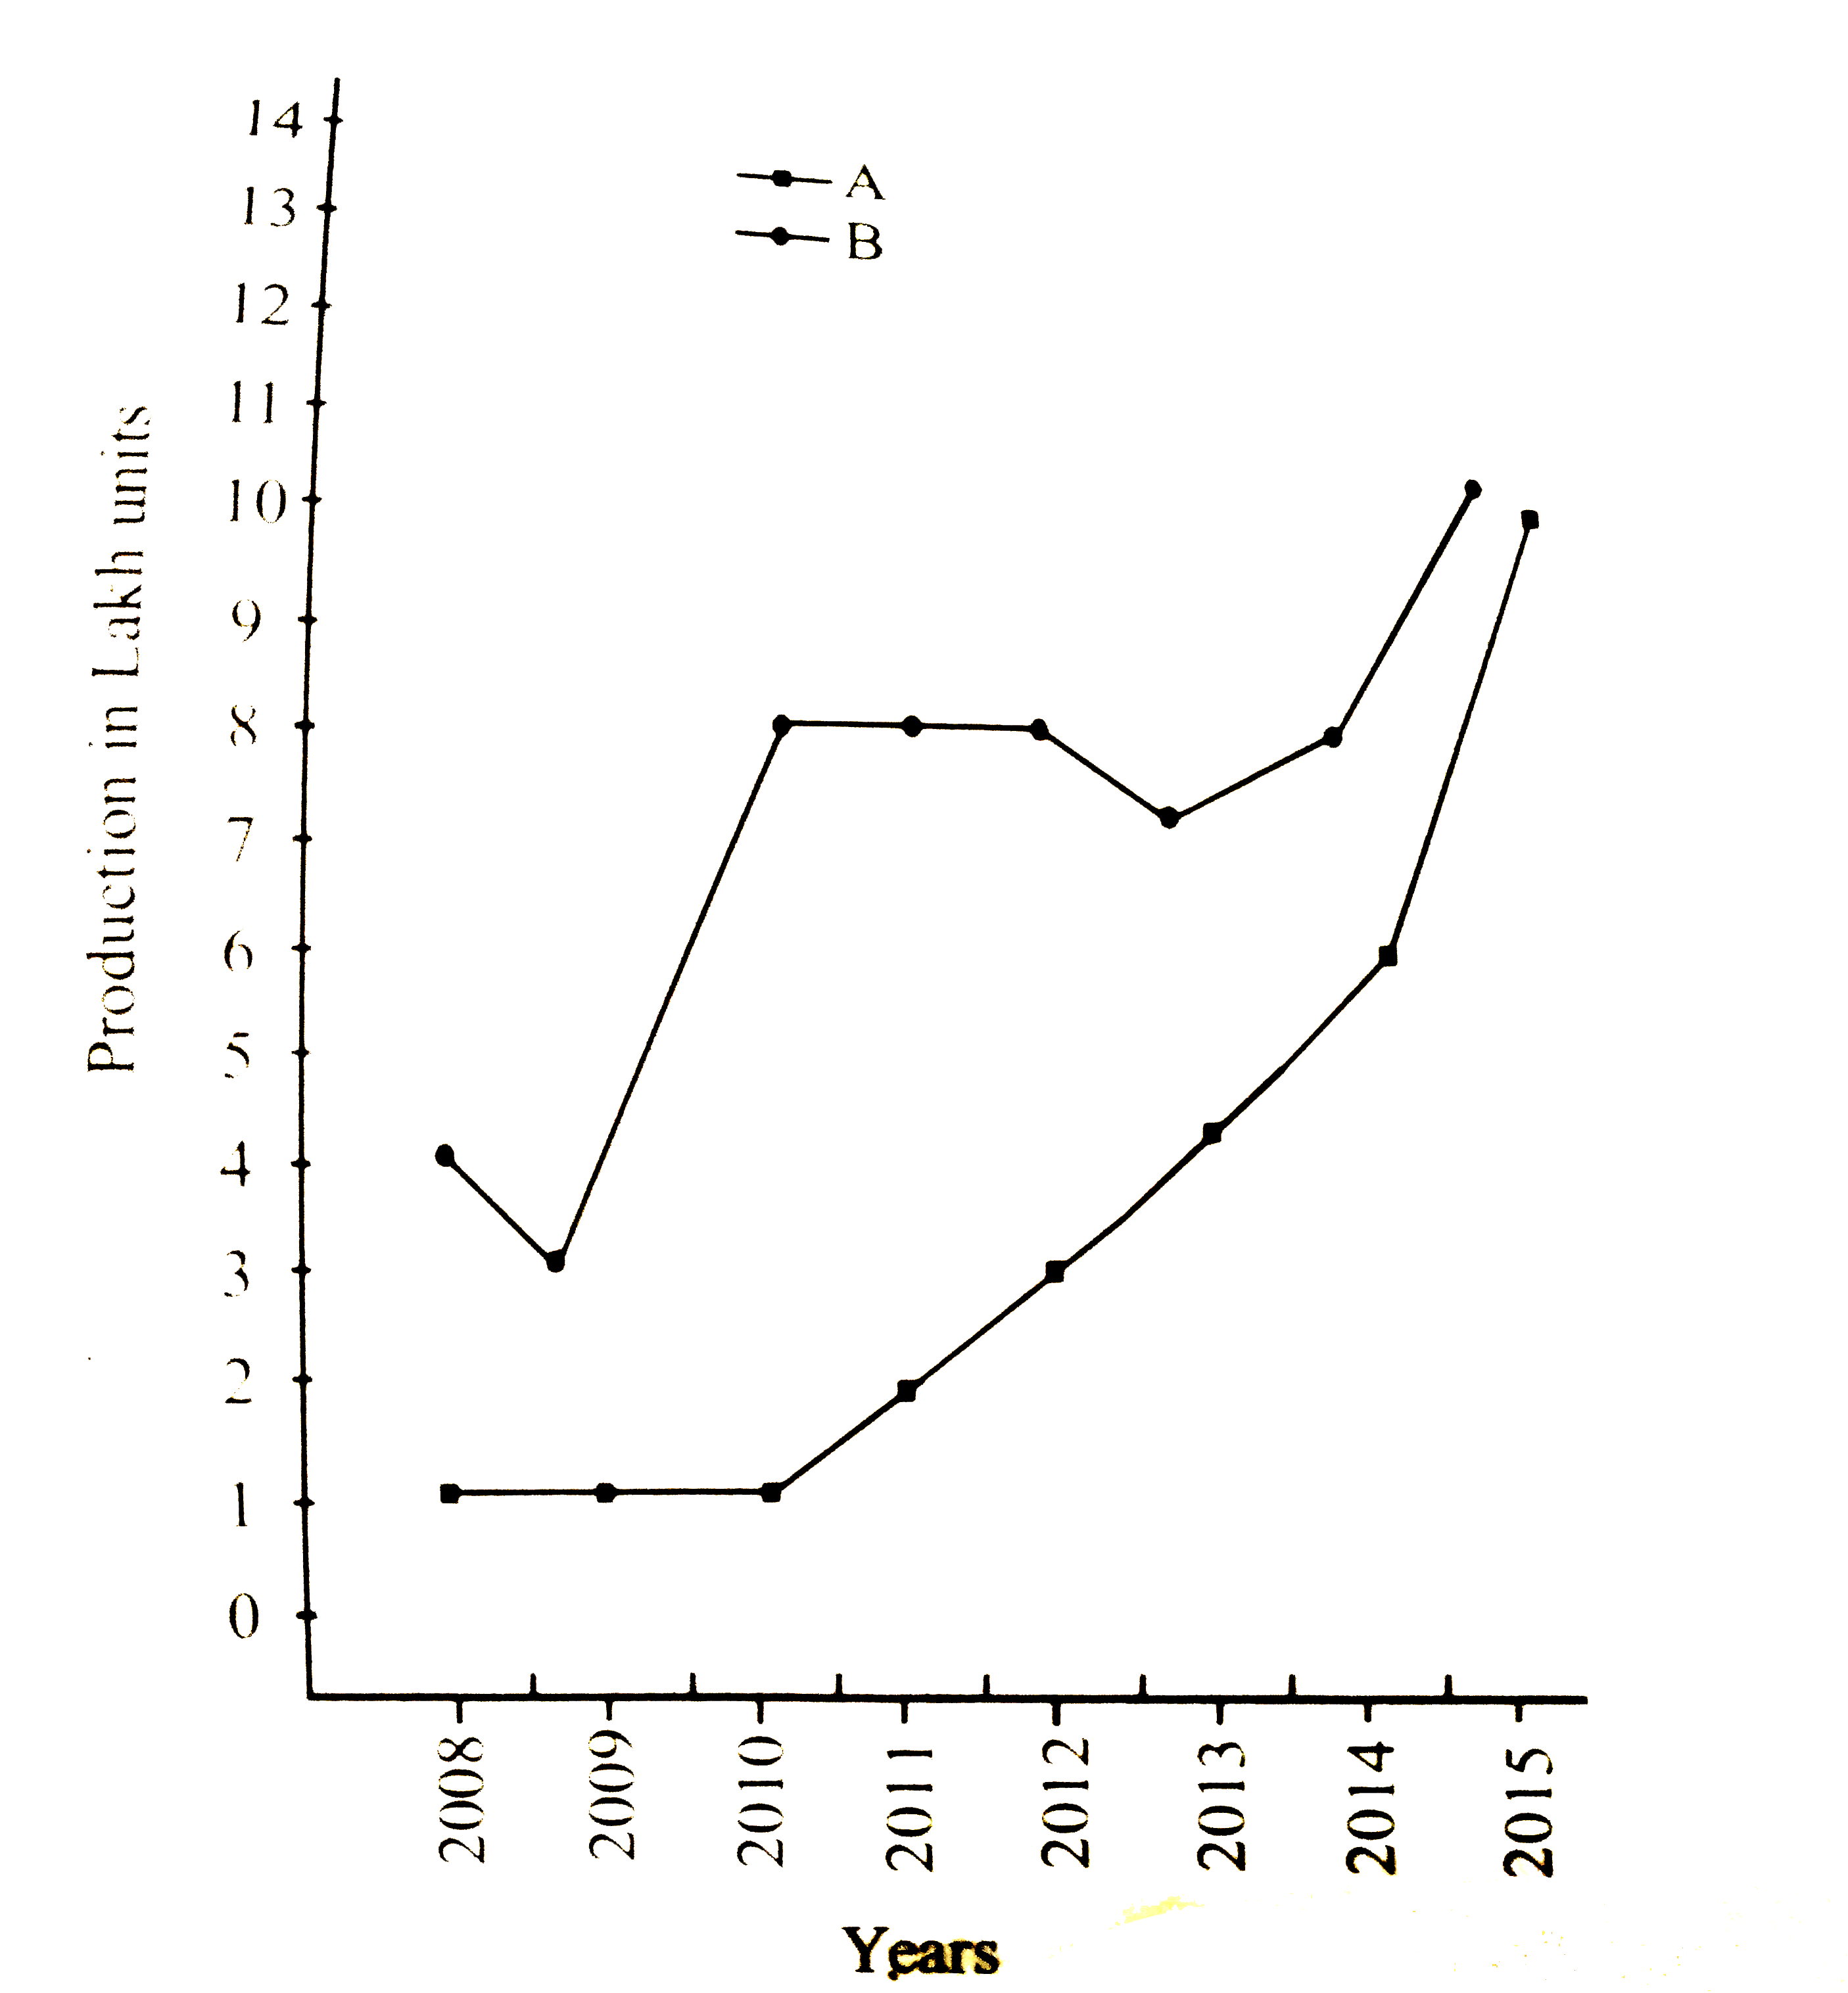
What was the percentage decrease in sale of cellular phones from 2009 to 2010 ?
a.15
b.23
c.25
d.none of these
To find the percentage decrease in the sale of cellular phones from 2009 to 2010, we can follow these steps:
Step 1: Identify the sales figures for both years.
- Sales in 2009: 40
- Sales in 2010: 30
Step 2: Calculate the decrease in sales.
- Decrease in sales = Sales in 2009 - Sales in 2010
- Decrease = 40 - 30 = 10
Step 3: Calculate the percentage decrease.
- The formula for percentage decrease is:
Percentage Decrease=(DecreaseOriginal Value)×100
- Here, the original value is the sales in 2009 (40).
- Plugging in the values:
Percentage Decrease=(1040)×100
Step 4: Simplify the calculation.
- 1040=0.25
- Now, multiply by 100:
0.25×100=25
Step 5: State the final answer.
- The percentage decrease in the sale of cellular phones from 2009 to 2010 is 25%.
- Sales in 2009: 40
- Sales in 2010: 30
- Decrease in sales = Sales in 2009 - Sales in 2010
- Decrease = 40 - 30 = 10
- The formula for percentage decrease is:
Percentage Decrease=(DecreaseOriginal Value)×100
- Here, the original value is the sales in 2009 (40).
- Plugging in the values:
Percentage Decrease=(1040)×100
- 1040=0.25
- Now, multiply by 100:
0.25×100=25
- The percentage decrease in the sale of cellular phones from 2009 to 2010 is 25%.
Topper's Solved these Questions
- LINE GRAPHBOOK - ARIHANT SSCCHAPTER - LINE GRAPHEXERCISE - FAST TRACK PRACTICE
43 Videos
- INDICES AND SURDSBOOK - ARIHANT SSCCHAPTER - INDICES AND SURDSEXERCISE - HIGHER SKILL LEVEL QUESTIONS
17 Videos
- LINEAR EQUATIONSBOOK - ARIHANT SSCCHAPTER - LINEAR EQUATIONSEXERCISE - Higher Skill Level Questions
7 Videos
Similar Questions
Knowledge Check
The bar chart given below shows the sales (in crores) of 2 companies A and B from years 2010 to 2015.
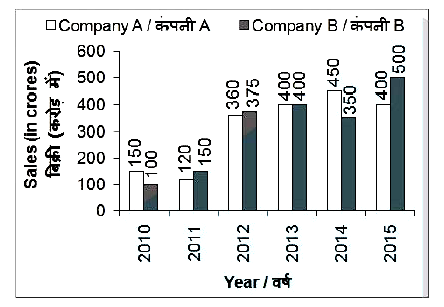
What is the percentage change in sale of company B from years 2011 to 2012?A100B225C150D125The line chart given blow represents the sales (in 00) of trousers ans shirts for five months.
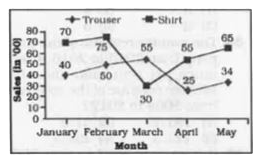
What is the percentage increase in the sales of the trousers from January to February?A25B20C10D28Read the following table carefully and answer the questions given below :
The percentage change in sales of six departmental stores from 2010 to 2012 is shown in the following table :
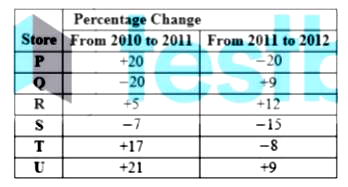
In 2012 which of the sotres had greater sales than any other stores ?
A. R
B. P
C. T
D. QADBCCADB
The bar chart given below shows the sales (in crores ) of company P from years 2009 to 2015 .
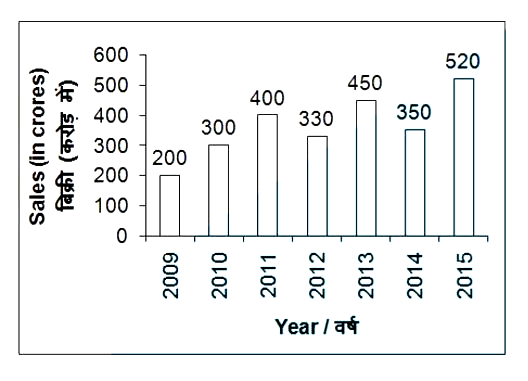
What is the percentage change in the sale from year 2009 to 2013?
View SolutionThe line chart given below shows the sales (in crores) of a company for the years 2009 to 2016
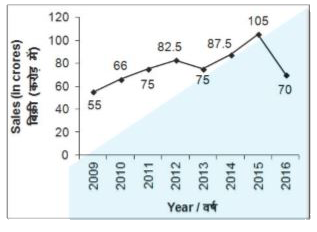
What is the percentage change in the company sales from year 2014 to year 2016?
View SolutionThe bar chart given below shows the sales (in '000 units) of 4 mobile brands for 3 years.
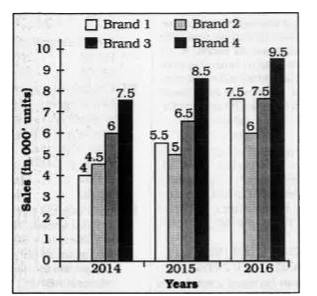
What is the percentage increase in the number of mobile phones of Brand 2 sold from 2014 to 2015?
View SolutionThe bar chart given below shows the sales (in '000 units) of 4 mobile brands for 3 years.
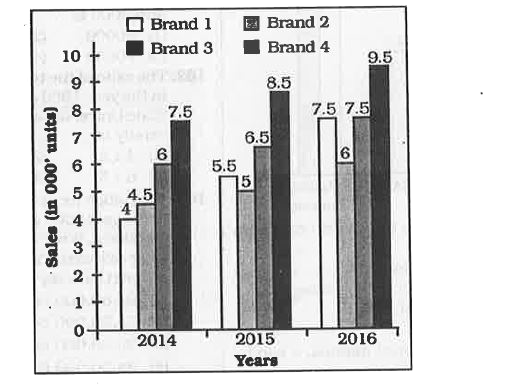
What is the percentage increase in the number of mobile phones of Brand 2 sold from 2014 to 2015?
View SolutionThe following graph shows production (in thousands) of two types (P and Q) of vehicles by a factory over the years 2009 to 2014. Study the graph and answer the given questions.
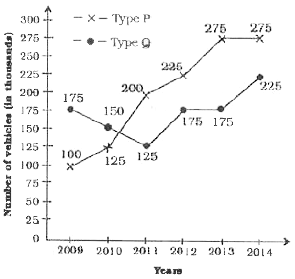
Approximate percentage decrease in production of Type Q vehicles from 2010 to 2011 is
View Solution

