The following table gives the sales details of the books for CAT written by Sarvesh :
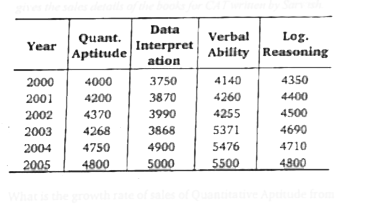
Which of the categories shows the lowest growth rate from 2000 to 2005 ?
Q.A
DI
VA
LR
The correct Answer is:D
Step by step video, text & image solution for The following table gives the sales details of the books for CAT written by Sarvesh : Which of the categories shows the lowest growth rate from 2000 to 2005 ? by Maths experts to help you in doubts & scoring excellent marks in Class 14 exams.
Updated on:21/07/2023Topper's Solved these Questions
- PERCENTAGESBOOK - ARIHANT SSCCHAPTER - PERCENTAGESEXERCISE - Exercise (Level - 2)
50 Videos
- PERCENTAGEBOOK - ARIHANT SSCCHAPTER - PERCENTAGEEXERCISE - Higher Skill Level Questions
27 Videos
- PERMUTATIONS & COMBINATIONS BOOK - ARIHANT SSCCHAPTER - PERMUTATIONS & COMBINATIONS EXERCISE - FINAL ROUND
38 Videos
Similar Questions
The following table represents the category wise count of books in four local libraries.
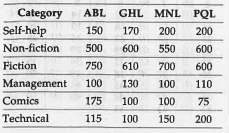
Which library has the highest total count of books?
View SolutionThe following table gives the number of pages written by Saria for completing her own book for 30 days.

Find the mean number of pages written per day.
View Solution
Knowledge Check
The following table gives the sales details of the books for CAT written by Sarvesh :

Which of the categories shows the lowest growth rate from 2000 to 2005 ?AQABDICVADLRThe following table gives the sales details of the books for CAT written by Sarvesh :
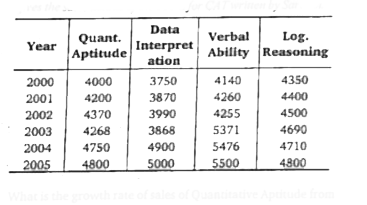
Which category had the highest growth rate in the period ?AQABDICVADLRThe following table gives the sales details of the books for CAT written by Sarvesh :
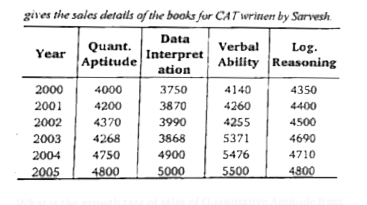
Which of the categories had either a consistent growth or consistent decline in the period shown ?AQABDICVADLR
The following table gives the sales details of the books for CAT written by Sarvesh :
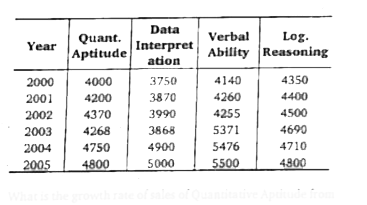
What is the growth rate of sales of Quantitative Aptitude from 2000 to 2005 ?
View SolutionThe following table gives the sales details of the books for CAT written by Sarvesh :

What is the growth rate of sales of Quantitative Aptitude from 2000 to 2005 ?
View SolutionThe following table gives the details of five commodities A, B, C, D and E with the quantity required and their costs for a family in a month. Study the table and answer the questions that follow.
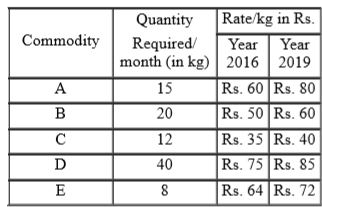
The percentage of increase (per kg) in the rate of commodity D from 2016 to 2019 is:
View SolutionAmong the following continents, which one has the - lowest growth rate of population ?
View SolutionStudy the following table carefully and answer the questions based on it.
The following table shows the domestic sales of cars of five manufacturers from 2005 to 2010.
(All the figures are in thousands)
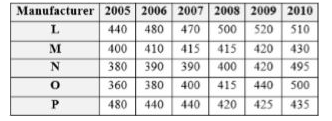
With respect to which of the following combinations, is the sales of cars the highest over the given period?
A. L. 2009
B. L, 2010
C. L, 2008
D. O, 2008
View Solution
