The oscillationof a body on a smooth horizontal surface is represented by the equation
x=Acosωt
where x= displacement at time t, ω= frequency of oscillation. Which one of the following graphs shows correctly the variation of acceleration a with time t ?


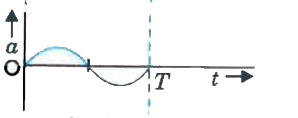
The correct Answer is:C
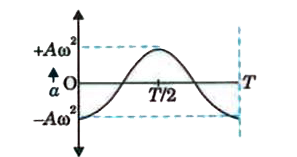
Acceleration, a=d2Xdt2=d2dt2(Acosωt)
a=−Aω2cosωt
t=0,a=−Aω2
At t=T2,a=−ω2cosω×T2=−Aω2cosπ
=+Aω2
At t=T,a=−ω2cos(2πT×T)=−Aω2
Topper's Solved these Questions
- BOOK - MODERN PUBLICATIONCHAPTER - OSCILLATIONS EXERCISE - Competition file (Multiple choice question) JEE (Main) & Other State Boards for Engineering Entrance25videos
OSCILLATIONS
- BOOK - MODERN PUBLICATIONCHAPTER - OSCILLATIONS EXERCISE - Competition File (JEE (Advanced) For IIT Entrance)7videos
OSCILLATIONS
- BOOK - MODERN PUBLICATIONCHAPTER - OSCILLATIONS EXERCISE - Competition File (Multiple choice questions)20videos
OSCILLATIONS
- BOOK - MODERN PUBLICATIONCHAPTER - MOTION IN A STRAIGHT LINE EXERCISE - CHAPTER PRACTICE TEST16videos
MOTION IN A STRAIGHT LINE
- BOOK - MODERN PUBLICATIONCHAPTER - PHYSICAL WORLD EXERCISE - Revision exercises (Long answer questions)6videos
PHYSICAL WORLD
Similar Questions
Knowledge Check
- Question 1 - Select One
The oscillation of a body on a smooth horizontal surface is represented by the equation, X=Acos(ωt)
where X = displacement at time t
ω = frequency of oscillation
Which one of the following graphs shows correctly the variation a with t ?A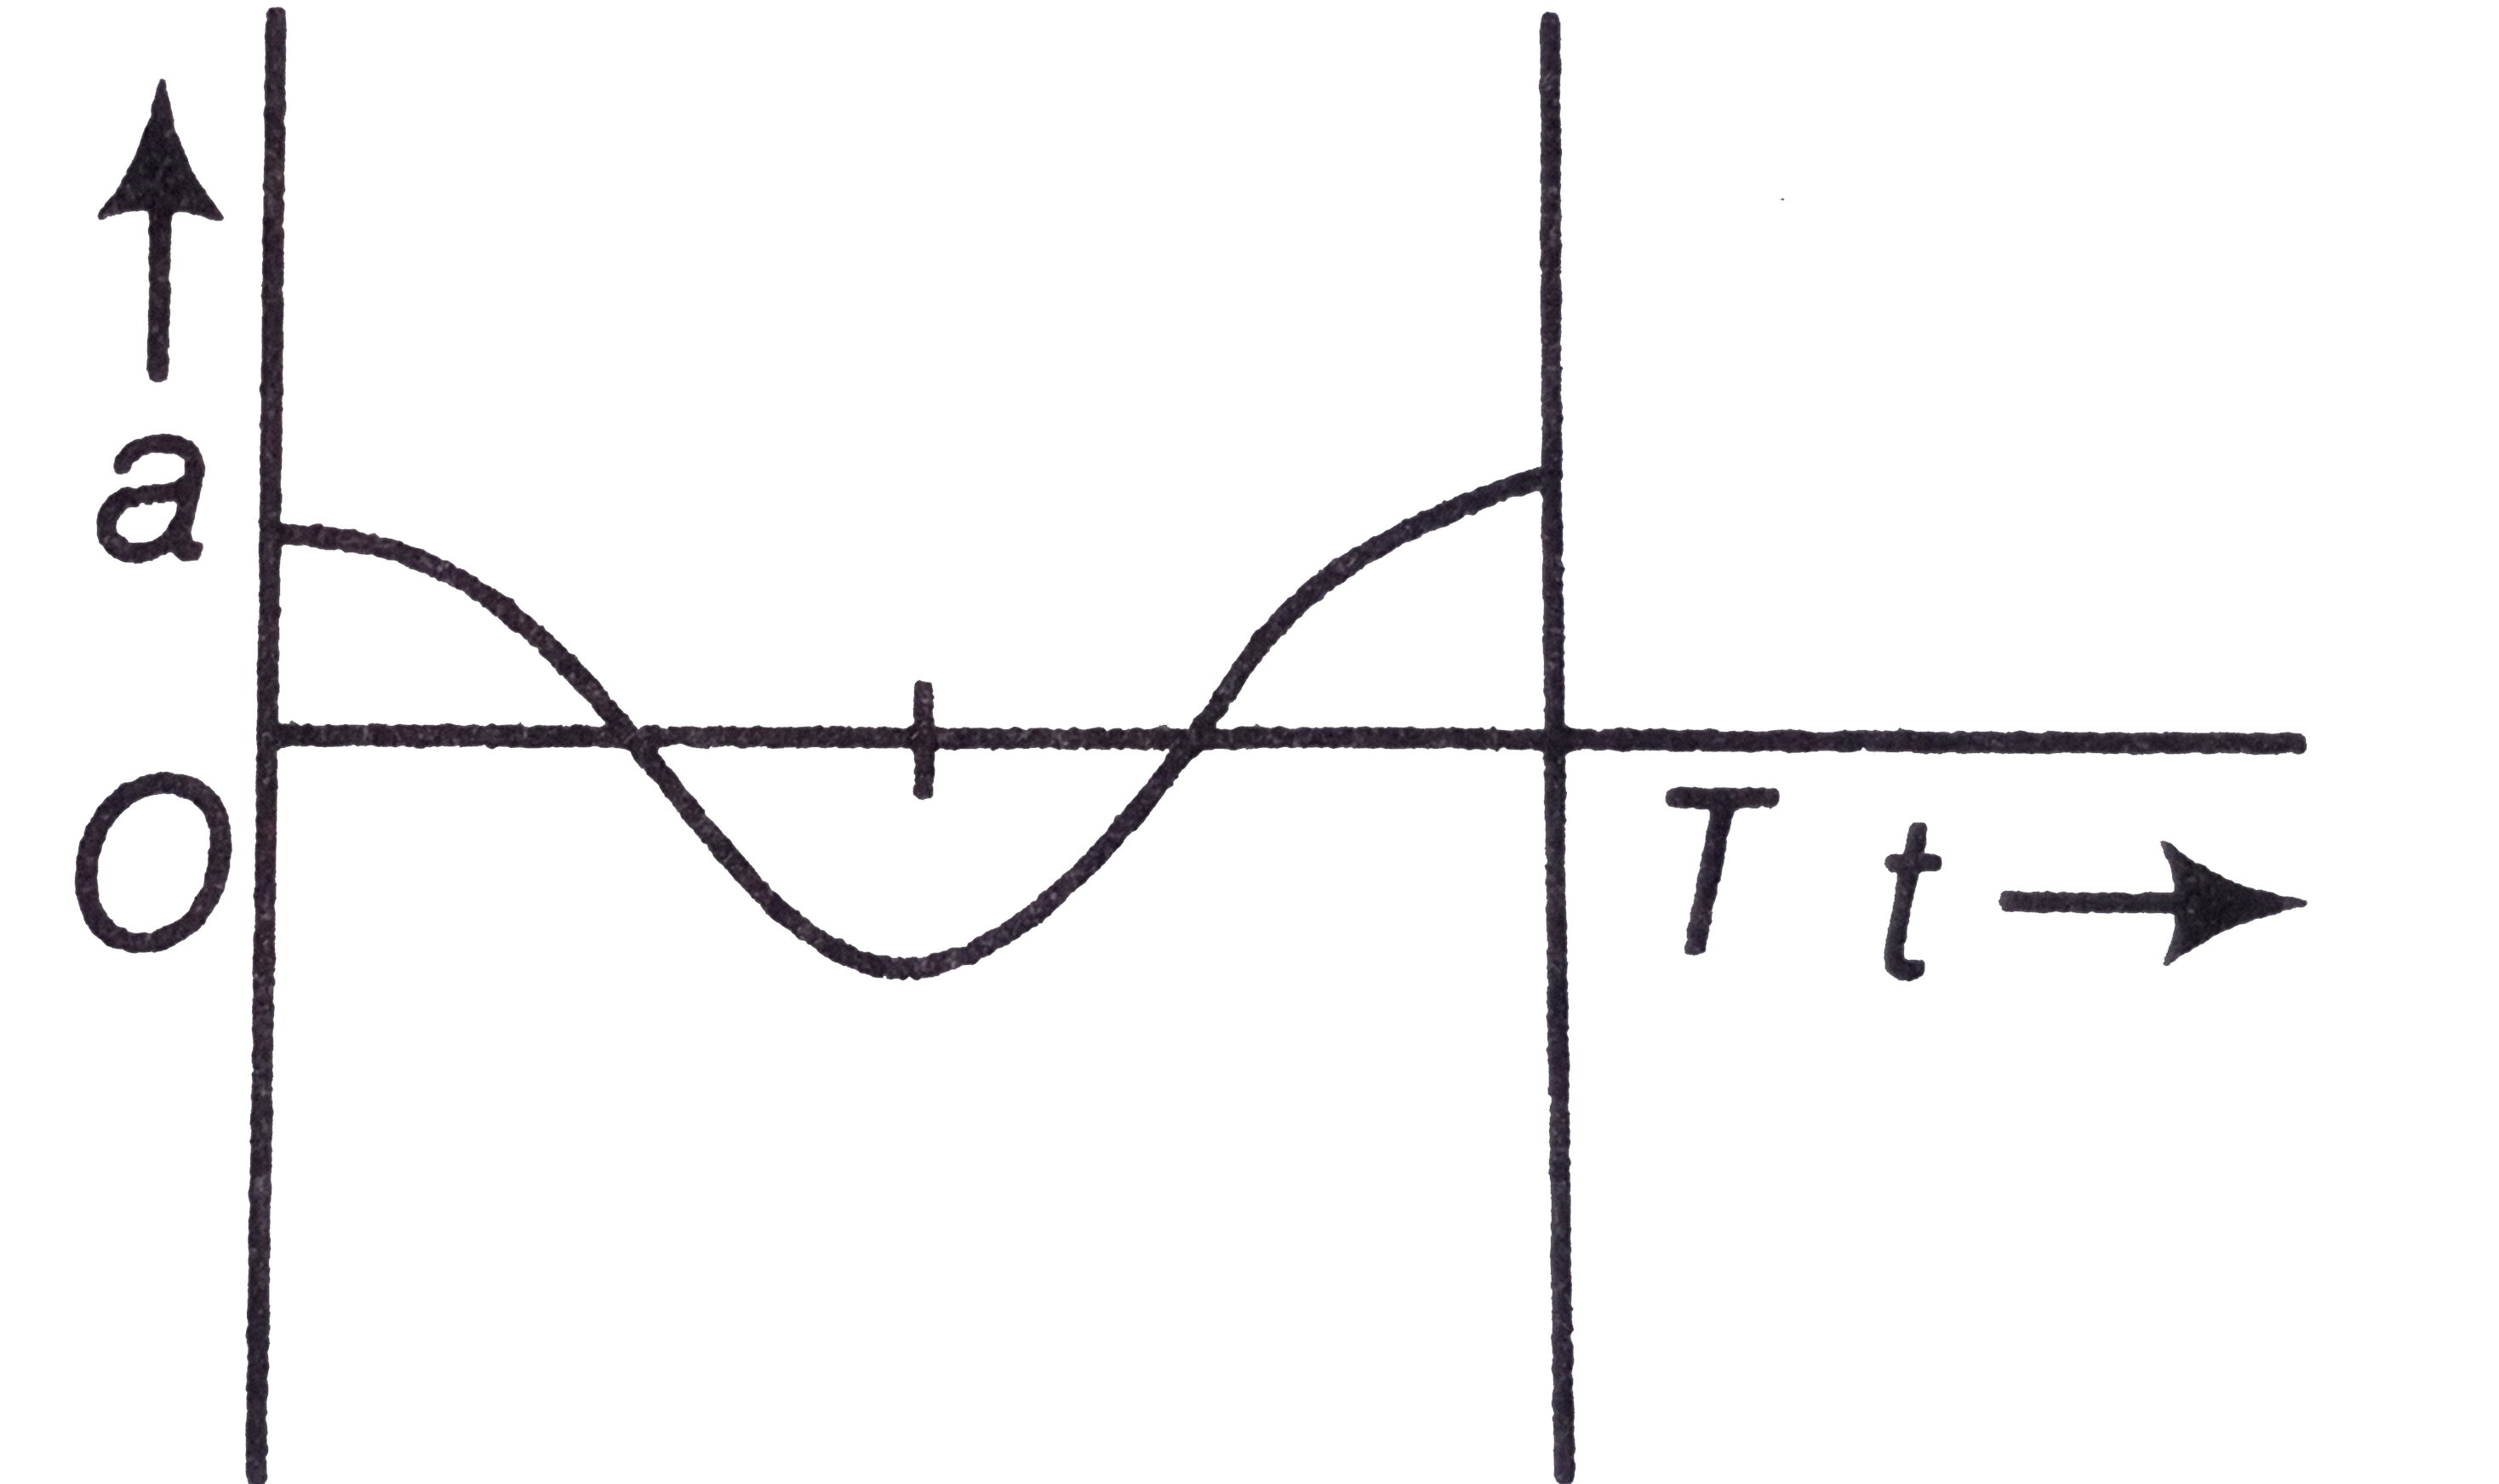 B
B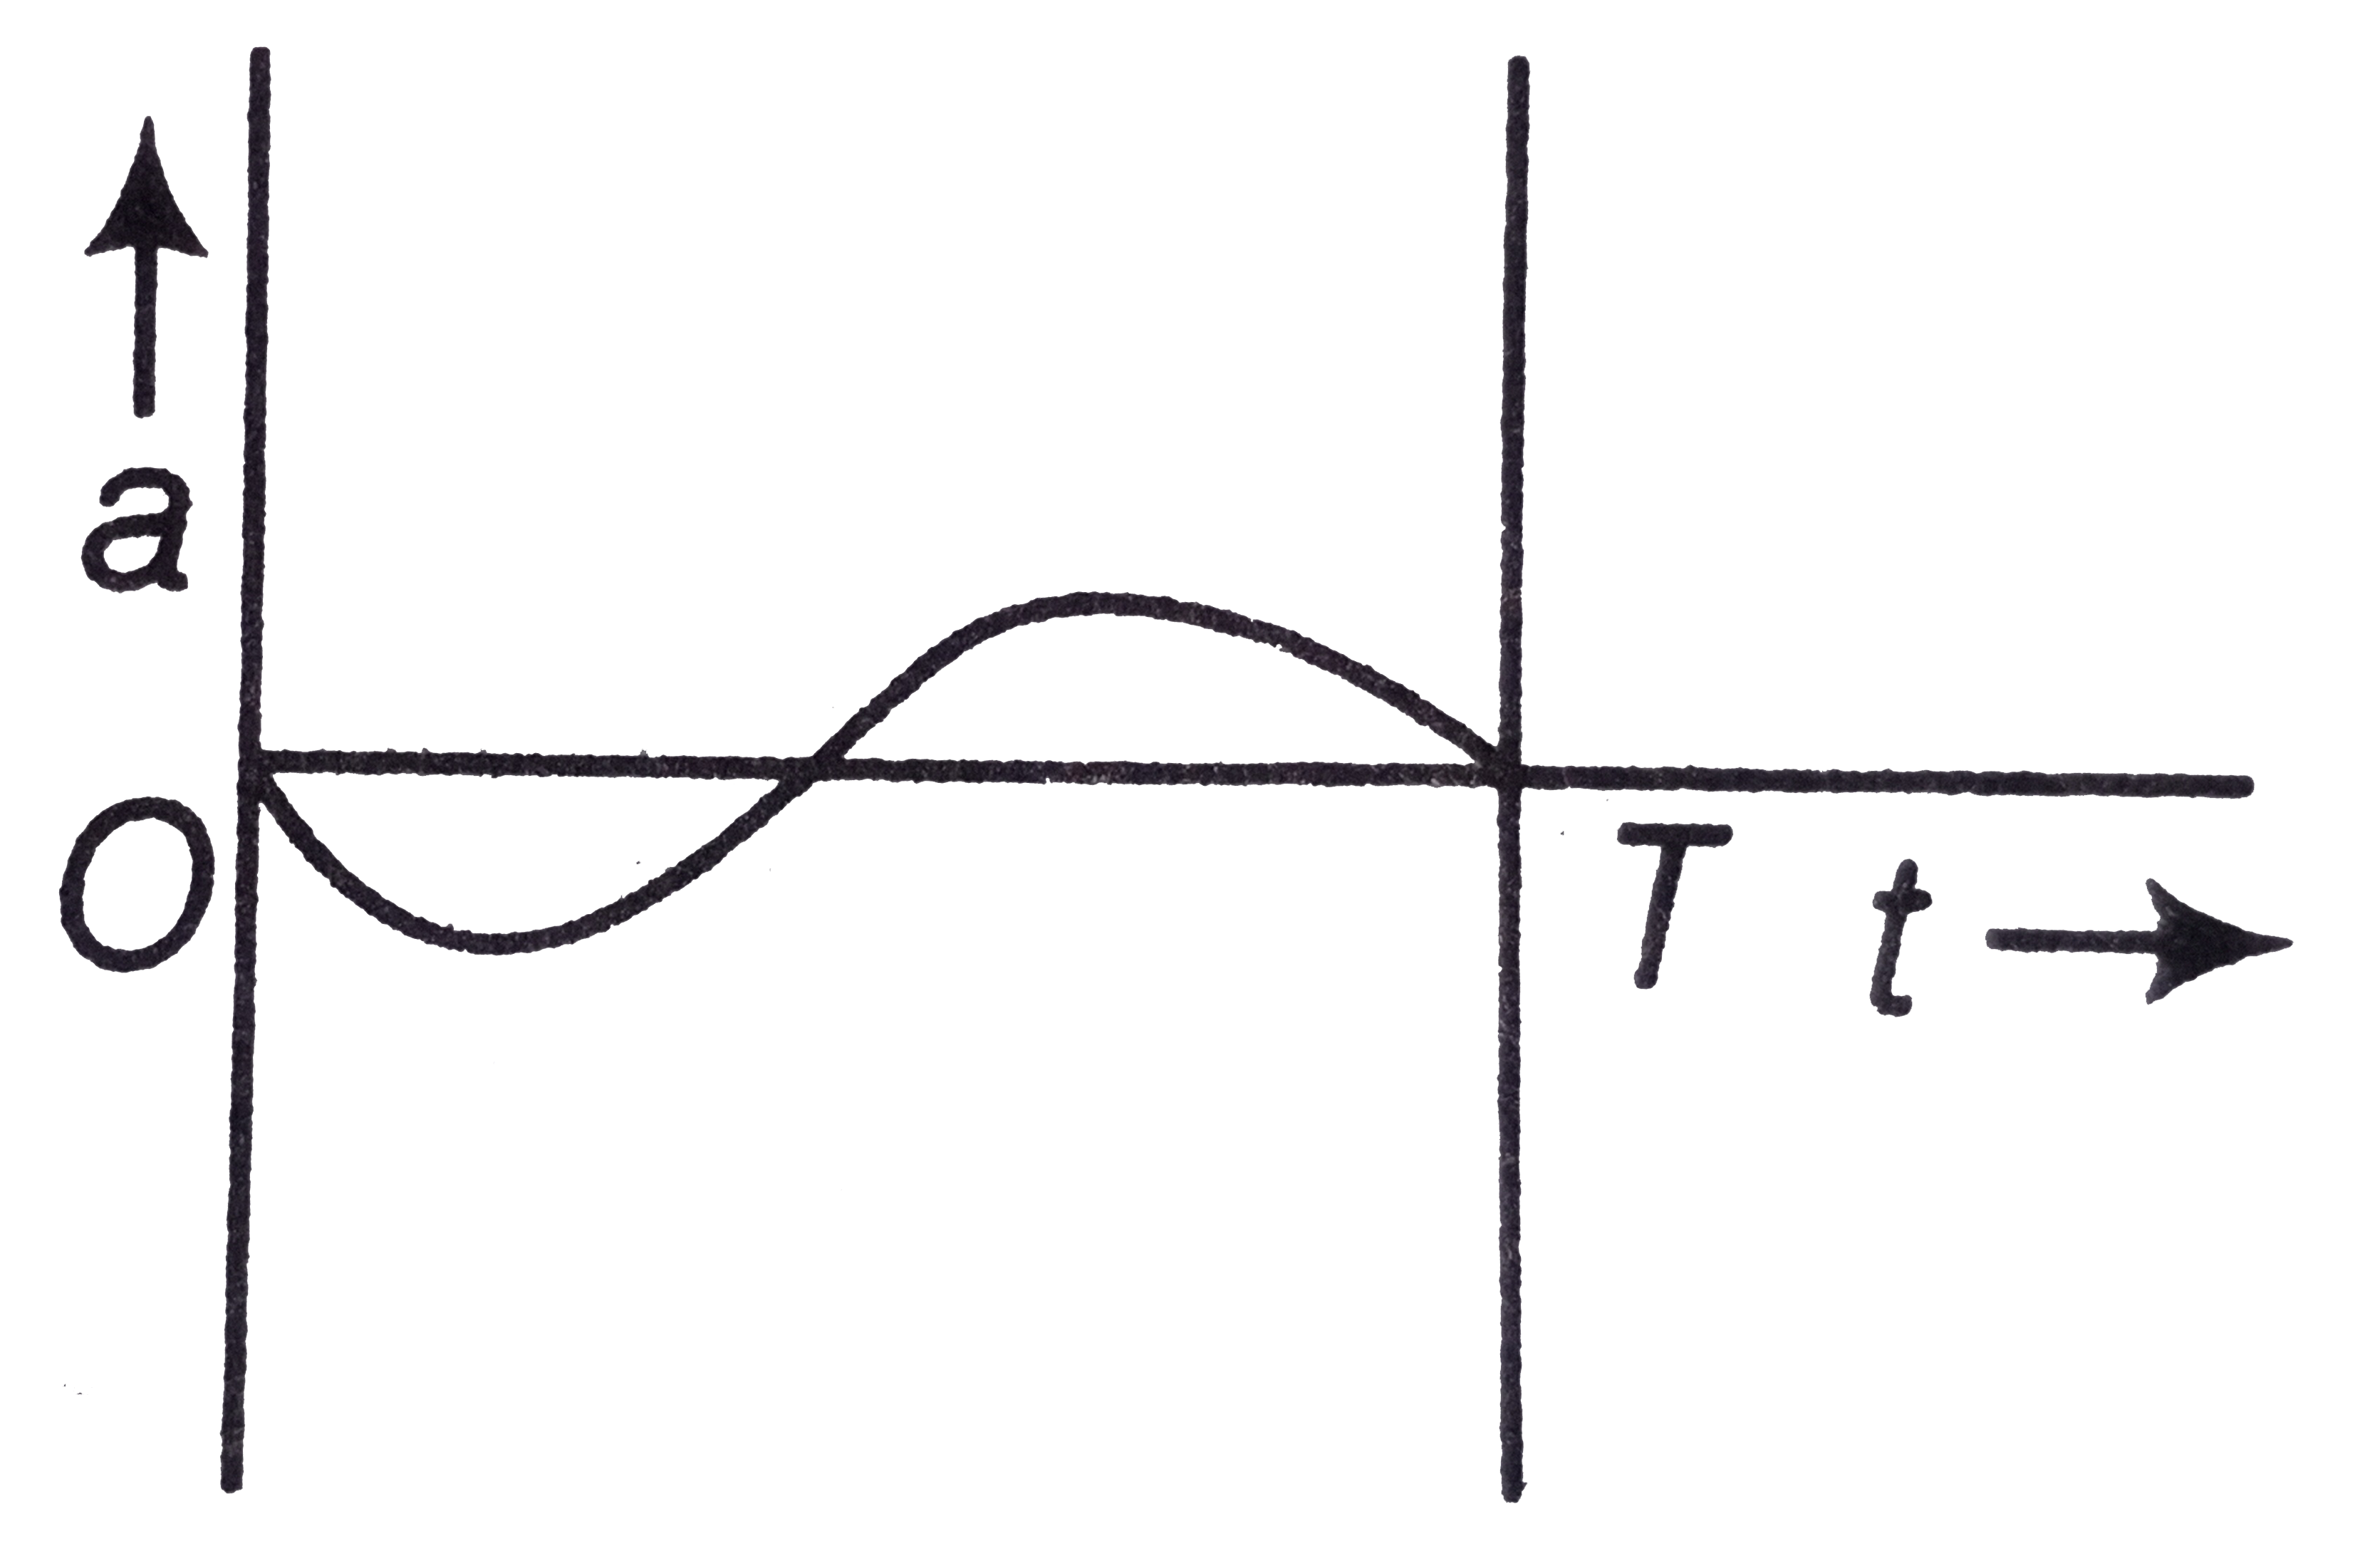 C
C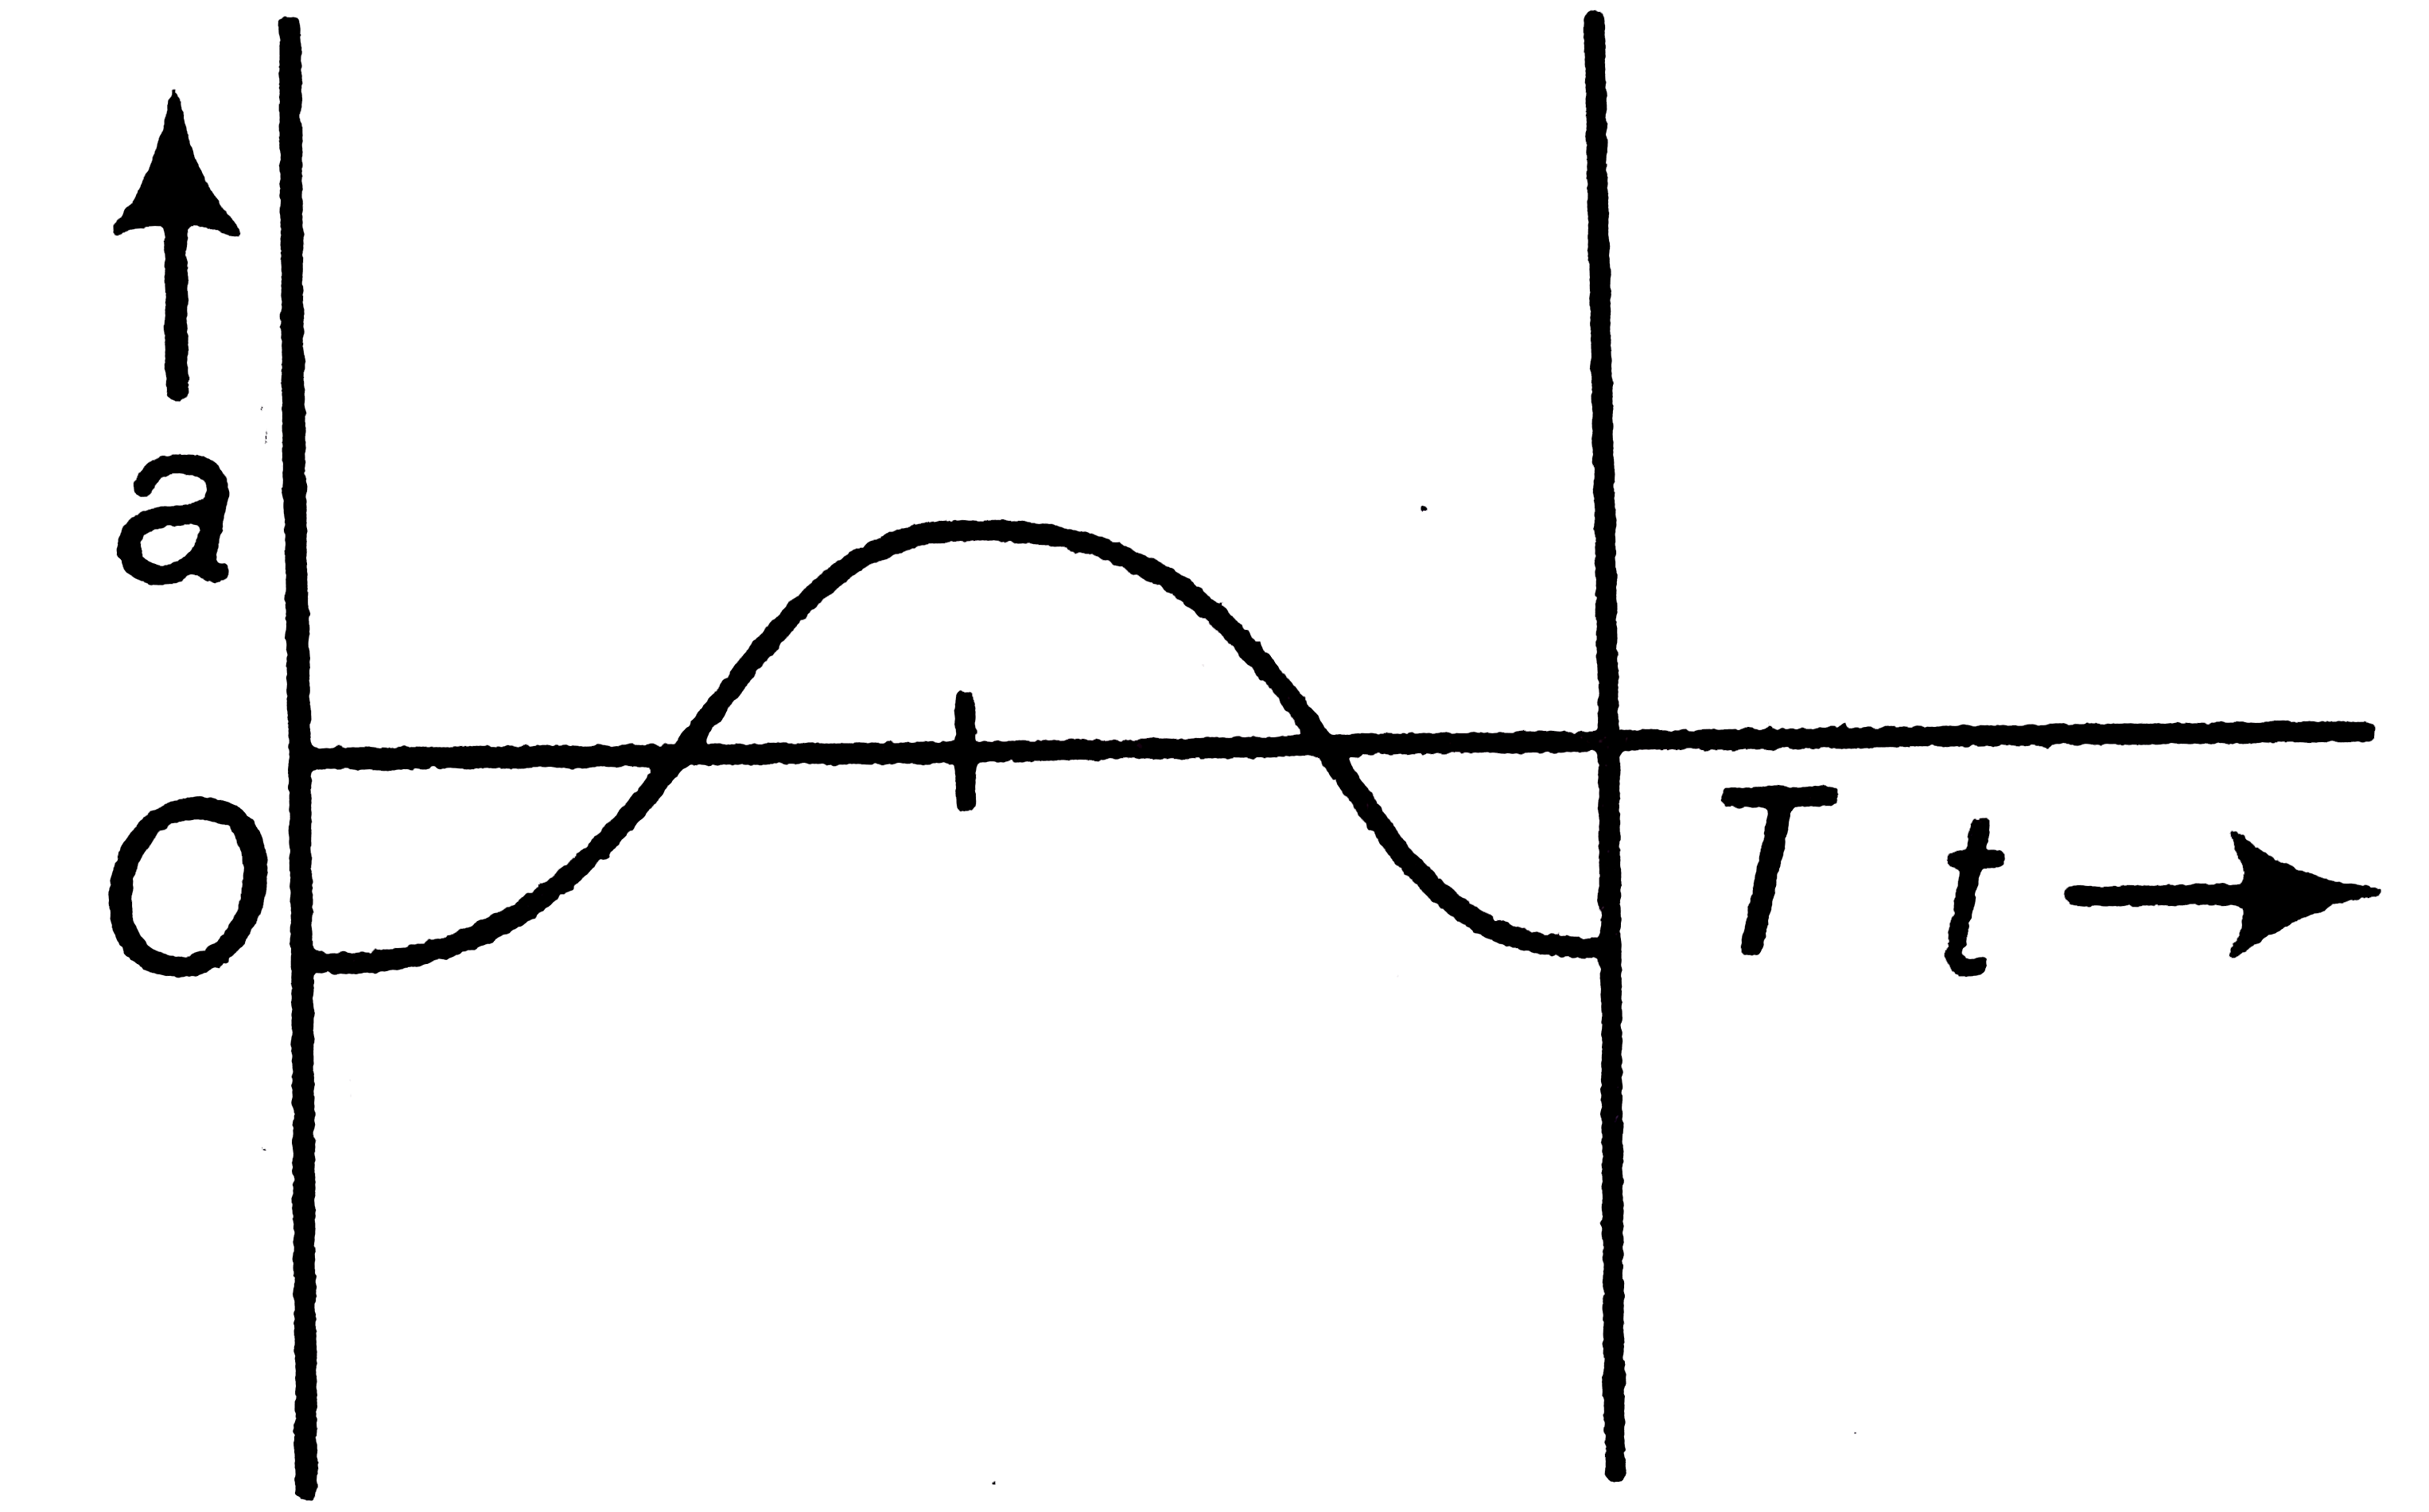 D
D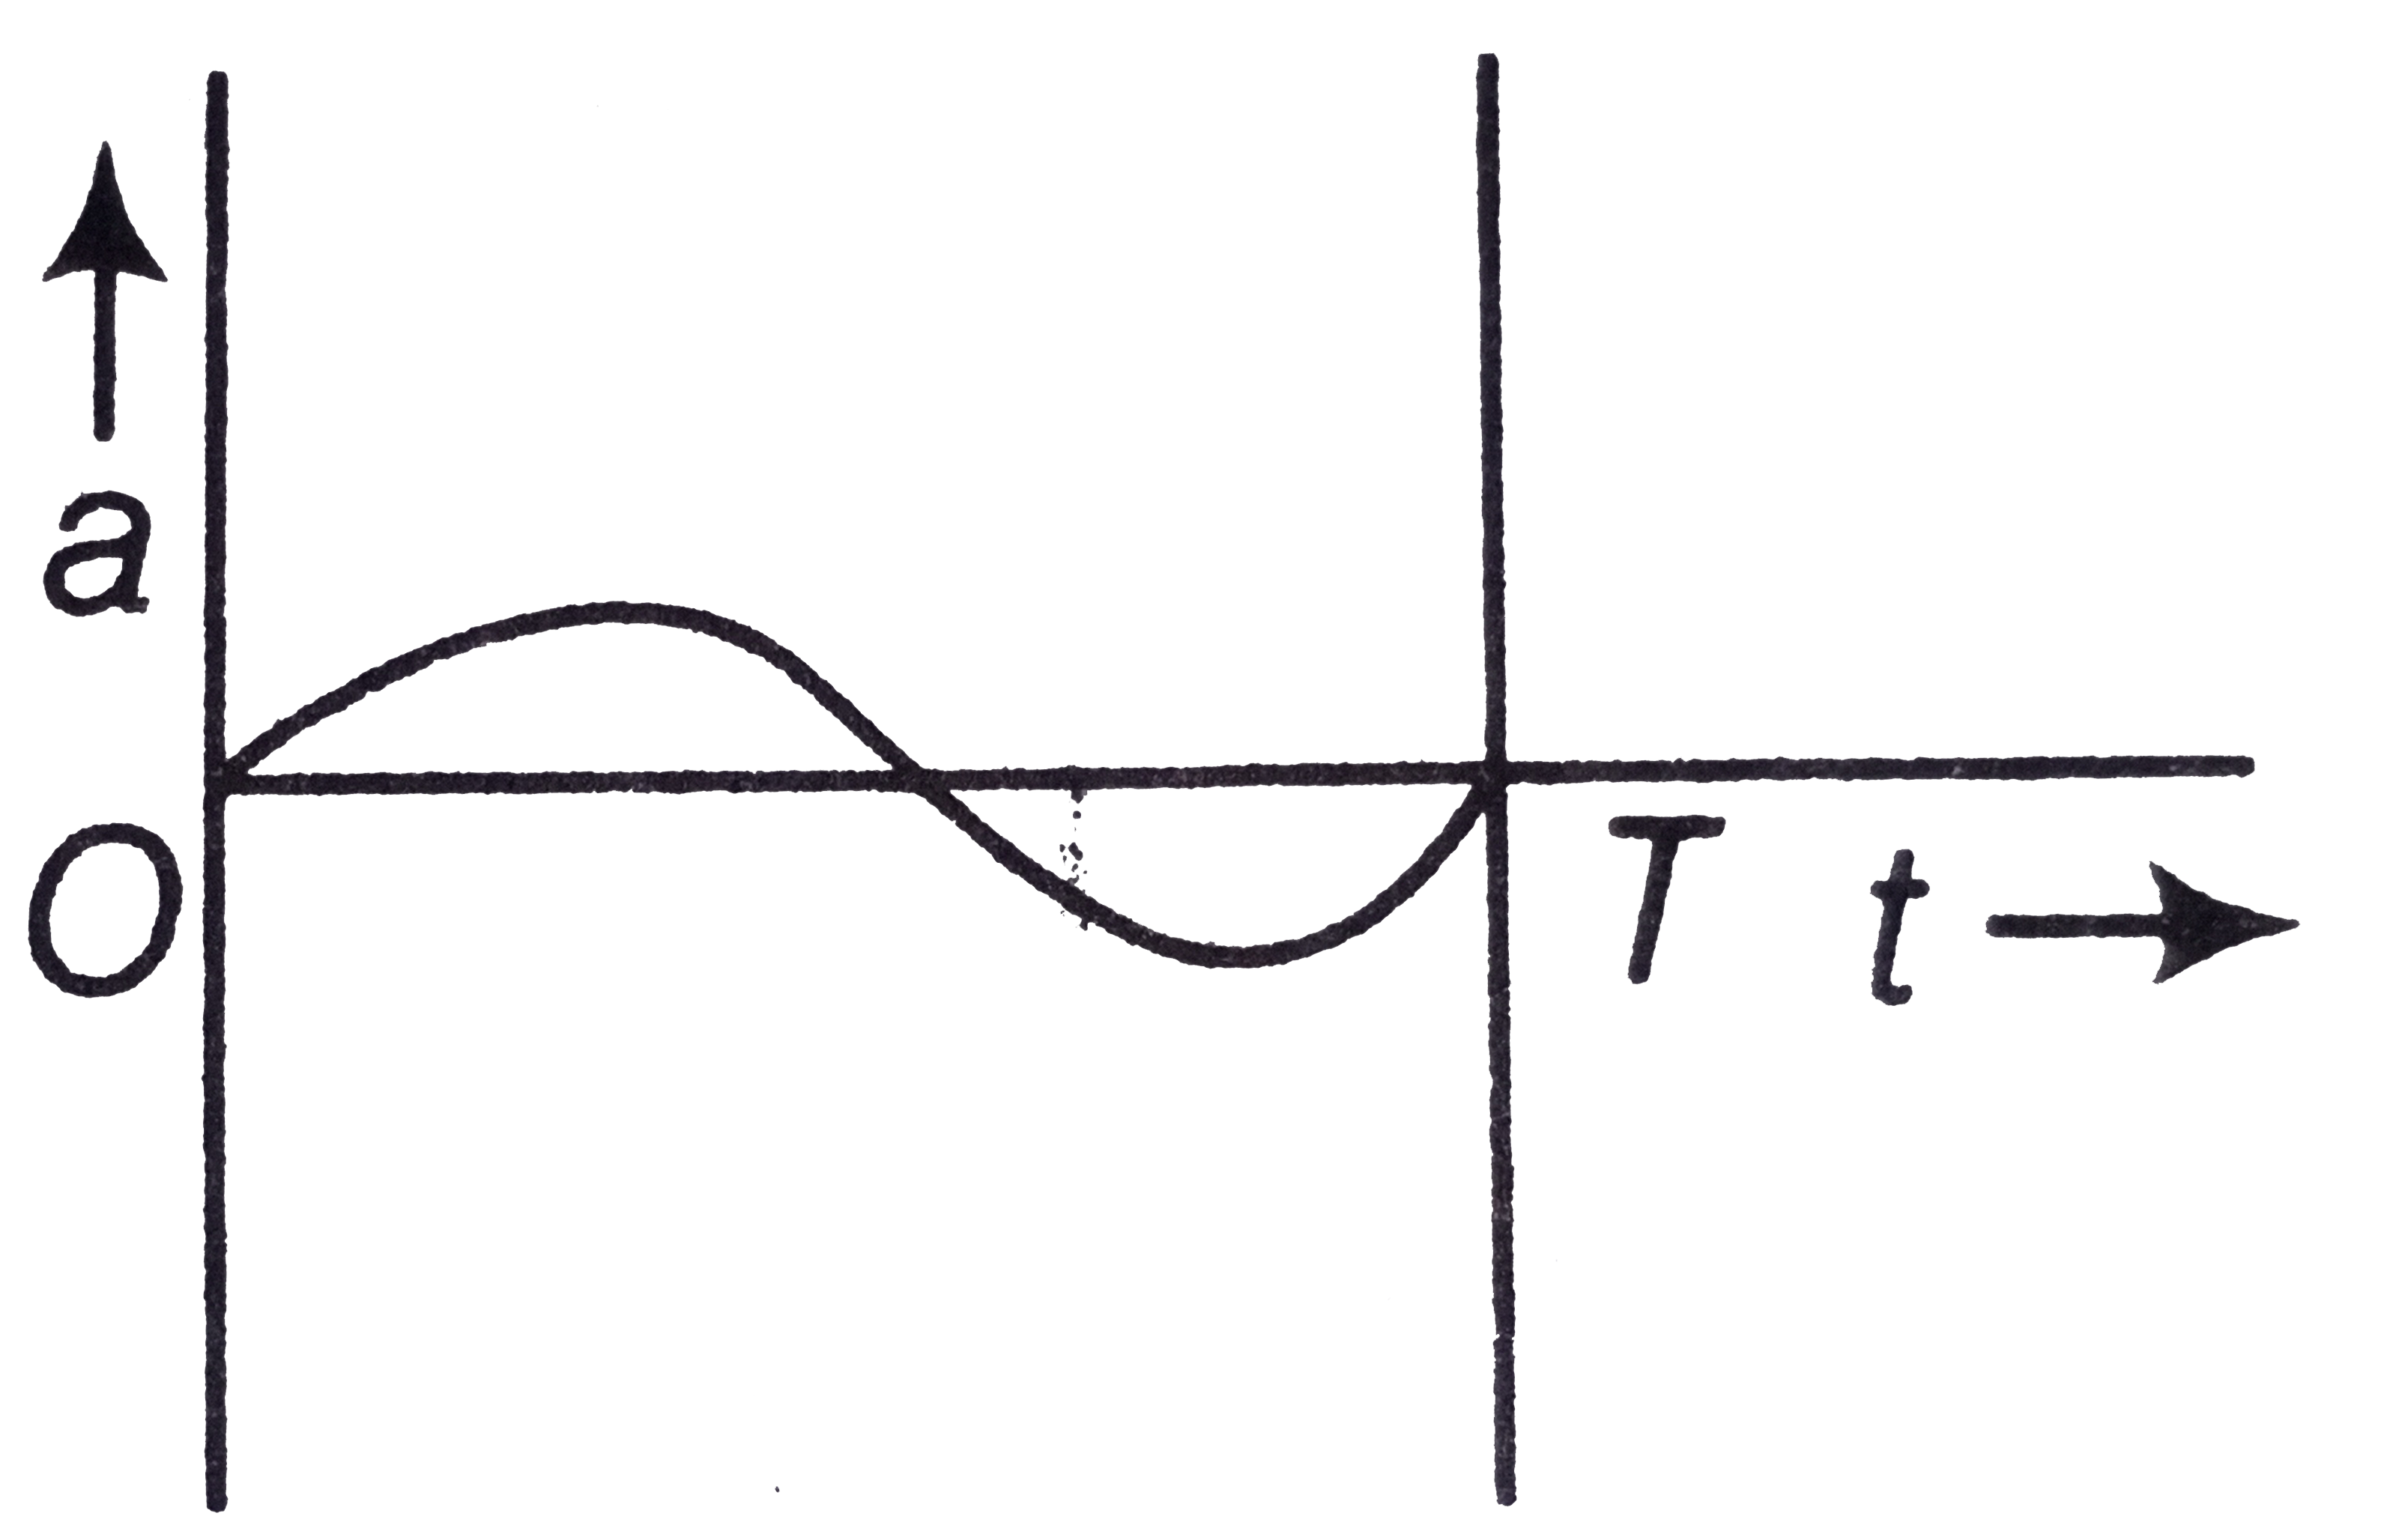
- Question 2 - Select One
The oscillation of a body on a smooth horizontal surface is represented by the equation,
X=Acos(ωt)
where, X = displacement at time t
ω= frequency of oscillation
Which one of the following graphs shows correctly the variation a with t?
Here, a = acceleration at time t
T = time periodA B
B C
C D
D
- Question 3 - Select One
Which of the following graphs best represents the variation of acceleration 'a' with displacement x?
A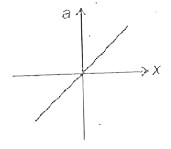 B
B C
C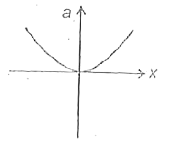 D
D
The oscillation of a body on a smooth horizontal surface is represented by the equation
X=Acos(ωt)
which one of the following graph shown correctly the variation a with t?View SolutionThe graph shown the variation with times t of the velocity v of an object . Which one of the following graphs best represents the variation of acceleration a of the object with time t?
 View Solution
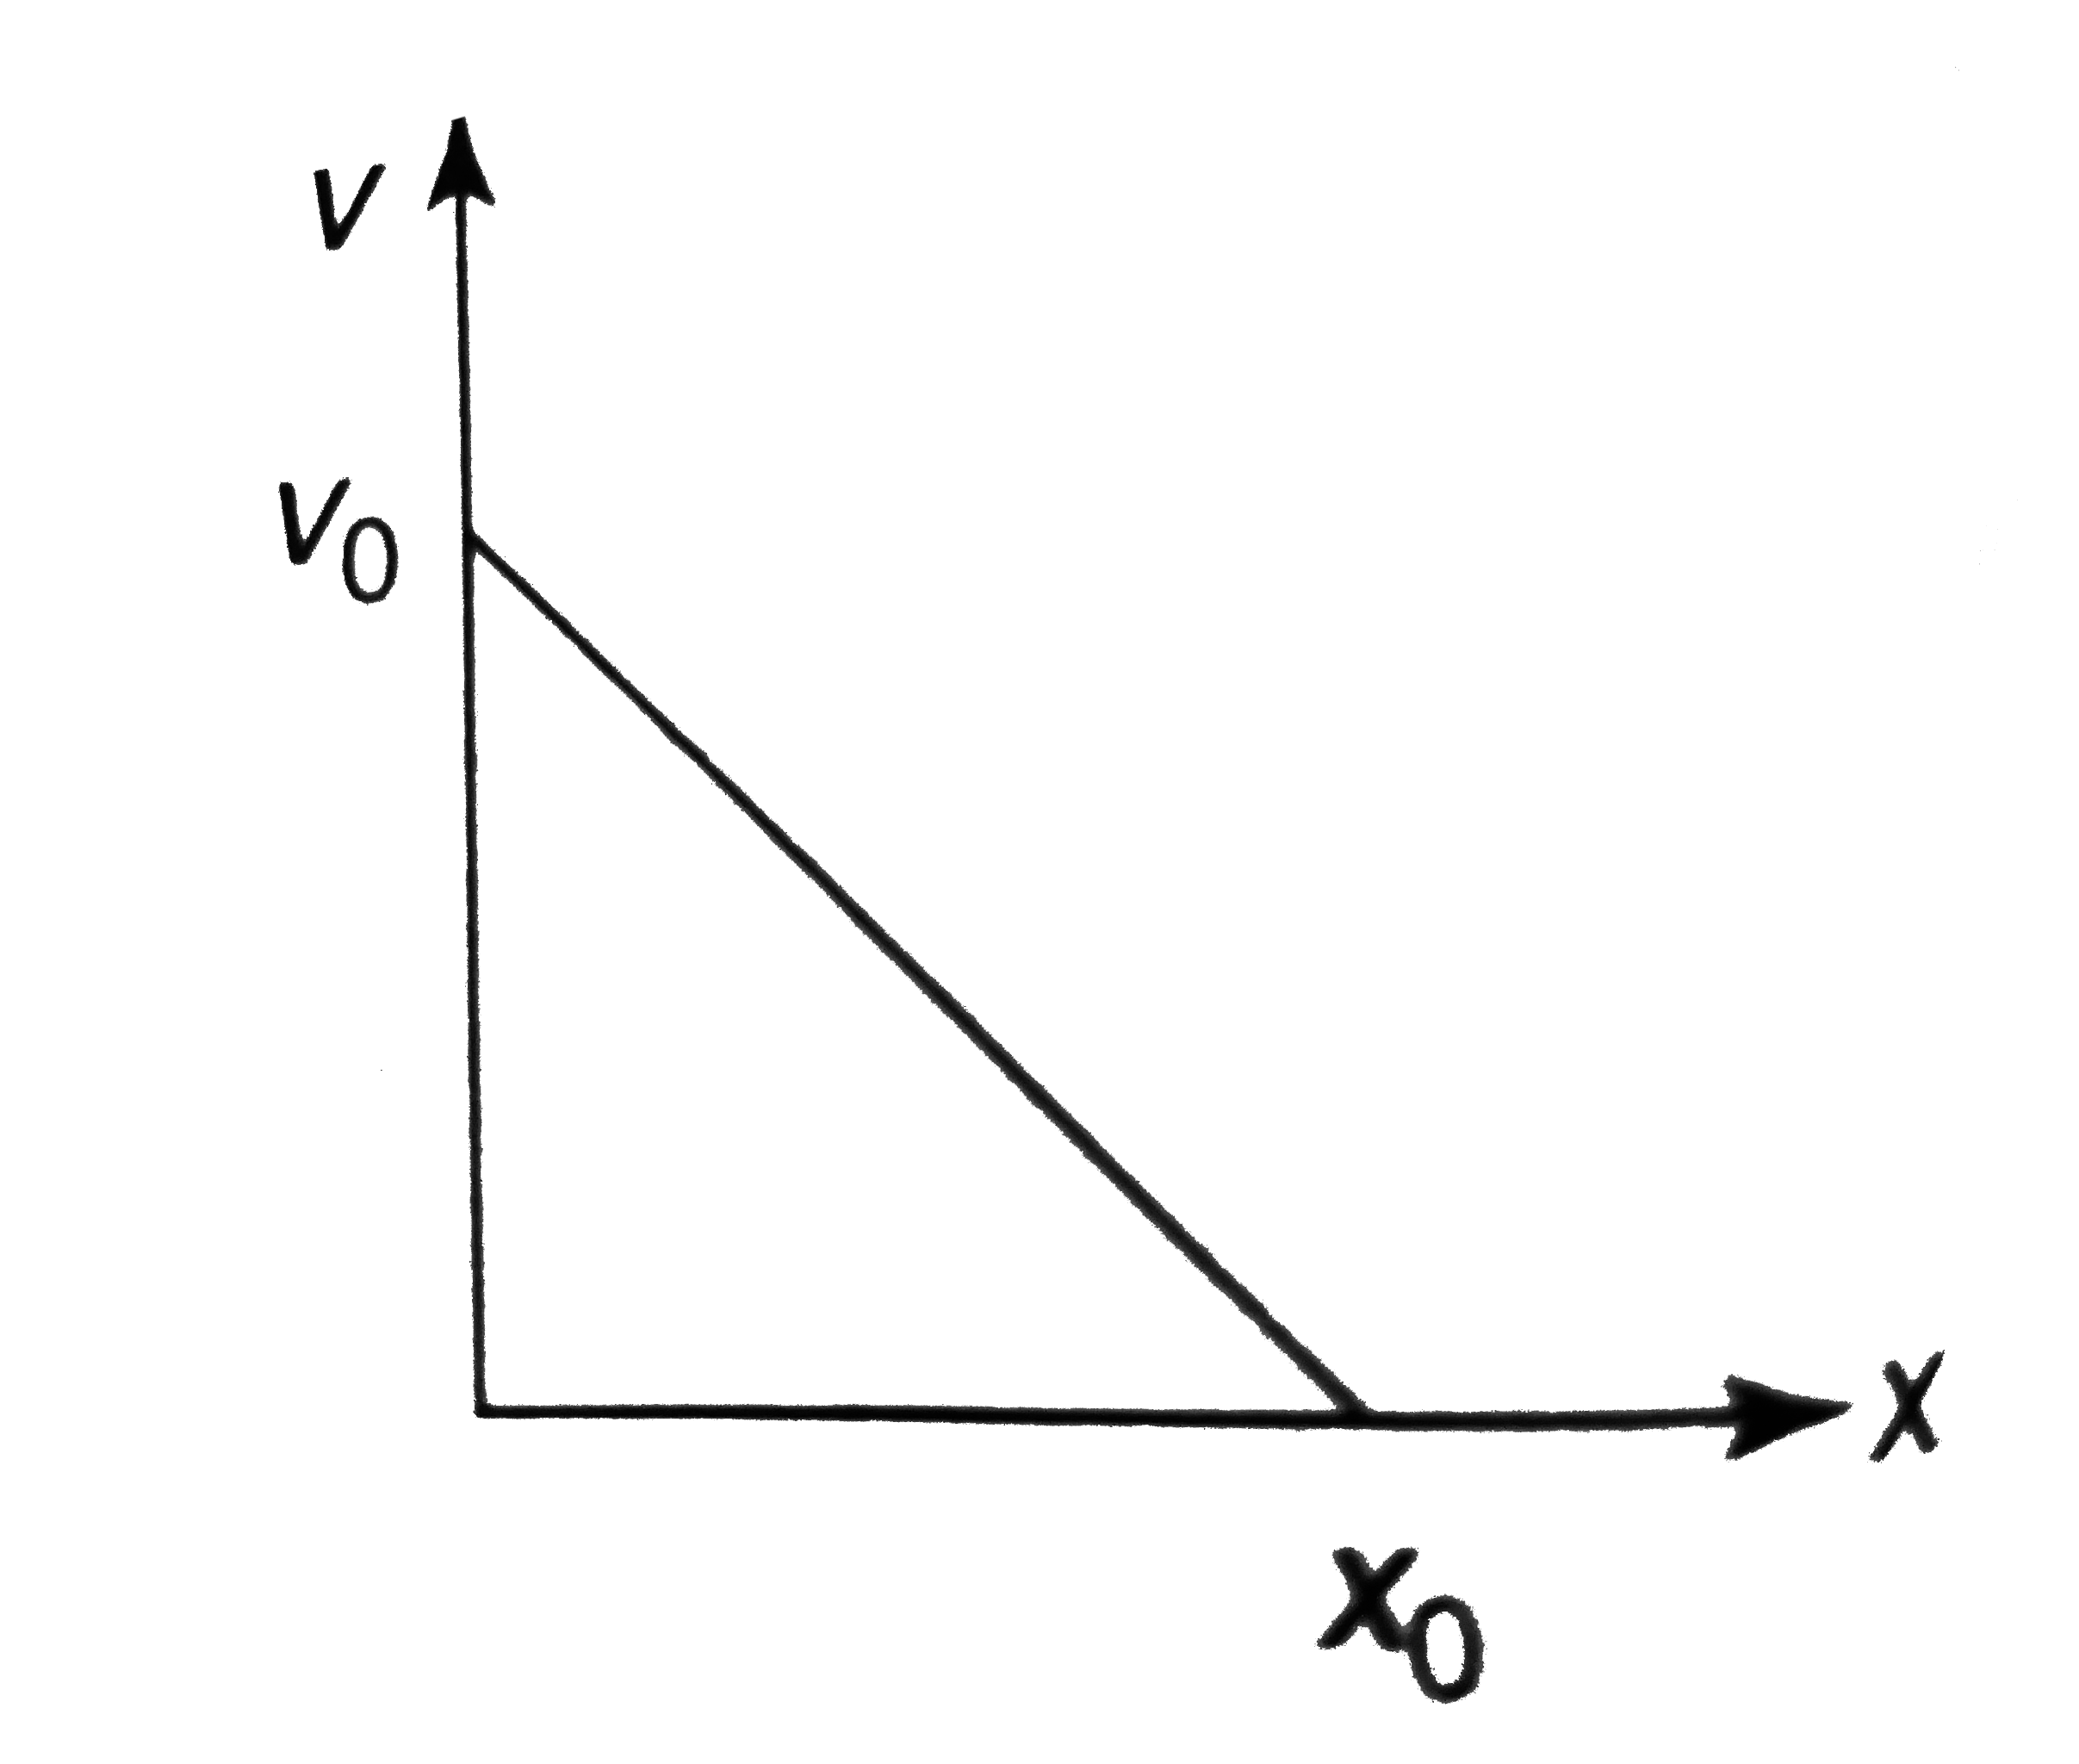
The velocity -displacement graph of a particle is as shown in the figure. Which of the following graphs correctly represents the variation of acceleration with displacement?
 View Solution
Which of the following graphs represents the variation of activity (A) of a radioactive substance with time (t).
View SolutionThe given graph shows the variation of velocity with displacement. Which one of the graphs given below correctly represents the variation of acceleration with displacement ?
 View Solution


