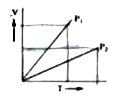
প্রদত্ত V−T লেখচিত্রে চাপ p1 এবং p2 এর মধ্যে সম্পর্ক কী? 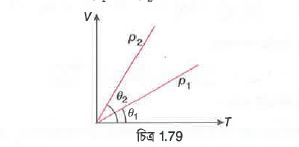
p2<p1
বলা সম্ভব নয়
p2=p1
p_2gtp_1
The correct Answer is:A
Step by step video, text & image solution for প্রদত্ত V-T লেখচিত্রে চাপ p_1 এবং p_2 এর মধ্যে সম্পর্ক কী? by Physics experts to help you in doubts & scoring excellent marks in Class 11 exams.
Updated on:21/07/2023Topper's Solved these Questions
- তাপগতিবিদ্যার প্রথম ও দ্বিতীয় সূত্র BOOK - CHAAYA PRAKASHINI (BENGALI)CHAPTER - তাপগতিবিদ্যার প্রথম ও দ্বিতীয় সূত্র EXERCISE - EXERCISE
106 Videos
- তাপ সঞ্চালন BOOK - CHAAYA PRAKASHINI (BENGALI)CHAPTER - তাপ সঞ্চালন EXERCISE - EXAMPLE
15 Videos
- থার্মোমিতিBOOK - CHAAYA PRAKASHINI (BENGALI)CHAPTER - থার্মোমিতিEXERCISE - EXERCISE
24 Videos
Similar Questions
6g ভরের একটি গুলি 400m/s বেগে একটি লক্ষ্যবস্তুকে আঘাত করলে তার শক্তির 70% তাপে রূপান্তরিত হয়। উৎপন্ন তাপের মান
View Solutionভরসংখ্যা কাকে বলে? পরমাণুর-ক্রমাঙ্কের সঙ্গে এর সম্পর্ক কী?
View Solutionজলের ত্রিদশা বিন্দুর তাপমাত্রা
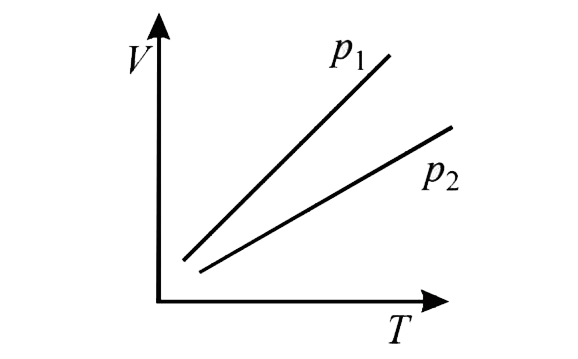
View SolutionThe volume V versus temperature T graphs for a cetain amount of a perfect gas at two pressure p1andp2 are as shown in Fig. It follows from the graphs that p1 is greater than p2.
View SolutionFor V versus T curves at constant pressure P1andP2 for and ideal gas shown in figure-
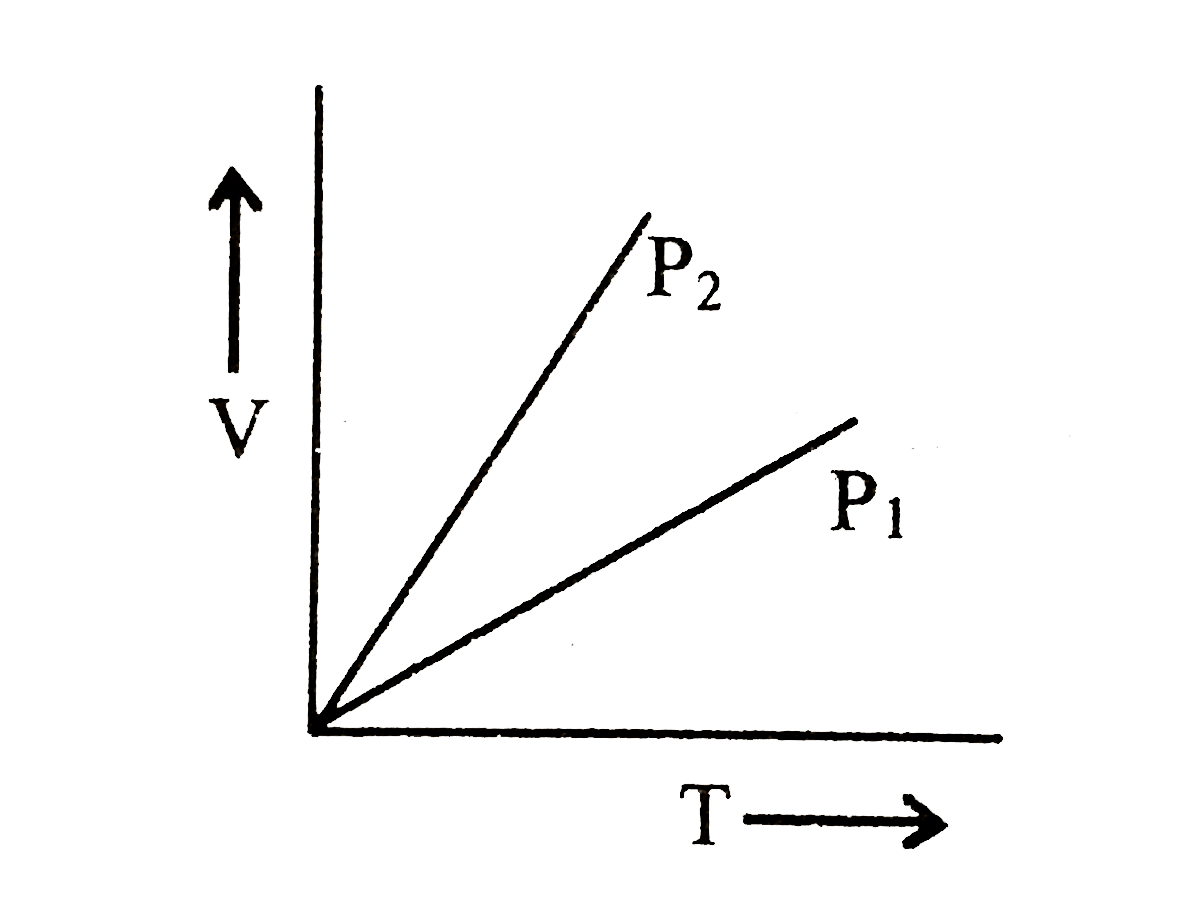
View SolutionIn V-T diagram shown in fig., what is the relation between P1andP2 ?
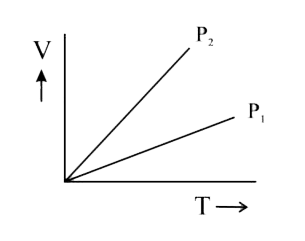
View SolutionFigure 6.18 shows the V-T graph for a fixed mass of an ideal gas at pressure p_1 and p_2 . Can you infer from the graph whether p_1 is greater than p_2 ?
View SolutionTwo bulbs are rated (P_1, V)" and "(P_2, V) . If they are connected (i) in series and (ii) in parallel across a supply V, find the power dissipated in the two combinations in terms of P_1 and P_2 .
View SolutionFor an ideal gas V-T curves as constant pressures P1&P2 are shown in figure - from the figure
View SolutionNaCI, HgCl_2 , Hg_2Cl_2, CuCl_2, CuCl এবং AgCl লবণগুলির মধ্যে জলে সম্পূর্ণ অদ্রবণীয় লবণগুলি হল
View SolutionIf P1 and P2 are two odd prime numbers such that P1>P2 then P21−P22 is
View Solution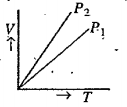
V versus T curves at constant pressure P1 and P2 for an ideal gas are shown in fig.
View SolutionThe volume V versus temperature T graphs for a certain amount of a perfect gas at two pressure p_1 and p_2 are as shown in Fig. Show that p_1 is less than p_2.
View SolutionV vs T curves at constant pressure P_1 and P_2 for an ideal gas are shown in the figure. Which of the following is correct?
View SolutionThe volume V versus temperature T graphs for a certain amount of a perfect gas at two pressure p1andp2 are as shown in Fig. It follows from the graphs that p1 is greater than p2.

View Solution
