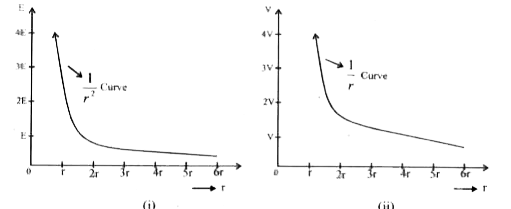
You are given two graphs. What conclusion do you draw from the graphs?
 Solution in Tamil
The total flux passing through a closed surface is zero in magnetic field unlike that of electric flux in electrostatic field .
No, monopole exists in magnetism
Topper's Solved these Questions
- BOOK - NEW JOYTHI PUBLICATIONCHAPTER - MAGNETISM AND MATTEREXERCISE - CONTINUOUS EVALUATION(PROJECT)1videos
MAGNETISM AND MATTER
- BOOK - NEW JOYTHI PUBLICATIONCHAPTER - MAGNETISM AND MATTEREXERCISE - CONTINUOUS EVALUATION(ASSIGNMENT)7videos
MAGNETISM AND MATTER
- BOOK - NEW JOYTHI PUBLICATIONCHAPTER - MAGNETISM AND MATTEREXERCISE - PRACTICE PROBLEMS FOR SELF ASSESSMENT12videos
MAGNETISM AND MATTER
- BOOK - NEW JOYTHI PUBLICATIONCHAPTER - ELECTROSTATIC POTENTIAL AND CAPACITANCEEXERCISE - Competitive Exam Corner22videos
ELECTROSTATIC POTENTIAL AND CAPACITANCE
- BOOK - NEW JOYTHI PUBLICATIONCHAPTER - MOVING CHARGES AND MAGNETISMEXERCISE - COMPETITIVE EXAM CORNER28videos
MOVING CHARGES AND MAGNETISM
Similar Questions
Construction of a buzzer, using electromagnet.
01:39View SolutionDiscuss the various types of magnets .
03:44View SolutionThe magnetic moment is 5Am2 and the pole strength is 25 A.m What is the length of the magnet ?
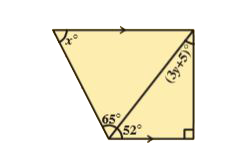
01:38View SolutionFrom the figure find x and y.
 01:38View Solution
A solenoid has core of a material with relative permeability 500 and its windings carry a current of 1 A. The number of turns of the solenoid is 500 per metre. The magnetization of the material is nearly
02:34View SolutionWhat conclusion do you draw when displacement-time graph of a body is as shwon in Figure ?
View SolutionDraw velocity-time graph of a unitorm motion of an object along a straight line. What do you study from this graph ?
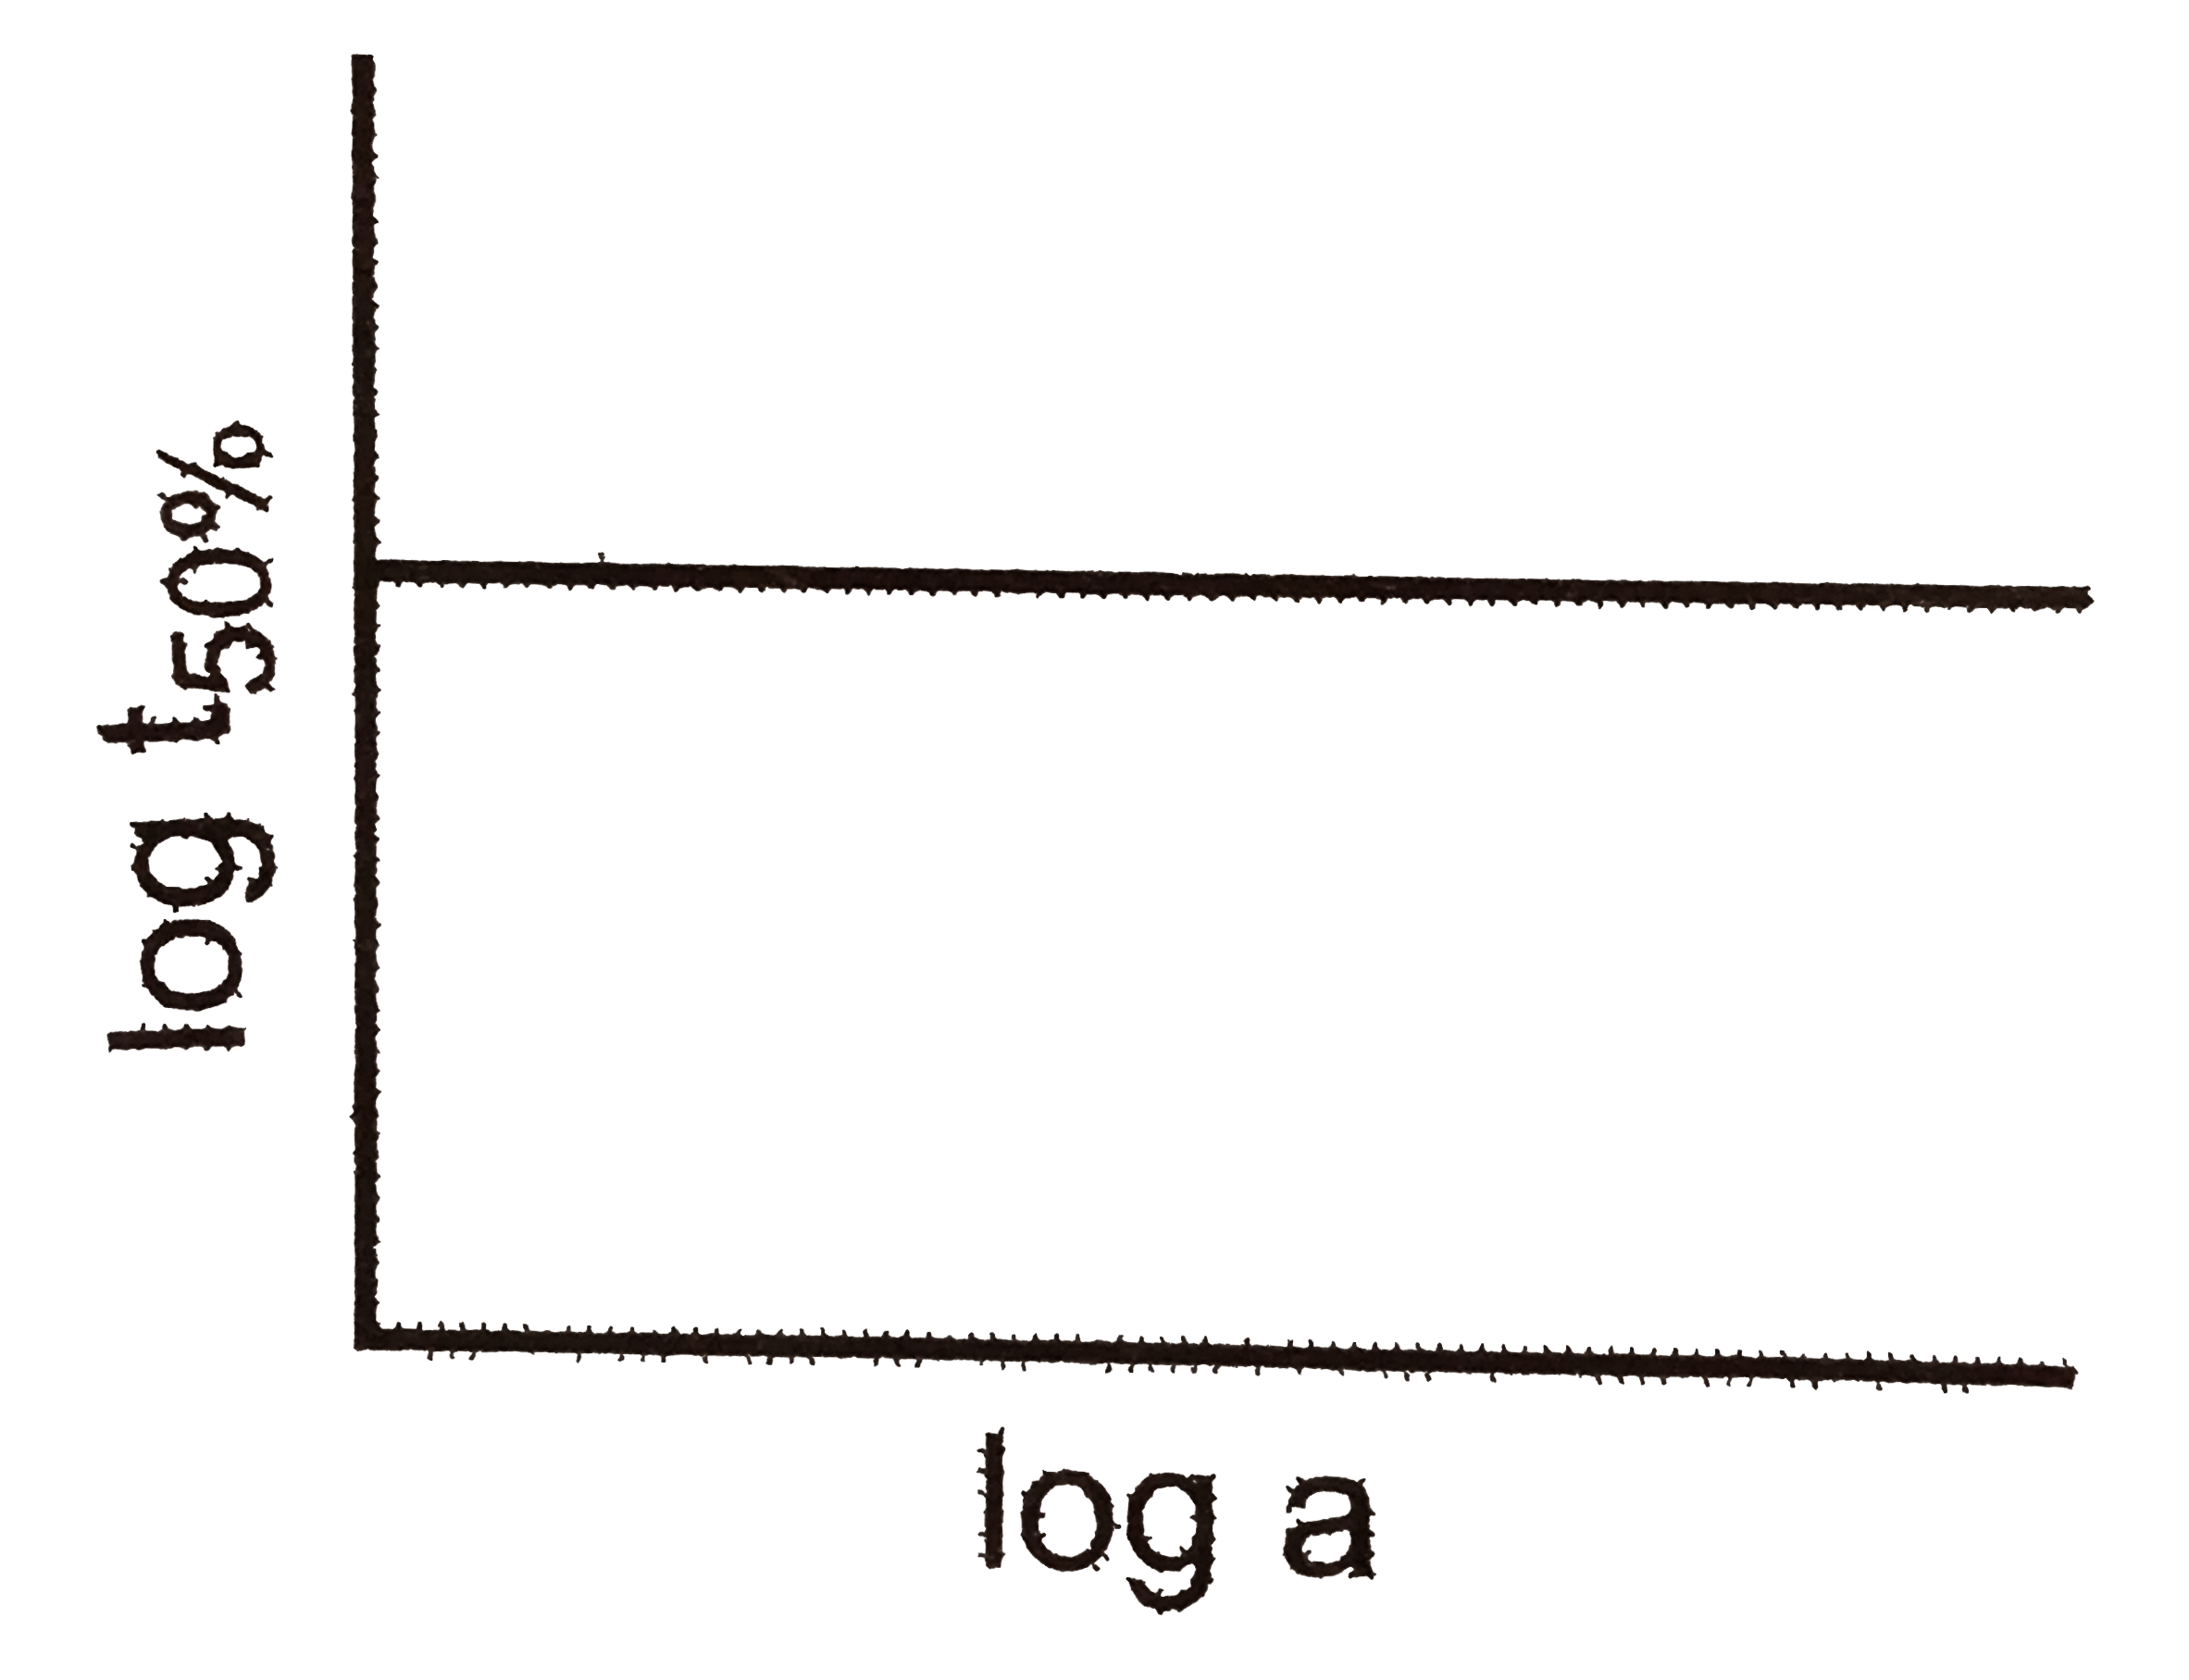
01:30View SolutionA graph plotted between log t50% vs log concentration is a straight line. What conclusion can you draw from this graph?
 01:27View Solution
A graph plotted between log t50% vs log concentration is a straight line. What conclusion can you draw from this graph?
 01:33View Solution
What conclusion would you draw from the following graphs for an ideal gas?
12:59View SolutionA graph plotted between log t_(50%) vs log concentration in a straight line. What conclusion can you draw from this graph?
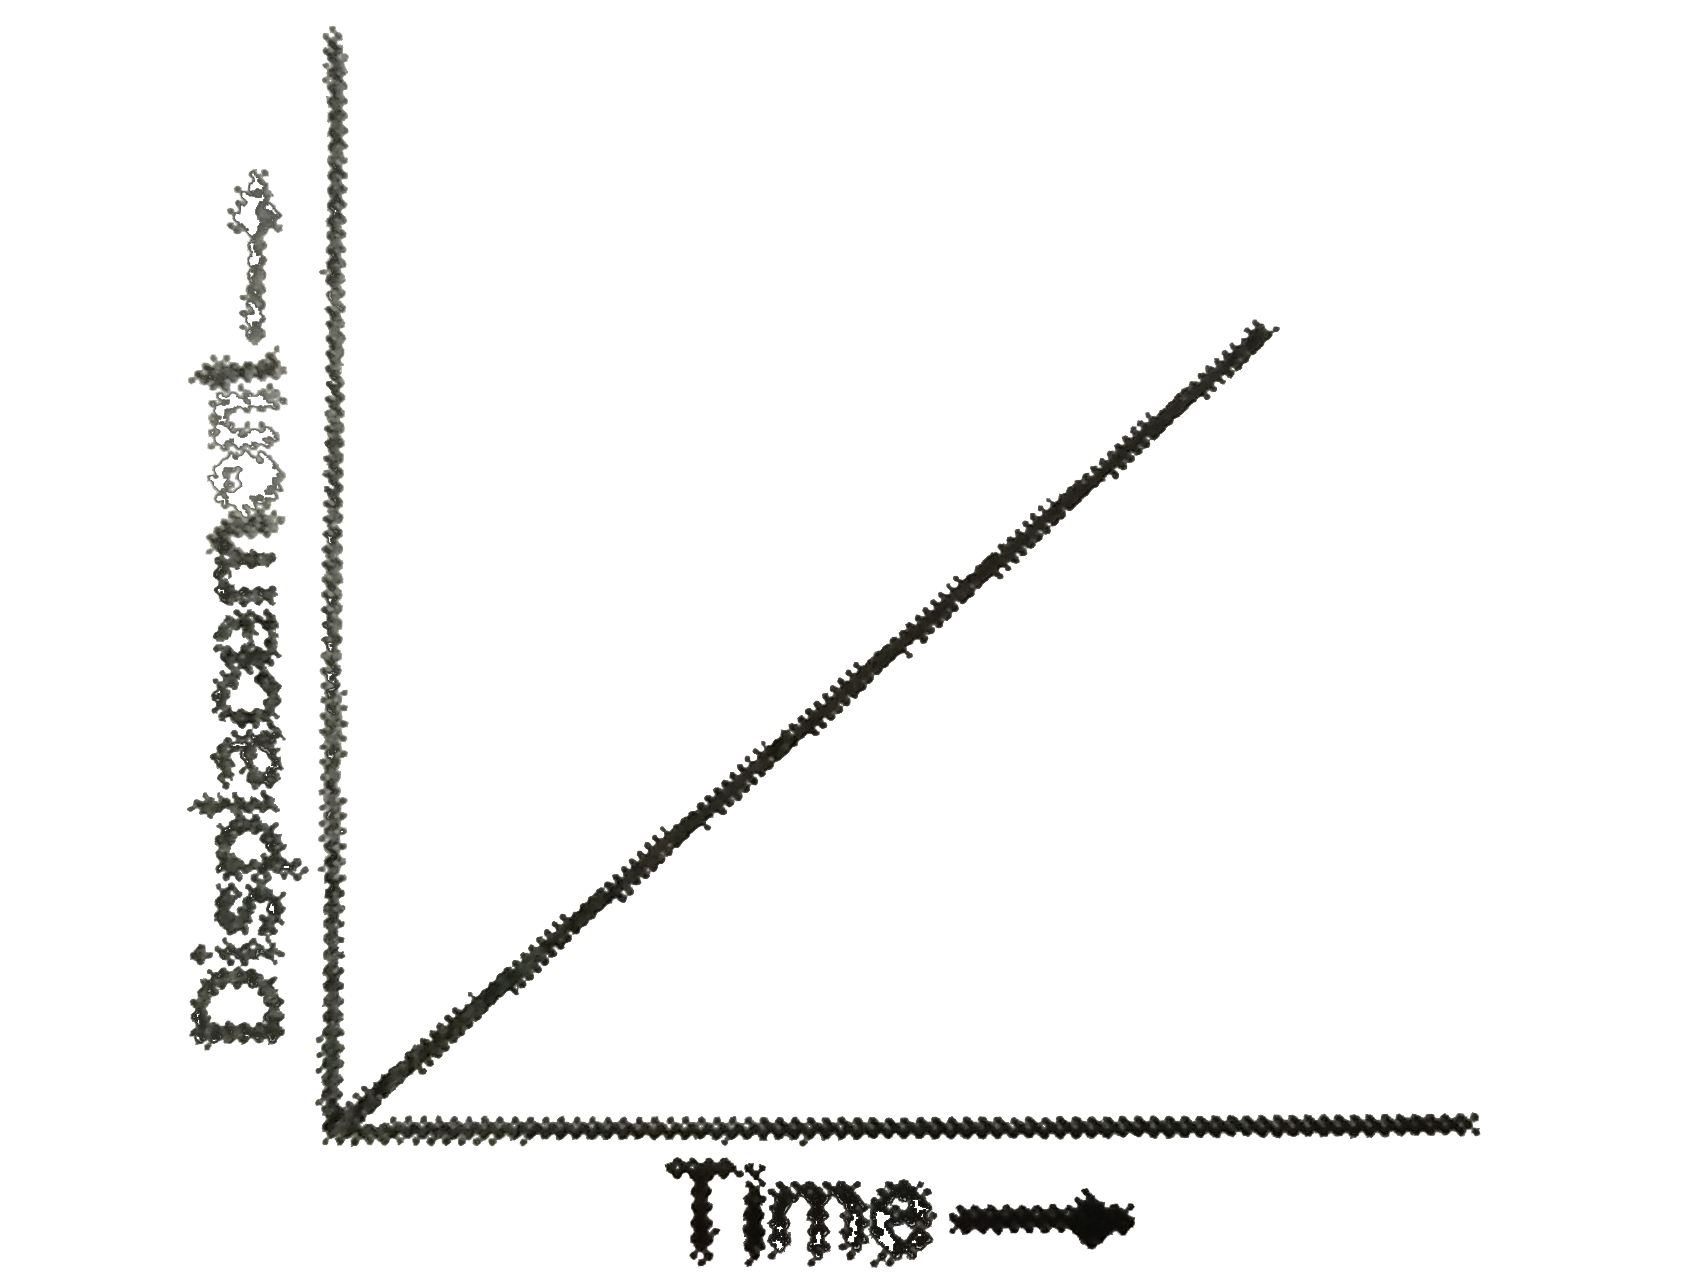
View SolutionWhat conclusion can you draw about the velocity of a body from the displacement-time graph shown below :
 04:17View Solution
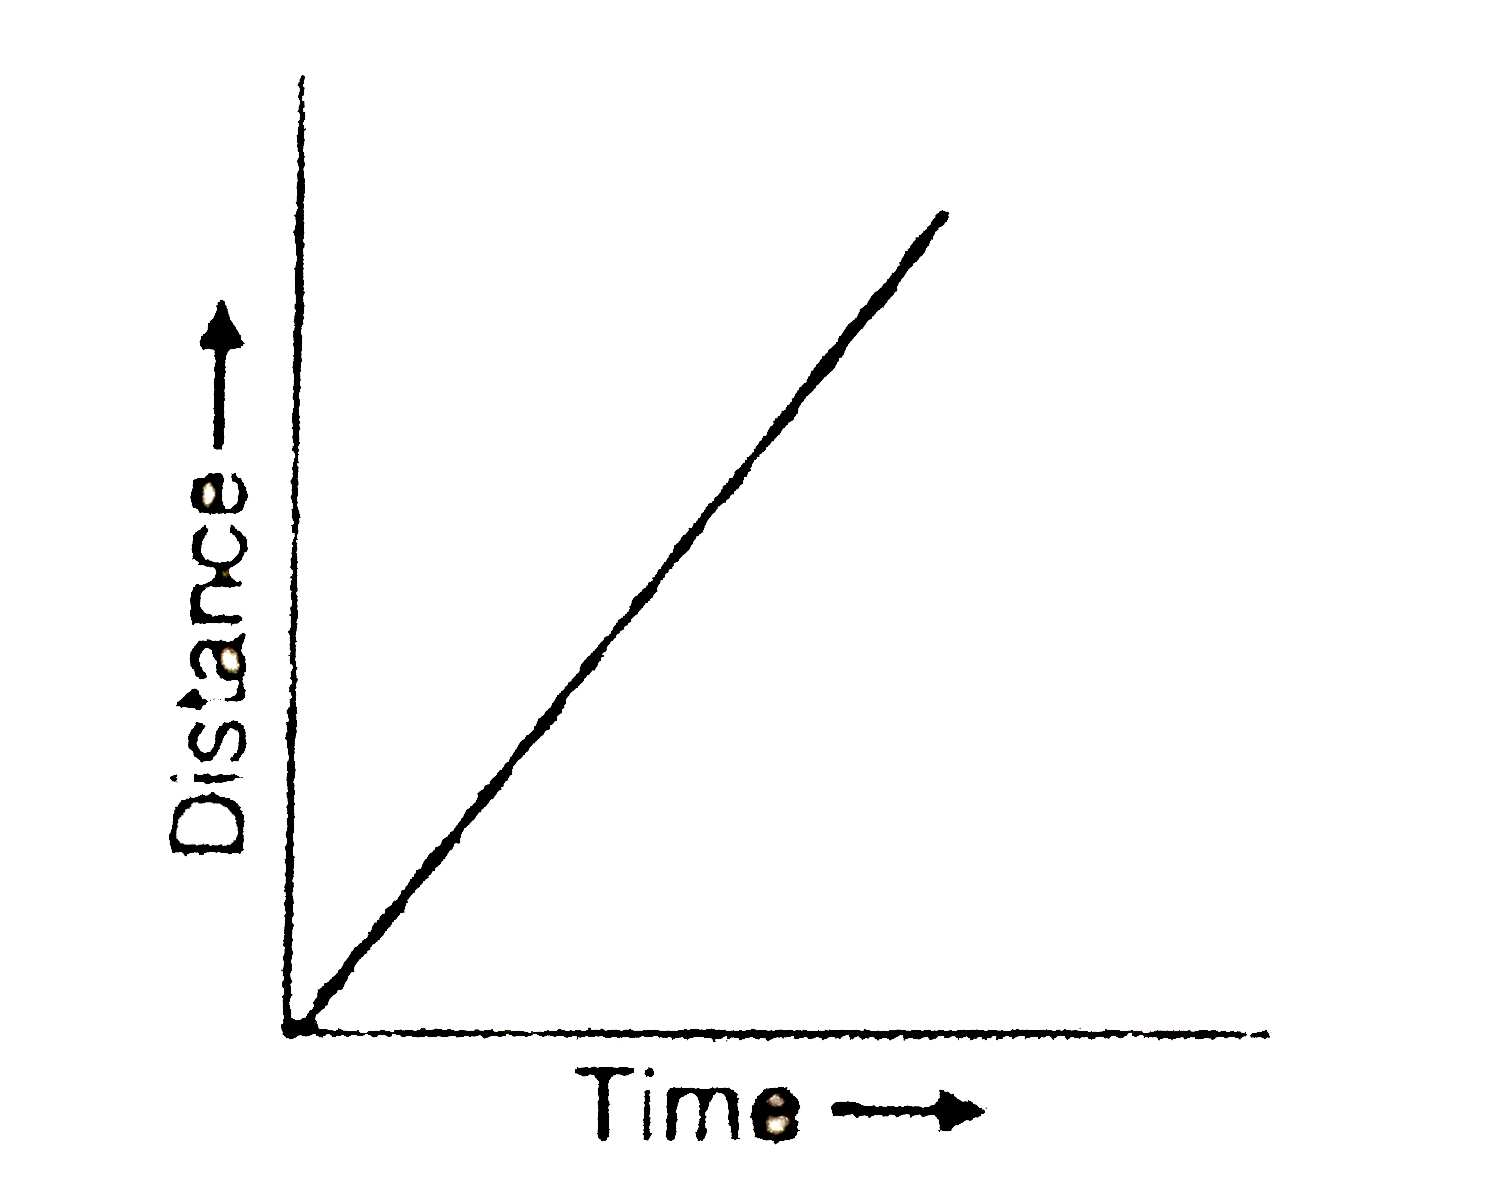
What conclusion can you draw about the speed of a body from the following distance-time graph ?
 02:29View Solution
What conclusion can you draw about the acceleration of a body from the speed-time graph shown below ?
02:49View Solutionनाभिक की बंधन ऊर्जा से आप क्या समझते हैं? नाभिकों की प्रति न्यूक्लिऑन बंधन ऊर्जा तथा द्रव्यमान संख्या की बीच ग्राफ खींचिए। इस ग्राफ को क्या कहते हैं इस ग्राफ से प्राप्त महत्वपूर्ण निष्कर्षों को लिखिए।
01:41View SolutionWhat conclusion can you draw about the acceleration of a body from the speed-time graph shown below ?
05:06View Solution

